ClonalStats
Visualize the clonal information.
Using scplotter to visualize the clonal
information.
Input
screpfile: ThescRepertoireobject in RDS/qs format
Output
outdir: Default:{{in.screpfile | stem}}.clonalstats.
The output directory containing the plots
Environment Variables
mutaters(type=json;order=-9): Default:{}.
The mutaters passed todplyr::mutate()to add new variables.
When the object loaded formin.screpfileis a list, the mutaters will be applied to each element.
The keys are the names of the new variables, and the values are the expressions.
When it is aSeuratobject, typically an output ofscRepertoire::combineExpression(), the mutaters will be applied to themeta.data.cache(type=auto): Default:/tmp.
Whether to cache the plots.
Currently only plots for features are supported, since creating the those plots can be time consuming.
IfTrue, the plots will be cached in the job output directory, which will be not cleaned up when job is rerunning.viz_type(choice): The type of visualization to generate.volume: The volume of the clones usingClonalVolumePlotabundance: The abundance of the clones usingClonalAbundancePlotlength: The length of the CDR3 sequences usingClonalLengthPlotresidency: The residency of the clones usingClonalResidencyPlotstat: The stats of the clones usingClonalStatPlotcomposition: The composition of the clones usingClonalCompositionPlotoverlap: The overlap of the clones usingClonalOverlapPlotdiversity: The diversity of the clones usingClonalDiversityPlotgeneusage: The gene usage of the clones usingClonalGeneUsagePlotpositional: The positional information of the clones usingClonalPositionalPlotkmer: The kmer information of the clones usingClonalKmerPlotrarefaction: The rarefaction curve of the clones usingClonalRarefactionPlot
subset: An expression to subset the data before plotting.
Similar tomutaters, it will be applied to each element bydplyr::filter()if the object loaded formin.screpfileis a list; otherwise, it will be applied tosubset(sobj, subset = <expr>)if the object is aSeuratobject.devpars(ns): The parameters for the plotting device.width(type=int): The width of the deviceheight(type=int): The height of the deviceres(type=int): Default:100.
The resolution of the device
more_formats(list): Default:[].
The extra formats to save the plots in, other than PNG.save_code(flag): Default:False.
Whether to save the code used to generate the plots Note that the data directly used to generate the plots will also be saved in anrdafile.
Be careful if the data is large as it may take a lot of disk space.save_data(flag): Default:False.
Whether to save the data used to generate the plot.descr: The description of the plot, used to show in the report.<more>: The arguments for the plot function See the documentation of the corresponding plot function for the detailscases(type=json): Default:{'Clonal Volume': Diot({'viz_type': 'volume'}), 'Clonal Abundance': Diot({'viz_type': 'abundance'}), 'CDR3 Length': Diot({'viz_type': 'length'}), 'Clonal Diversity': Diot({'viz_type': 'diversity'})}.
The cases to generate the plots if we have multiple cases.
The keys are the names of the cases, and the values are the arguments for the plot function.
The arguments inenvswill be used if not specified incases, except formutaters.
Sections can be specified as the prefix of the case name, separated by::.
For example, if you have a case namedClonal Volume::Case1, the plot will be put in the sectionClonal Volume. By default, when there are multiple cases for the same 'viz_type', the name of the 'viz_type' will be used as the default section name (for example, when 'viz_type' is 'volume', the section name will be 'Clonal Volume').
When there is only a single case, the section name will default to 'DEFAULT', which will not be shown in the report.
Examples
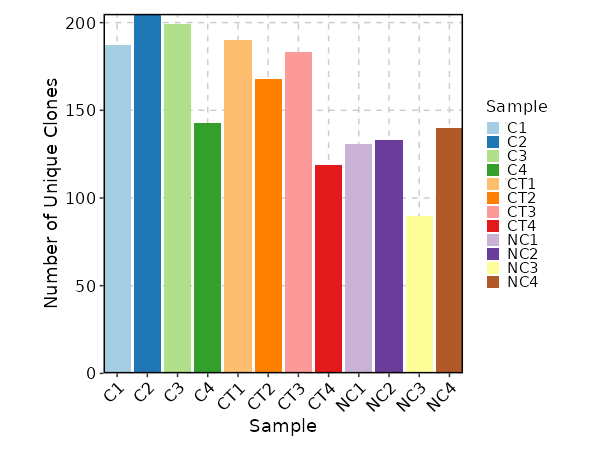
Clonal Volume
[ClonalStats.envs.cases."Clonal Volume"]
viz_type = "volume"
x_text_angle = 45
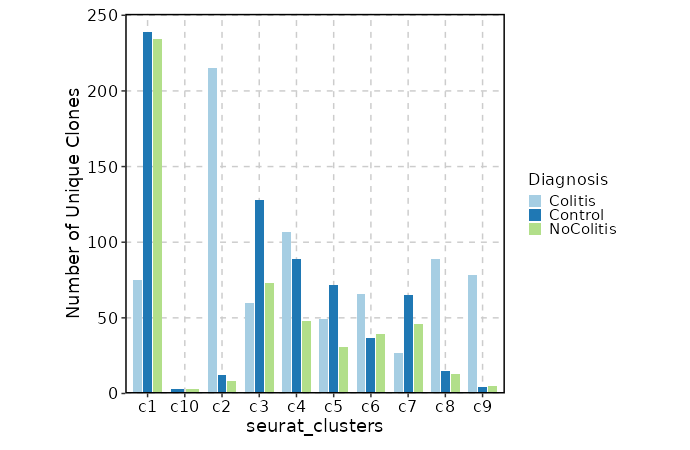
Clonal Volume by Diagnosis
[ClonalStats.envs.cases."Clonal Volume by Diagnosis"]
viz_type = "volume"
x = "seurat_clusters"
group_by = "Diagnosis"
comparisons = true
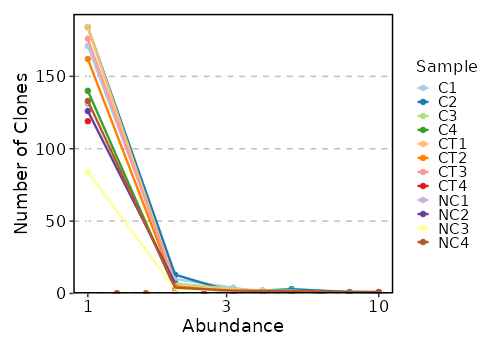
Clonal Abundance
[ClonalStats.envs.cases."Clonal Abundance"]
viz_type = "abundance"
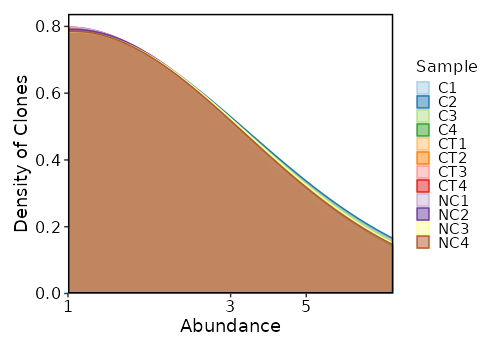
Clonal Abundance Density
[ClonalStats.envs.cases."Clonal Abundance Density"]
viz_type = "abundance"
plot_type = "density"
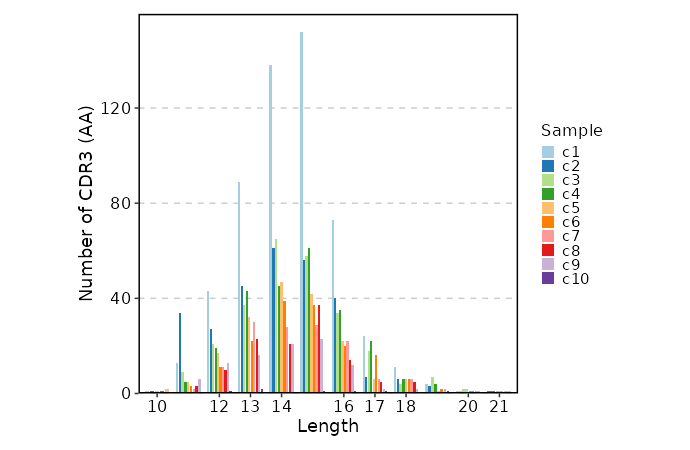
CDR3 Length
[ClonalStats.envs.cases."CDR3 Length"]
viz_type = "length"
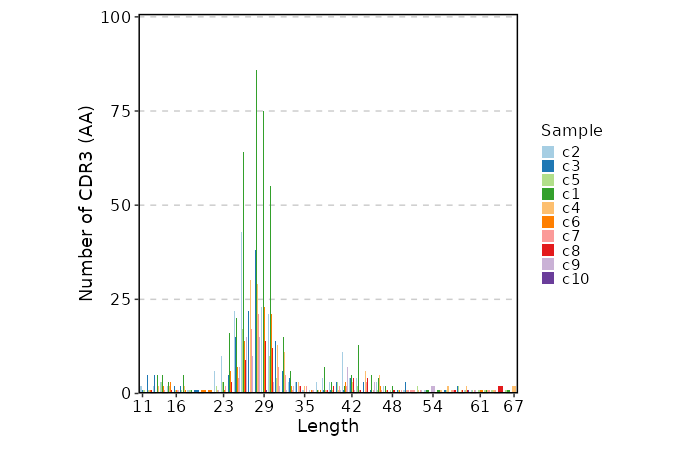
CDR3 Length (Beta Chain)
[ClonalStats.envs.cases."CDR3 Length (Beta Chain)"]
viz_type = "length"
chain = "TRB"
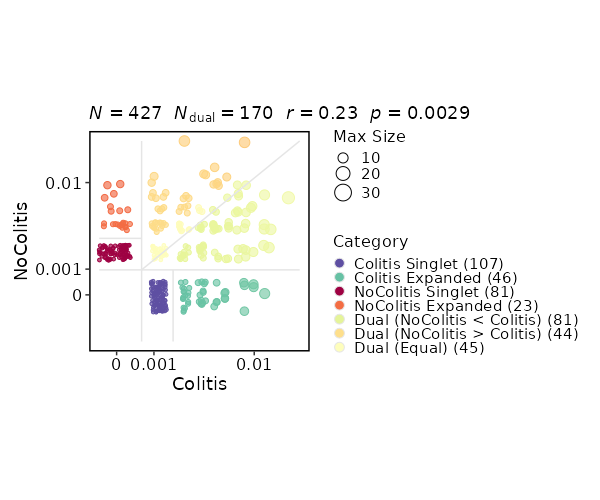
Clonal Residency
[ClonalStats.envs.cases."Clonal Residency"]
viz_type = "residency"
group_by = "Diagnosis"
chain = "TRB"
clone_call = "gene"
groups = ["Colitis", "NoColitis"]
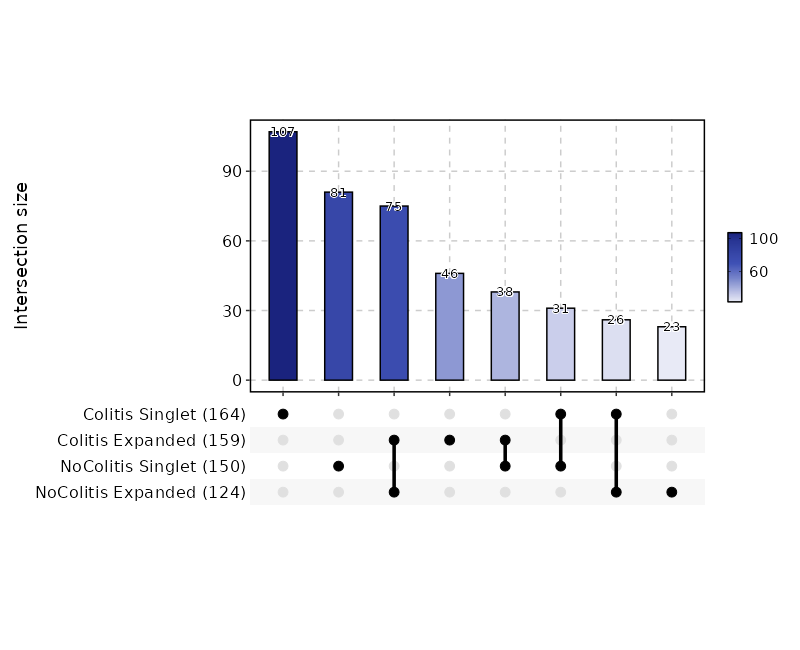
Clonal Residency (UpSet Plot)
[ClonalStats.envs.cases."Clonal Residency (UpSet Plot)"]
viz_type = "residency"
plot_type = "upset"
group_by = "Diagnosis"
chain = "TRB"
clone_call = "gene"
groups = ["Colitis", "NoColitis"]
devpars = {width = 800}
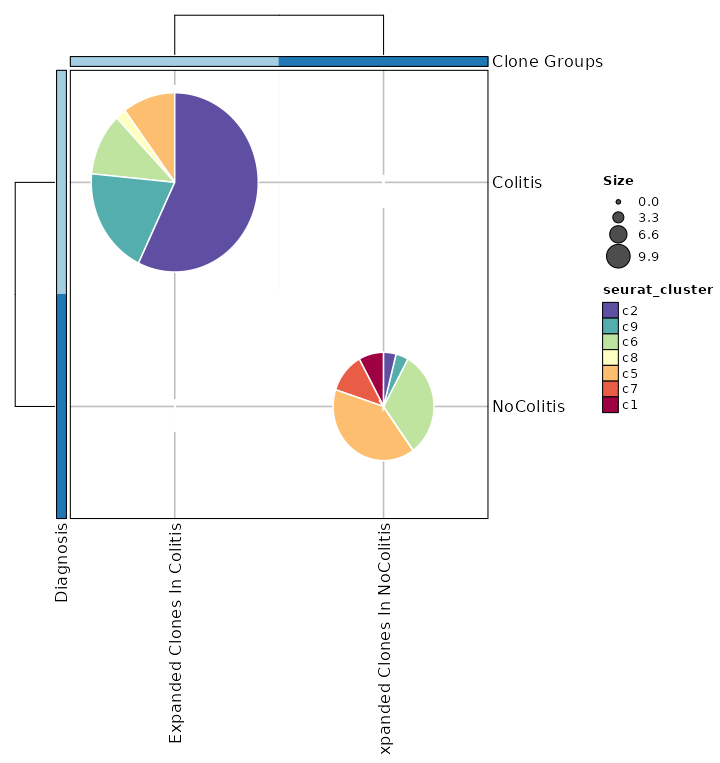
Clonal Statistics with Expanded Clones
[ClonalStats.envs.cases."Clonal Statistics with Expanded Clones"]
viz_type = "stat"
plot_type = "pies"
group_by = "Diagnosis"
groups = ["Colitis", "NoColitis"]
clones = {"Expanded Clones In Colitis" = "sel(Colitis > 2)", "Expanded Clones In NoColitis" = "sel(NoColitis > 2)"}
subgroup_by = "seurat_clusters"
pie_size = "sqrt"
show_row_names = true
show_column_names = true
devpars = {width = 720}
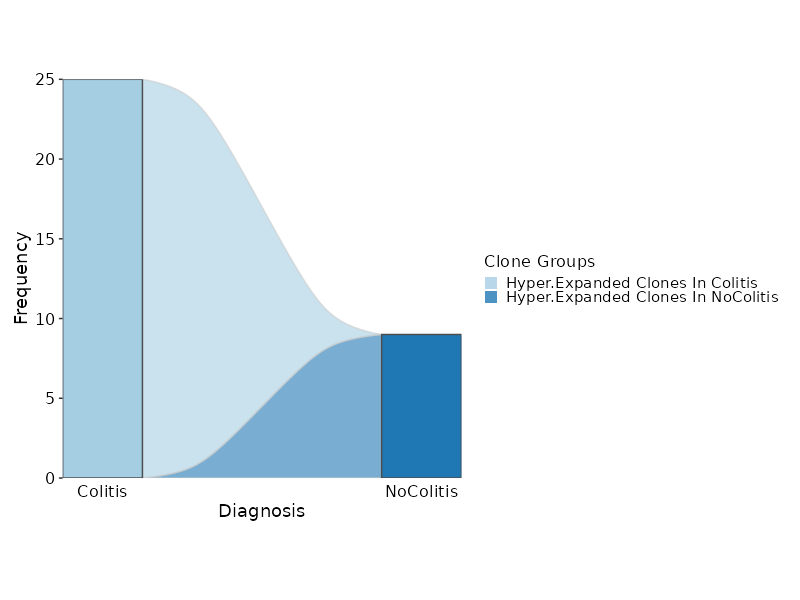
Hyperexpanded Clonal Dynamics
[ClonalStats.envs.cases."Hyperexpanded Clonal Dynamics"]
viz_type = "stat"
plot_type = "sankey"
group_by = "Diagnosis"
chain = "TRB"
groups = ["Colitis", "NoColitis"]
clones = {"Hyper-Expanded Clones In Colitis" = "sel(Colitis > 5)", "Hyper-Expanded Clones In NoColitis" = "sel(NoColitis > 5)"}
devpars = {width = 800}
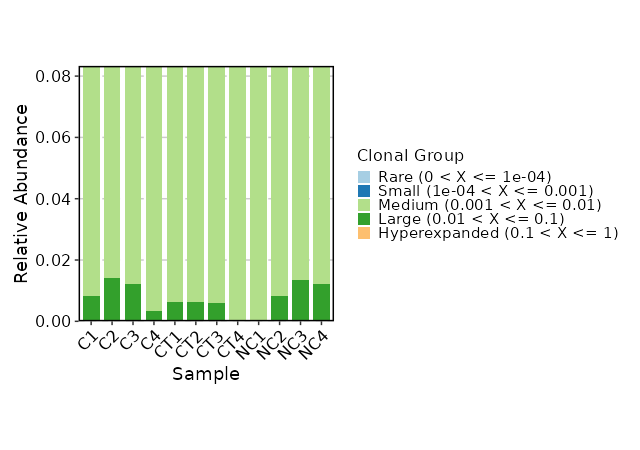
Clonal Composition
[ClonalStats.envs.cases."Clonal Composition"]
viz_type = "composition"
x_text_angle = 45
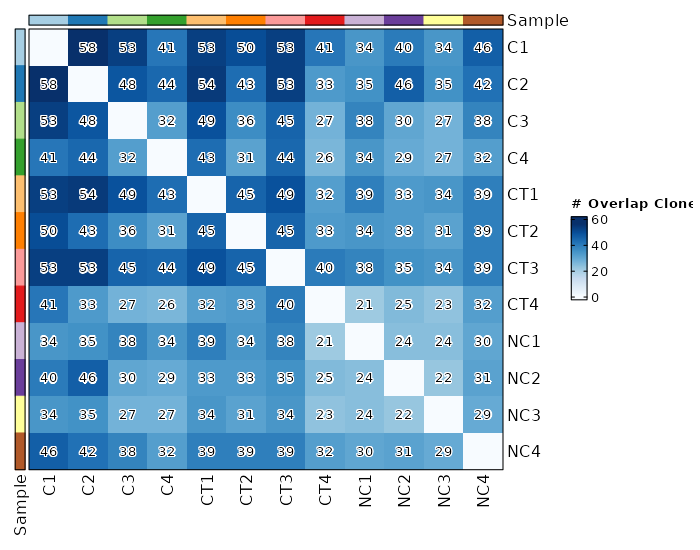
Clonal Overlapping
viz_type = "overlap"
chain = "TRB"
clone_call = "gene"
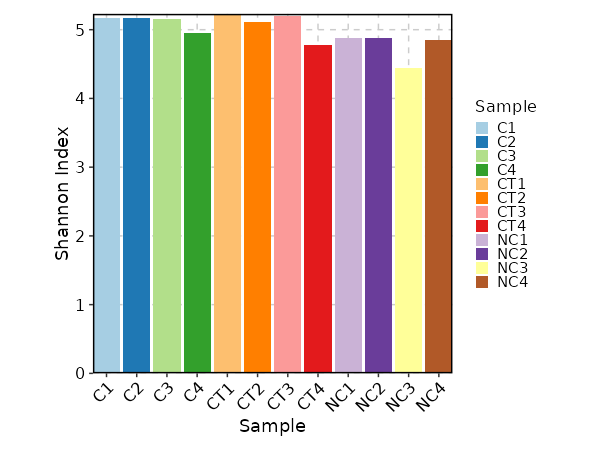
Clonal Diversity
[ClonalStats.envs.cases."Clonal Diversity"]
# method = "shannon"  # default
viz_type = "diversity"
x_text_angle = 45
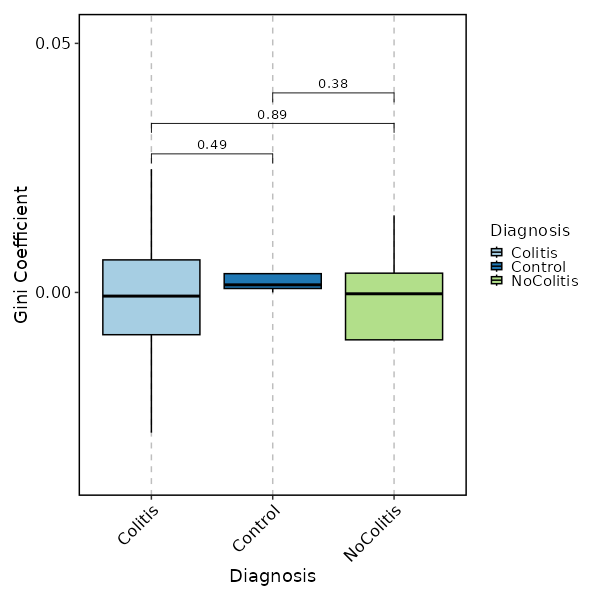
Clonal Diversity (gini.coeff, by Diagnosis)
[ClonalStats.envs.cases."Clonal Diversity (gini.coeff, by Diagnosis)"]
method = "gini.coeff"
viz_type = "diversity"
plot_type = "box"
group_by = "Diagnosis"
comparisons = true
devpars = {height = 600, width = 600}
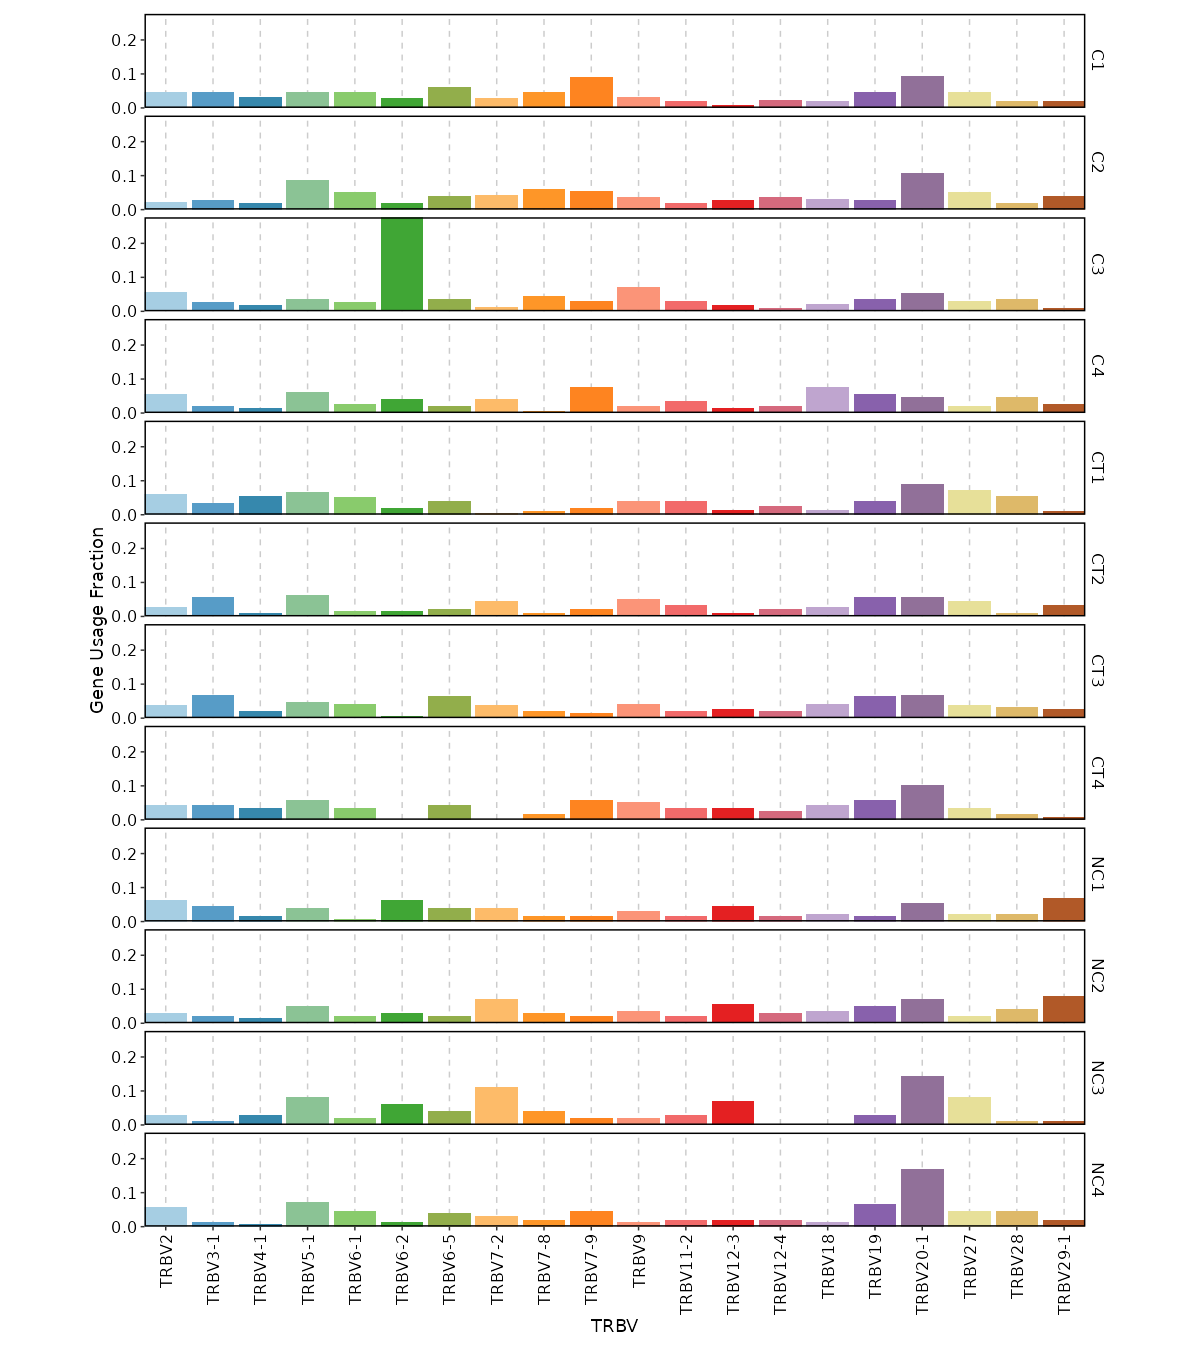
Gene Usage Frequency
[ClonalStats.envs.cases."Gene Usage Frequency"]
viz_type = "geneusage"
devpars = {width = 1200}
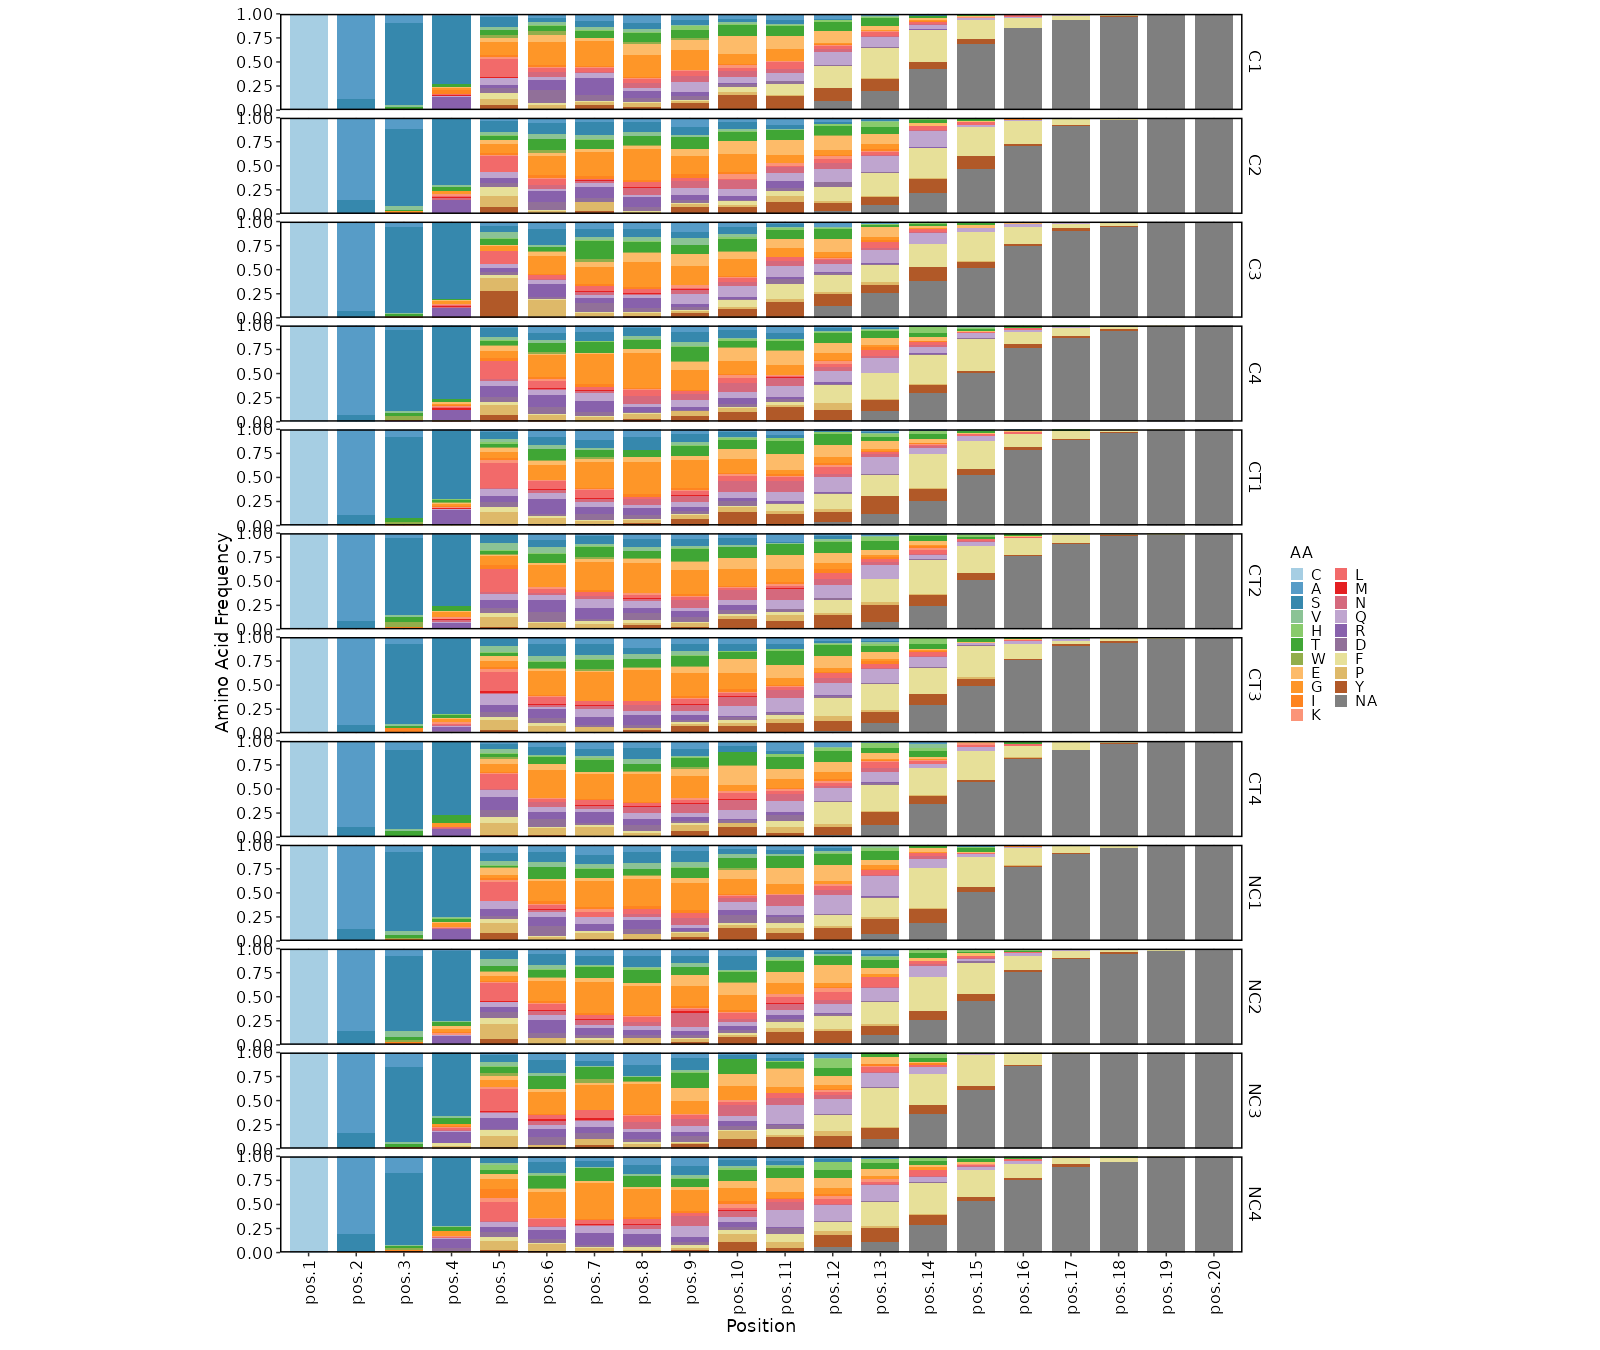
Positional amino acid frequency
[ClonalStats.envs.cases."Positional amino acid frequency"]
viz_type = "positional"
# method = "AA"  # default
devpars = {width = 1600}
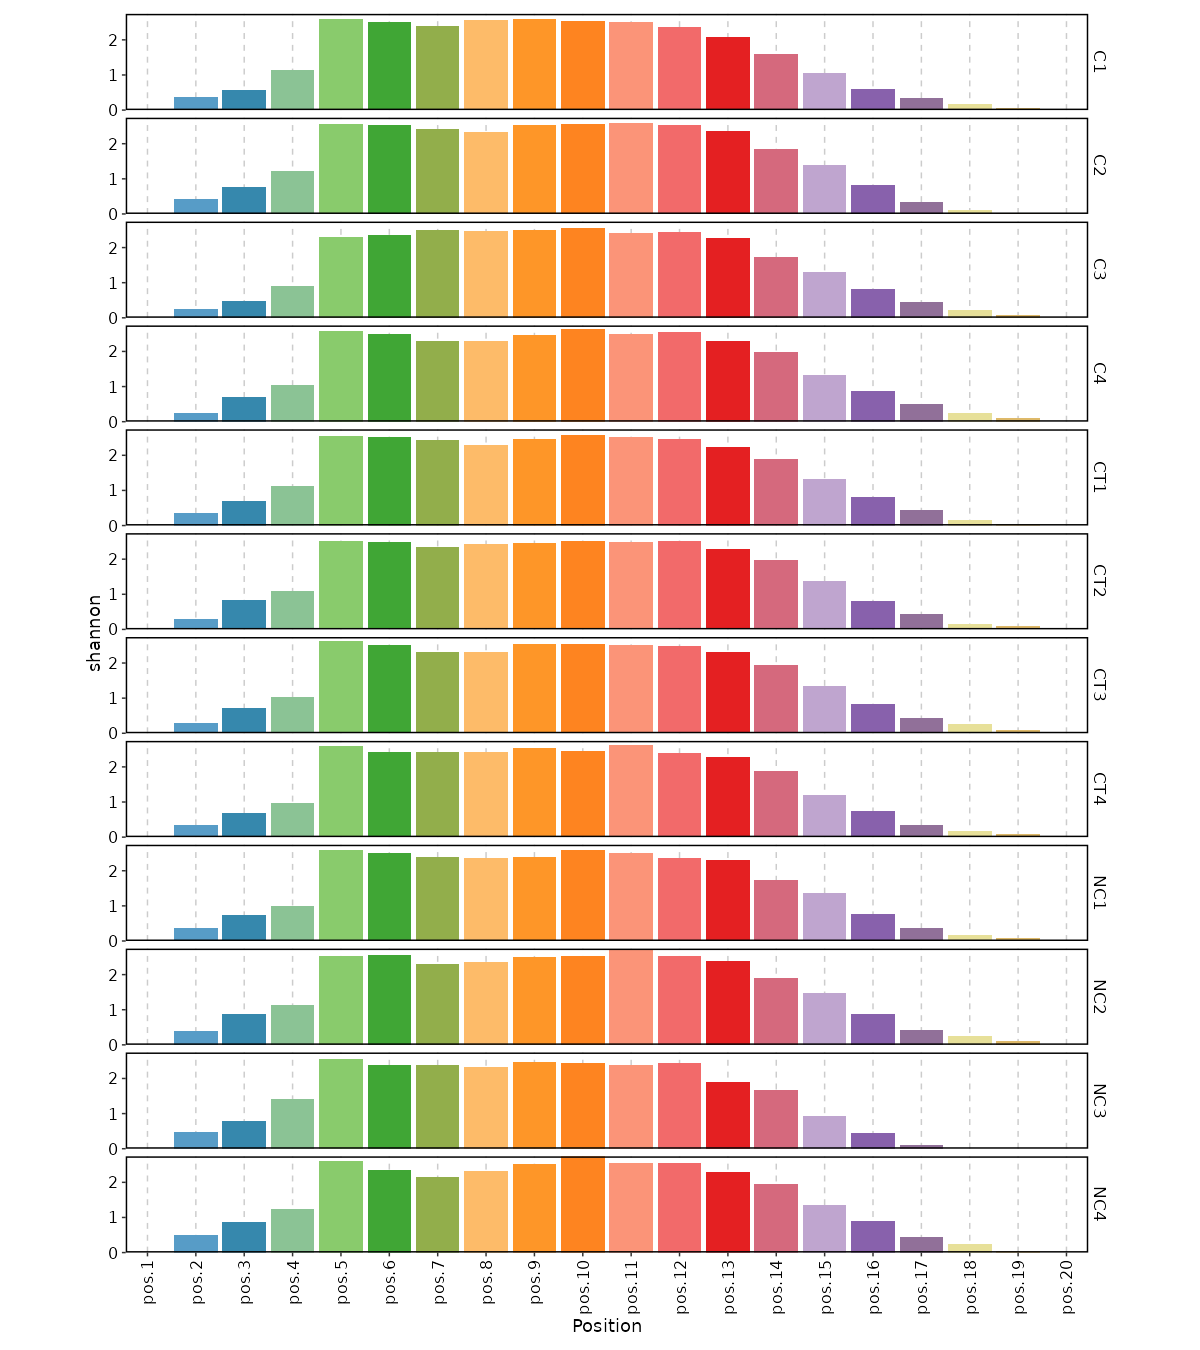
Positional shannon entropy
[ClonalStats.envs.cases."Positional shannon entropy"]
viz_type = "positional"
method = "shannon"
devpars = {width = 1200}
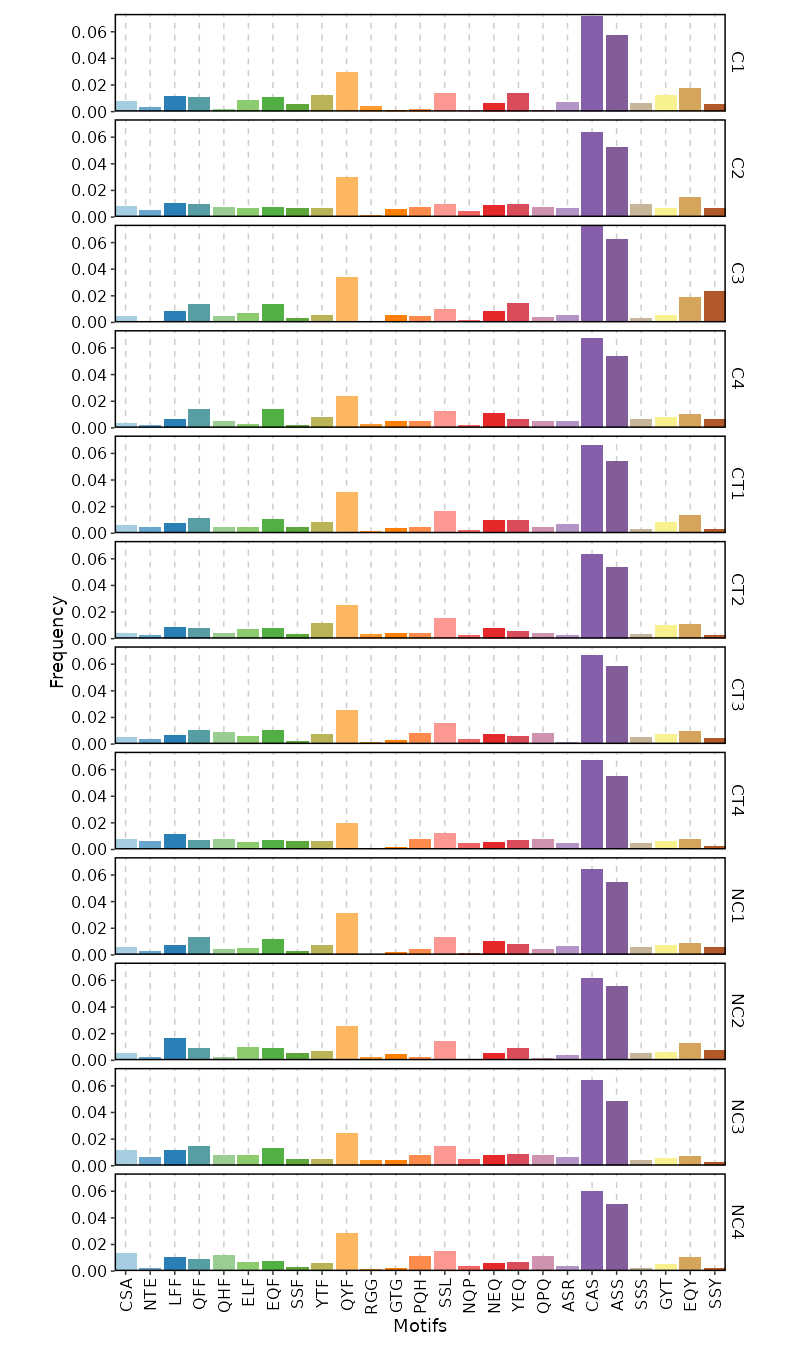
3-Mer Frequency
[ClonalStats.envs.cases."3-Mer Frequency"]
viz_type = "kmer"
k = 3  # default is 3
devpars = {width = 800}
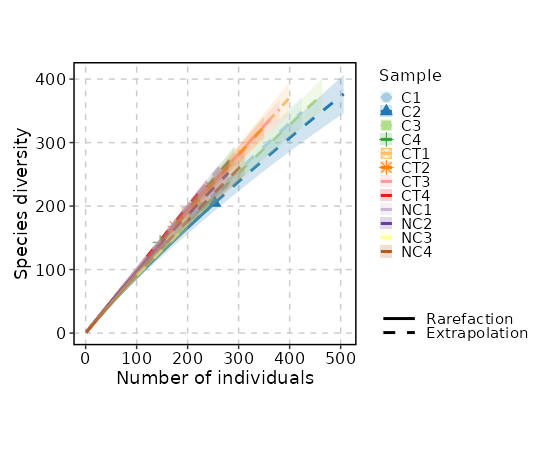
Rarefaction Curve
[ClonalStats.envs.cases."Rarefaction Curve"]
viz_type = "rarefaction"