Plot the overlap of the clones in different samples/groups.
Usage
ClonalOverlapPlot(
  data,
  clone_call = "aa",
  chain = "both",
  group_by = "Sample",
  group_by_sep = "_",
  full = TRUE,
  split_by = NULL,
  order = NULL,
  method = c("raw", "overlap", "morisita", "jaccard", "cosine"),
  palette = "Blues",
  label_accuracy = NULL,
  label_cutoff = 0.001,
  cluster_rows = FALSE,
  cluster_columns = FALSE,
  show_row_names = TRUE,
  show_column_names = TRUE,
  ...
)
Arguments
- data
The product of scRepertoire::combineTCR, scRepertoire::combineTCR, or scRepertoire::combineExpression.
- clone_call
How to call the clone - VDJC gene (gene), CDR3 nucleotide (nt), CDR3 amino acid (aa), VDJC gene + CDR3 nucleotide (strict) or a custom variable in the data
- chain
indicate if both or a specific chain should be used - e.g. "both", "TRA", "TRG", "IGH", "IGL"
- group_by
The column name in the meta data to group the cells. Default: "Sample"
- group_by_sep
The separator used to concatenate the group_by when multiple columns are used.
- full
Whether to plot the full heatmap, or just a triangle. Default is TRUE.
- split_by
The column name in the meta data to split the plots. Default: NULL
- order
The order of the groups. Default is an empty list. It should be a list of values. The names are the column names, and the values are the order.
- method
The method to calculate the overlap. Default is "raw".
"overlap" - overlap coefficient
"morisita" - Morisita’s overlap index
"jaccard" - Jaccard index
"cosine" - cosine similarity
"raw" - exact number of overlapping clones See also scRepertoire::clonalOverlap.
- palette
The color palette to use. Default is "Blues".
- label_accuracy
The accuracy of the labels. Default is NULL. If NULL, it will be 1 for "raw" and 0.01 for other methods.
- label_cutoff
The cutoff for the labels to show. Default is 1e-3.
- cluster_rows
Whether to cluster the rows. Default is FALSE.
- cluster_columns
Whether to cluster the columns. Default is FALSE.
- show_row_names
Whether to show the row names. Default is TRUE.
- show_column_names
Whether to show the column names. Default is TRUE.
- ...
Other arguments passed to the specific plot function
plotthis::Heatmap().
Examples
# \donttest{
set.seed(8525)
data(contig_list, package = "scRepertoire")
data <- scRepertoire::combineTCR(contig_list,
samples = c("P17B", "P17L", "P18B", "P18L", "P19B","P19L", "P20B", "P20L"))
data <- scRepertoire::addVariable(data,
variable.name = "Type",
variables = factor(rep(c("B", "L"), 4), levels = c("L", "B"))
)
data <- scRepertoire::addVariable(data,
variable.name = "Subject",
variables = rep(c("P17", "P18", "P19", "P20"), each = 2)
)
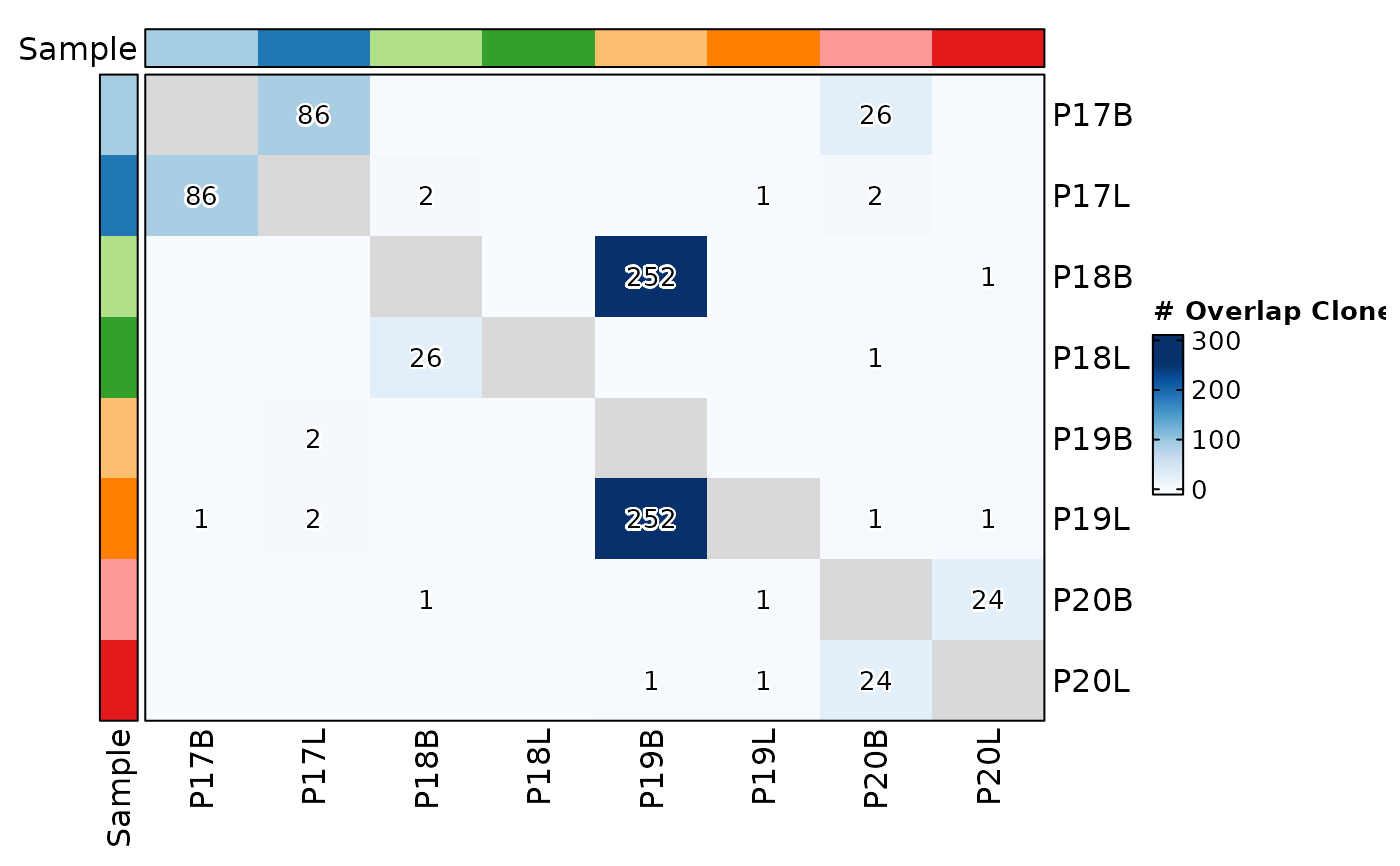
ClonalOverlapPlot(data)
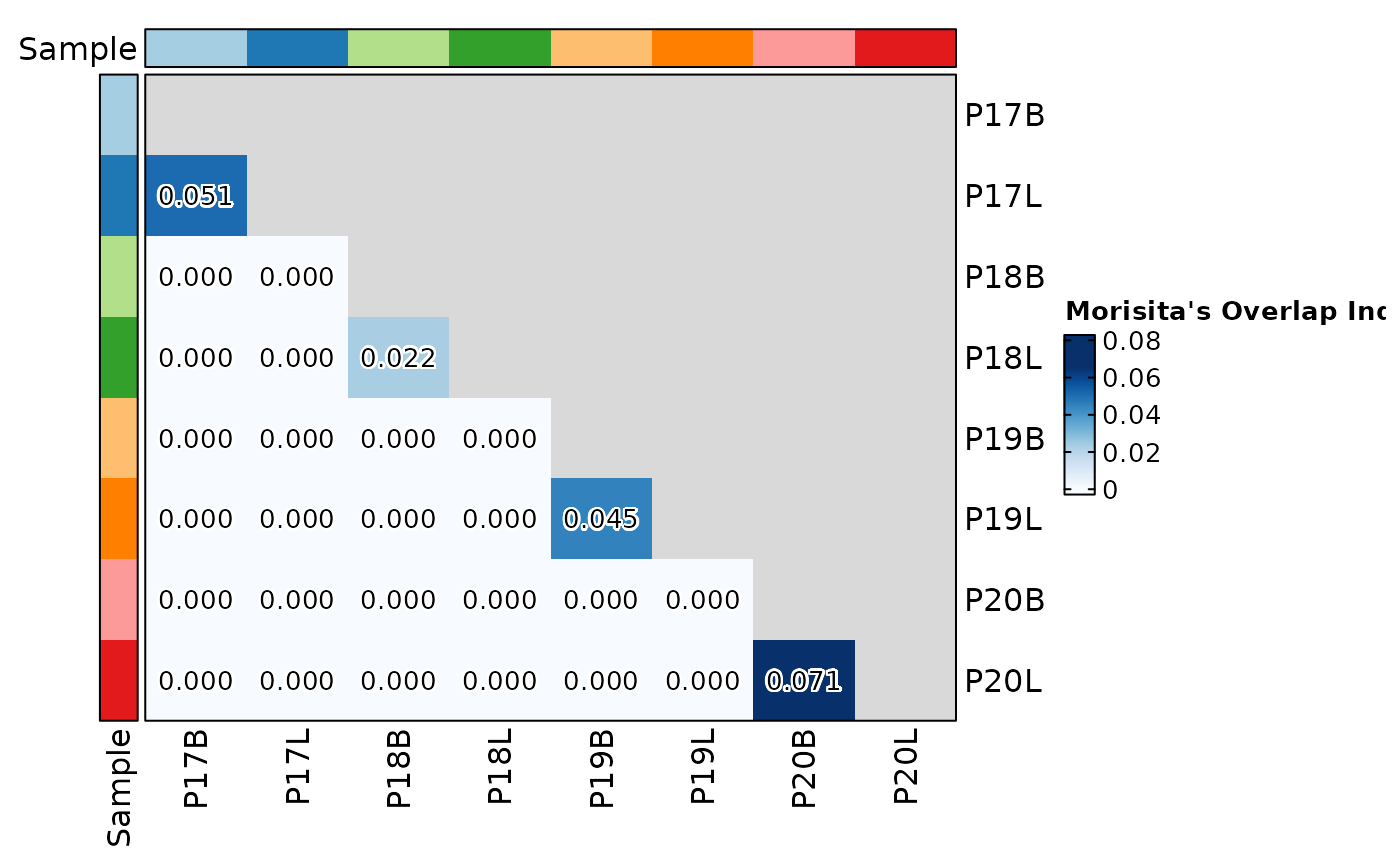
 ClonalOverlapPlot(data, clone_call = "strict", label_cutoff = 0,
label_accuracy = 0.001, method = "morisita", full = FALSE)
ClonalOverlapPlot(data, clone_call = "strict", label_cutoff = 0,
label_accuracy = 0.001, method = "morisita", full = FALSE)
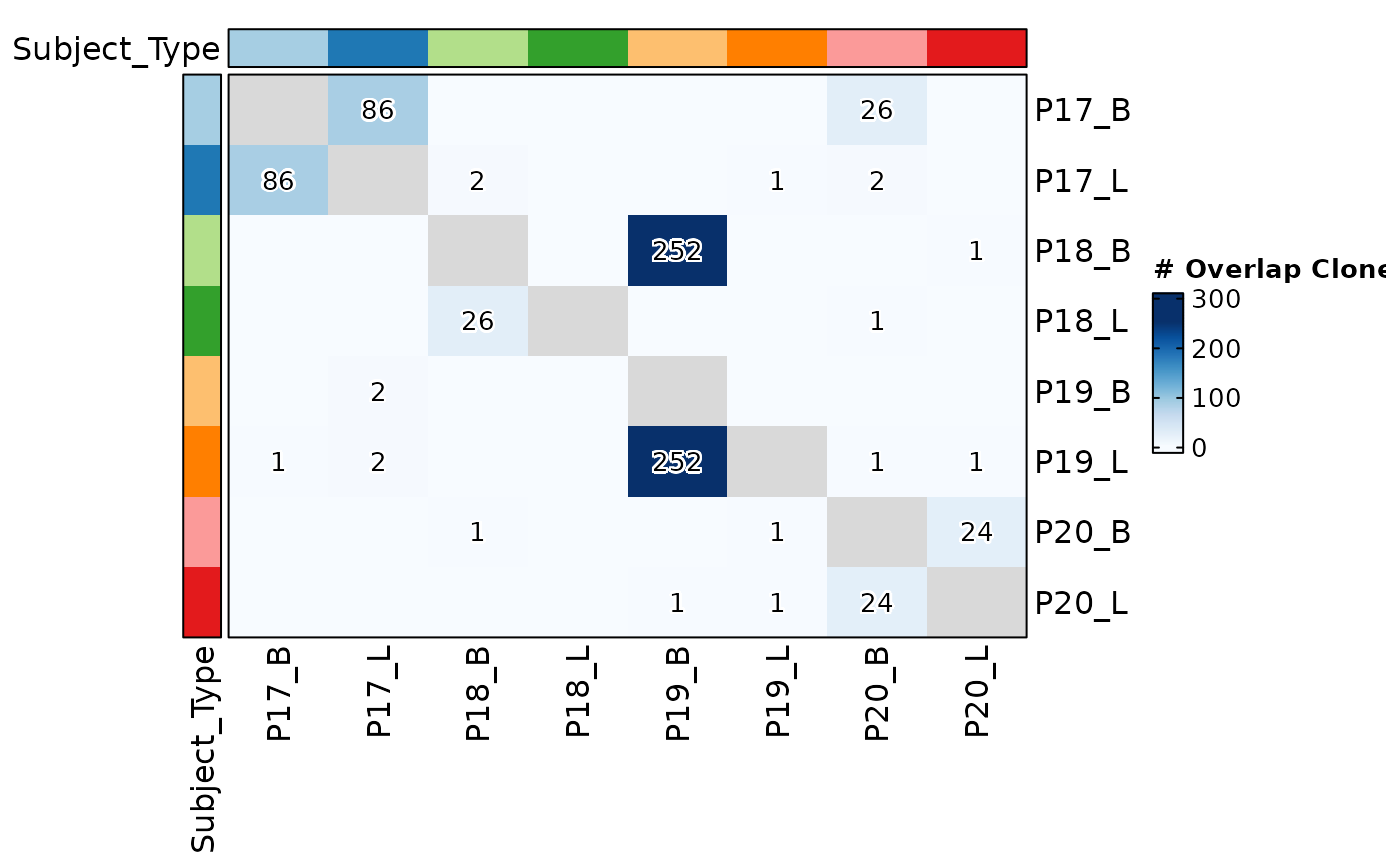
 ClonalOverlapPlot(data, group_by = c("Subject", "Type"))
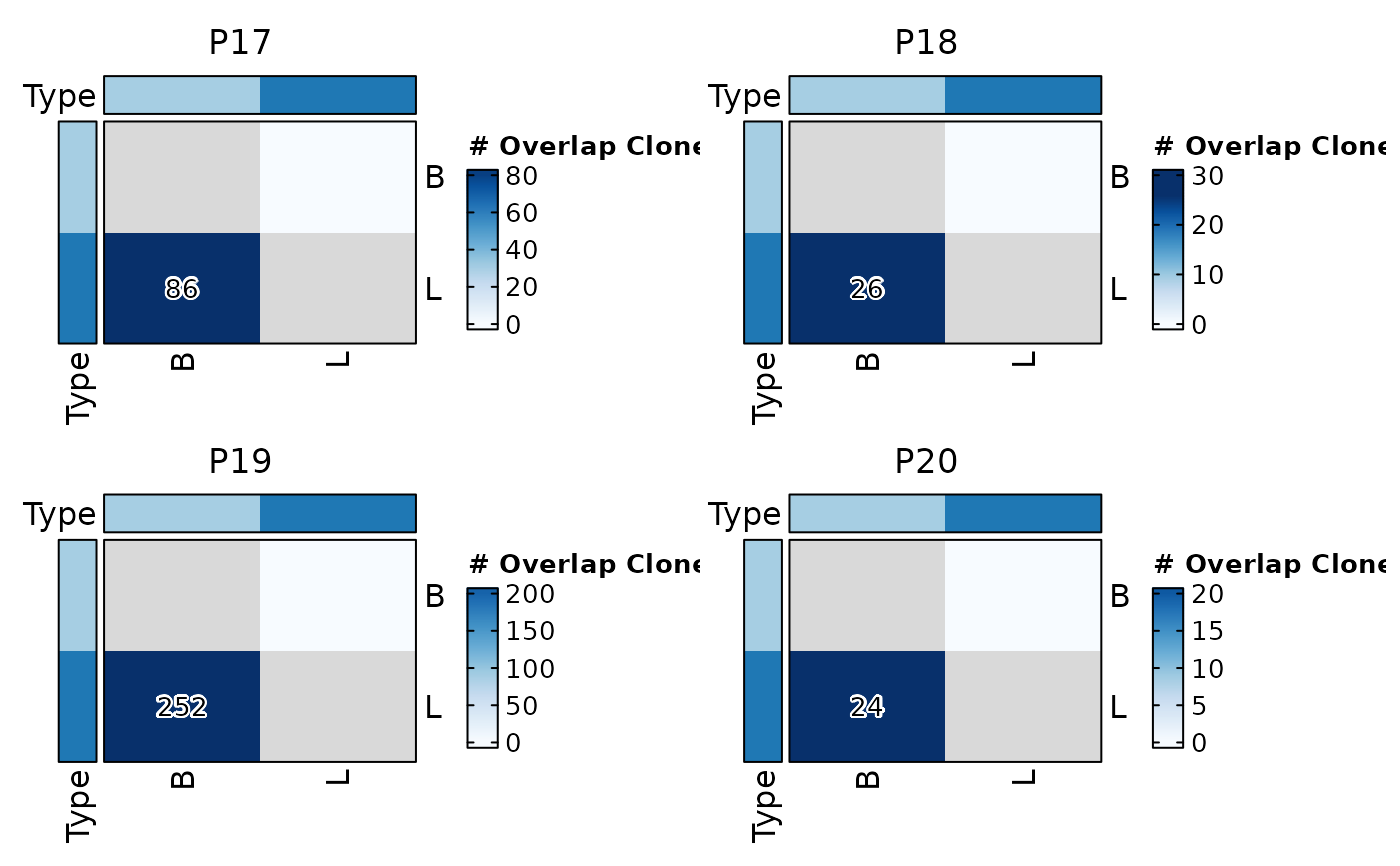
 ClonalOverlapPlot(data, group_by = "Type", split_by = "Subject")
 # }
# }