Heatmap is a popular way to visualize data in matrix format. It is widely used in biology to visualize gene expression data in microarray and RNA-seq data. The heatmap is a matrix where rows represent the samples and columns represent the features. The color of each cell represents the value of the feature in the sample. The color can be continuous or discrete. The heatmap can be split by the columns or rows to show the subgroups in the data. The heatmap can also be annotated by the columns or rows to show the additional information of the samples or features.
Usage
Heatmap(
  data,
  values_by = NULL,
  values_fill = NA,
  name = NULL,
  in_form = c("auto", "matrix", "wide-columns", "wide-rows", "long"),
  split_by = NULL,
  split_by_sep = "_",
  rows_by = NULL,
  rows_by_sep = "_",
  rows_split_by = NULL,
  rows_split_by_sep = "_",
  columns_by = NULL,
  columns_by_sep = "_",
  columns_split_by = NULL,
  columns_split_by_sep = "_",
  rows_data = NULL,
  columns_data = NULL,
  keep_na = FALSE,
  keep_empty = FALSE,
  rows_orderby = NULL,
  columns_orderby = NULL,
  columns_name = NULL,
  columns_split_name = NULL,
  rows_name = NULL,
  rows_split_name = NULL,
  palette = "RdBu",
  palcolor = NULL,
  palreverse = FALSE,
  pie_size_name = "size",
  pie_size = NULL,
  pie_values = "length",
  pie_name = NULL,
  pie_group_by = NULL,
  pie_group_by_sep = "_",
  pie_palette = "Spectral",
  pie_palcolor = NULL,
  bars_sample = 100,
  label = identity,
  label_size = 10,
  label_color = "black",
  label_name = "label",
  mark = identity,
  mark_color = "black",
  mark_size = 1,
  mark_name = "mark",
  violin_fill = NULL,
  boxplot_fill = NULL,
  dot_size = 8,
  dot_size_name = "size",
  legend_items = NULL,
  legend_discrete = FALSE,
  legend.position = "right",
  legend.direction = "vertical",
  lower_quantile = 0,
  upper_quantile = 0.99,
  lower_cutoff = NULL,
  upper_cutoff = NULL,
  add_bg = FALSE,
  bg_alpha = 0.5,
  add_reticle = FALSE,
  reticle_color = "grey",
  cluster_columns = NULL,
  cluster_rows = NULL,
  show_row_names = NULL,
  show_column_names = NULL,
  border = TRUE,
  title = NULL,
  column_title = NULL,
  row_title = NULL,
  na_col = "grey85",
  row_names_side = "right",
  column_names_side = "bottom",
  column_annotation = NULL,
  column_annotation_side = "top",
  column_annotation_palette = "Paired",
  column_annotation_palcolor = NULL,
  column_annotation_type = "auto",
  column_annotation_params = list(),
  column_annotation_agg = NULL,
  row_annotation = NULL,
  row_annotation_side = "left",
  row_annotation_palette = "Paired",
  row_annotation_palcolor = NULL,
  row_annotation_type = "auto",
  row_annotation_params = list(),
  row_annotation_agg = NULL,
  flip = FALSE,
  alpha = 1,
  seed = 8525,
  padding = 15,
  base_size = 1,
  aspect.ratio = NULL,
  draw_opts = list(),
  layer_fun_callback = NULL,
  cell_type = c("tile", "bars", "label", "mark", "label+mark", "mark+label", "dot",
    "violin", "boxplot", "pie"),
  cell_agg = NULL,
  combine = TRUE,
  nrow = NULL,
  ncol = NULL,
  byrow = TRUE,
  axes = NULL,
  axis_titles = axes,
  guides = NULL,
  design = NULL,
  ...
)
Arguments
- data
A data frame or matrix containing the data to be plotted. Based on the
in_form, the data can have the following formats:matrix: A matrix with rows and columns directly representing the heatmap.long: A data frame in long format with columns for values, rows, and columns.wide-rows: A data frame in wide format with columns for heatmap rows and values, and a single column for heatmap columns.wide-columns: A data frame in wide format with columns for heatmap columns and values, and a single column for heatmap rows.auto: Automatically inferred from the data format. Whendatais a matrix,in_formis set to"matrix". Whencolumns_byhas more than one column,in_formis set to"wide-columns". Whenrows_byhas more than one column,in_formis set to"wide-rows". Otherwise, it is set to"long".
- values_by
A character of column name in
datathat contains the values to be plotted. This is required whenin_formis"long". For other formats, the values are pivoted into a column named byvalues_by.- values_fill
A value to fill in the missing values in the heatmap. When there is missing value in the data, the cluster_rows and cluster_columns will fail.
- name
A character string to name the heatmap (will be used to rename
values_by).- in_form
The format of the data. Can be one of
"matrix","long","wide-rows","wide-columns", or"auto". Defaults to"auto".- split_by
A character of column name in
datathat contains the split information to split into multiple heatmaps. This is used to create a list of heatmaps, one for each level of the split. Defaults toNULL, meaning no split.- split_by_sep
A character string to concat multiple columns in
split_by.- rows_by
A vector of column names in
datathat contains the row information. This is used to create the rows of the heatmap. Whenin_formis"long"or"wide-columns", this is requied, and multiple columns can be specified, which will be concatenated byrows_by_sepinto a single column.- rows_by_sep
A character string to concat multiple columns in
rows_by.- rows_split_by
A character of column name in
datathat contains the split information for rows.- rows_split_by_sep
A character string to concat multiple columns in
rows_split_by.- columns_by
A vector of column names in
datathat contains the column information. This is used to create the columns of the heatmap. Whenin_formis"long"or"wide-rows", this is required, and multiple columns can be specified, which will be concatenated bycolumns_by_sepinto a single column.- columns_by_sep
A character string to concat multiple columns in
columns_by.- columns_split_by
A character of column name in
datathat contains the split information for columns.- columns_split_by_sep
A character string to concat multiple columns in
columns_split_by.- rows_data
A data frame containing additional data for rows, which can be used to add annotations to the heatmap. It will be joined to the main data by
rows_byandsplit_byifsplit_byexists inrows_data. This is useful for adding additional information to the rows of the heatmap.- columns_data
A data frame containing additional data for columns, which can be used to add annotations to the heatmap. It will be joined to the main data by
columns_byandsplit_byifsplit_byexists incolumns_data. This is useful for adding additional information to the columns of the heatmap.- keep_na
Whether we should keep NA groups in rows, columns and split_by variables. Default is FALSE. FALSE to remove NA groups; TRUE to keep NA groups. A vector of column names can also be provided to specify which columns to keep NA groups. Note that the record will be removed if any of the grouping columns has NA and is not specified to keep NA.
- keep_empty
One of FALSE, TRUE and "level". It can also take a named list to specify different behavior for different columns. Without a named list, the behavior applies to the categorical/character columns used on the plot, for example, the
x,group_by,fill_by, etc.FALSE(default): Drop empty factor levels from the data before plotting.TRUE: Keep empty factor levels and show them as a separate category in the plot."level": Keep empty factor levels, but do not show them in the plot. But they will be assigned colors from the palette to maintain consistency across multiple plots. Alias:levels
- rows_orderby
A expression (in character) to specify how to order rows. It will be evaluated in the context of the data frame used for rows (after grouping by rows_split_by and rows_by). The expression should return a vector of the same length as the number of rows in the data frame. The default is NULL, which means no specific ordering. Can't be used with cluster_rows = TRUE. This is applied before renaming rows_by to rows_name.
- columns_orderby
A expression (in character) to specify how to order columns. It will be evaluated in the context of the data frame used for columns (after grouping by columns split_by and columns_by). The expression should return a vector of the same length as the number of rows in the data frame. The default is NULL, which means no specific ordering. Can't be used with cluster_columns = TRUE. This is applied before renaming columns_by to columns_name.
- columns_name
A character string to rename the column created by
columns_by, which will be reflected in the name of the annotation or legend.- columns_split_name
A character string to rename the column created by
columns_split_by, which will be reflected in the name of the annotation or legend.- rows_name
A character string to rename the column created by
rows_by, which will be reflected in the name of the annotation or legend.- rows_split_name
A character string to rename the column created by
rows_split_by, which will be reflected in the name of the annotation or legend.- palette
A character string specifying the palette of the heatmap cells.
- palcolor
A character vector of colors to override the palette of the heatmap cells.
- palreverse
A logical value indicating whether to reverse the palette. Default is FALSE.
- pie_size_name
A character string specifying the name of the legend for the pie size.
- pie_size
A numeric value or a function specifying the size of the pie chart. If it is a function, the function should take
countas the argument and return the size.- pie_values
A function or character that can be converted to a function by
match.arg()to calculate the values for the pie chart. Default is "length". The function should take a vector of values as the argument and return a single value, for each group inpie_group_by.- pie_name
A character string to rename the column created by
pie_group_by, which will be reflected in the name of the annotation or legend.- pie_group_by
A character of column name in
datathat contains the group information for pie charts. This is used to create pie charts in the heatmap whencell_typeis"pie".- pie_group_by_sep
A character string to concat multiple columns in
pie_group_by.- pie_palette
A character string specifying the palette of the pie chart.
- pie_palcolor
A character vector of colors to override the palette of the pie chart.
- bars_sample
An integer specifying the number of samples to draw the bars.
- label
A function to calculate the labels for the heatmap cells. It can take either 1, 3, or 5 arguments. The first argument is the aggregated value for a single cell. If it takes 3 arguments, the second and third arguments are the row and column indices of that cell. If it takes 5 arguments, the second and third arguments are the row and column indices, and the fourth and fifth arguments are the row and column names. The function should return one of:
NA— no label is drawn for this cell.A character scalar — used as the label text;
label_sizeandlabel_colorare used for size and color.A named list with any of the following fields:
label: character scalar for the label text.size: numeric pt size (overrideslabel_size).color: character color string (overrideslabel_color).legend: character string used as the legend entry for this cell's color/label combination.order: integer controlling the position of this legend entry — smaller values appear first (top) in the legend. Entries without anorderare appended after all explicitly ordered entries. For the indices, if you have the same dimension of data (same order of rows and columns) as the heatmap, you need to useComplexHeatmap::pindex()to get the correct values.
- label_size
A numeric value specifying the default size (pt) of the labels when
cell_type = "label". Used as fallback when thelabelfunction does not return asizefield.- label_color
A character string specifying the default color of the labels when
cell_type = "label". Used as fallback when thelabelfunction does not return acolorfield. Default is"black".- label_name
A character string specifying the title of the label legend. Default is
"label". The legend is shown automatically when thelabelfunction returns a list with alegendfield for at least one cell — no extra configuration needed. Setlegend.position = "none"to suppress all legends.- mark
A function to calculate the marks drawn on top of heatmap cells when
cell_type = "mark". Same dispatch rules aslabel(1, 3, or 5 arguments). The function should return one of:NA— no mark is drawn for this cell.A character scalar — the mark type string;
mark_colorandmark_sizeare used for appearance.A named list with any of the following fields:
mark(or first unnamed element): character scalar, the mark type string.size: numeric stroke width (lwd), overridesmark_size.color: character color string, overridesmark_color.legend: character string used as the legend entry key.order: integer controlling legend entry position (smaller = higher). Supported mark types:
Primitives:
-(h-line),|(v-line),+(cross),/(l-diag),\(r-diag),x(both diags),o(circle with gap),()(circle touching edge),<>(diamond).With rectangular border:
[],[-],[|],[+],[/],[\],[x],[o],[()],[<>].With full circle:
(-),(|),(+),(/),(\),(x),(o),(<>).With diamond:
<->,<|>,<+>,</>,<\>,<x>,<o>.Octagon (standalone or wrapper):
{},{-},{|},{+},{/},{\\},{x},{o},{()},{<>}.Combinations: e.g.
[(|)],[(-)],[(+)],[(/)],[(\)],[(x)],[(o)],[(<>)].
[]: R:%5C [x]: R:x [o]: R:o [()]: R:() [<>]: R:%3C%3E [(|)]: R:(%7C) [(-)]: R:(-) [(+)]: R:(+) [(/)]: R:(/) [(\)]: R:(%5C%5C) [(x)]: R:(x) [(o)]: R:(o) [(<>)]: R:(%3C%3E)
- mark_color
A character string specifying the default color of the marks when
cell_type = "mark". Used as fallback when themarkfunction does not return acolorfield. Default is"black".- mark_size
A numeric value specifying the default stroke width (lwd) of the marks when
cell_type = "mark". Used as fallback when themarkfunction does not return asizefield. Default is1.- mark_name
A character string specifying the title of the mark legend. Default is
"mark". The legend is shown automatically when themarkfunction returns a list with alegendfield.- violin_fill
A character vector of colors to override the fill color of the violin plot. If NULL, the fill color will be the same as the annotion.
- boxplot_fill
A character vector of colors to override the fill color of the boxplot. If NULL, the fill color will be the same as the annotion.
- dot_size
A numeric value specifying the size of the dot or a function to calculate the size from the values in the cell or a function to calculate the size from the values in the cell.
- dot_size_name
A character string specifying the name of the legend for the dot size. If NULL, the dot size legend will not be shown.
- legend_items
A numeric vector with names to specifiy the items in the main legend. The names will be working as the labels of the legend items.
- legend_discrete
A logical value indicating whether the main legend is discrete.
- legend.position
A character string specifying the position of the legend. if
waiver(), for single groups, the legend will be "none", otherwise "right".- legend.direction
A character string specifying the direction of the legend.
- lower_quantile, upper_quantile, lower_cutoff, upper_cutoff
Vector of minimum and maximum cutoff values or quantile values for each feature. It's applied to aggregated values when aggregated values are used (e.g. plot_type tile, label, etc). It's applied to raw values when raw values are used (e.g. plot_type bars, etc).
- add_bg
A logical value indicating whether to add a background to the heatmap. Does not work with
cell_type = "bars"orcell_type = "tile".- bg_alpha
A numeric value between 0 and 1 specifying the transparency of the background.
- add_reticle
A logical value indicating whether to add a reticle to the heatmap.
- reticle_color
A character string specifying the color of the reticle.
- cluster_columns
A logical value indicating whether to cluster the columns. If TRUE and columns_split_by is provided, the clustering will only be applied to the columns within the same split.
- cluster_rows
A logical value indicating whether to cluster the rows. If TRUE and rows_split_by is provided, the clustering will only be applied to the rows within the same split.
- show_row_names
A logical value indicating whether to show the row names. If TRUE, the legend of the row group annotation will be hidden.
- show_column_names
A logical value indicating whether to show the column names. If TRUE, the legend of the column group annotation will be hidden.
- border
A logical value indicating whether to draw the border of the heatmap. If TRUE, the borders of the slices will be also drawn.
- title
The global (column) title of the heatmap
- column_title
A character string/vector of the column name(s) to use as the title of the column group annotation.
- row_title
A character string/vector of the column name(s) to use as the title of the row group annotation.
- na_col
A character string specifying the color for missing values. The default is "grey85".
- row_names_side
A character string specifying the side of the row names. The default is "right".
- column_names_side
A character string specifying the side of the column names. The default is "bottom".
- column_annotation
A character string/vector of the column name(s) to use as the column annotation. Or a list with the keys as the names of the annotation and the values as the column names.
- column_annotation_side
A character string or named list specifying which side each column annotation is placed on. Accepts
"top"(default) or"bottom".String: All column annotations go to that side (e.g.
"bottom").Named list: Per-annotation side control. Keys are annotation names or aliases (
.col,.col.split, etc.). Values are"top"or"bottom". Use the special.defaultkey to set the side for unspecified annotations (e.g.list(.default = "top", my_anno = "bottom")).Ordering within each side: Name annotations (
columns_by) are always placed closest to the heatmap body; split annotations (columns_split_by) are placed farthest away; user-defined annotations sit in between.
Note: Placing column annotations on
"bottom"conflicts withlegend.position = "bottom"— the legend may overlap the annotation names. Consider using a different legend position in that case.- column_annotation_palette
A character string specifying the palette of the column annotation. The default is "Paired". Could be a list with the keys as the names of the annotation and the values as the palettes.
- column_annotation_palcolor
A character vector of colors to override the palette of the column annotation. Could be a list with the keys as the names of the annotation and the values as the palcolors.
- column_annotation_type
A character string specifying the type of the column annotation. The default is "auto". Other options are "simple", "pie", "ring", "bar", "violin", "boxplot", "density", "label". Could be a list with the keys as the names of the annotation and the values as the types. If the type is "auto", the type will be determined by the type and number of the column data. For split or name annotations, use aliases (e.g.
.col.split,.col) to set the type."simple"— simple annotation viaanno_simple()(for split/name annotations)"label"— Text label annotation viaanno_simple()/anno_block()(for split/name annotations)
- column_annotation_params
A list of parameters passed to the annotation function. Could be a list with the keys as the names of the annotation and the values as the parameters. For the name/split annotations, use aliases:
.col/.cols/.column/.columnsforcolumns_by,.col.split/.cols.split/.column.split/.columns.splitforcolumns_split_by. Setting a key toFALSEdisables that annotation.$<key>$show_legendcontrols the legend for that annotation. For"label"type annotations, uselabels_gpto style the label text (e.g.labels_gp = grid::gpar(col = "white", fontsize = 12)). Seeanno_pie(),anno_ring(),anno_bar(),anno_violin(),anno_boxplot(),anno_density(),anno_simple(),anno_points(),anno_lines()andanno_block()for the parameters of each annotation function.- column_annotation_agg
A function or named list of functions to aggregate values for each column annotation. If a single function, it applies to all annotations. If a named list, keys are annotation names. Defaults vary by annotation type:
dplyr::firstfor"simple"/"points"/"lines",function(x) paste(unique(x), collapse = ", ")for"label", and no aggregation for others (e.g."pie","violin").- row_annotation
A character string/vector of the column name(s) to use as the row annotation. Or a list with the keys as the names of the annotation and the values as the column names.
- row_annotation_side
A character string or named list specifying which side each row annotation is placed on. Accepts
"left"(default) or"right".String: All row annotations go to that side (e.g.
"right").Named list: Per-annotation side control. Keys are annotation names or aliases (
.row,.rows.split, etc.). Values are"left"or"right". Use the special.defaultkey to set the side for unspecified annotations (e.g.list(.default = "left", .row = "right")).Ordering within each side: Name annotations (
rows_by) are always placed closest to the heatmap body; split annotations (rows_split_by) are placed farthest away; user-defined annotations sit in between.
- row_annotation_palette
A character string specifying the palette of the row annotation. The default is "Paired". Could be a list with the keys as the names of the annotation and the values as the palettes.
- row_annotation_palcolor
A character vector of colors to override the palette of the row annotation. Could be a list with the keys as the names of the annotation and the values as the palcolors.
- row_annotation_type
A character string specifying the type of the row annotation. The default is "auto". Other options are "simple", "pie", "ring", "bar", "violin", "boxplot", "density", "label". Could be a list with the keys as the names of the annotation and the values as the types. If the type is "auto", the type will be determined by the type and number of the row data. For split or name annotations, use aliases (e.g.
.rows.split,.row) to set the type."simple"— Simple annotation viaanno_simple(). Only valid for row/column name and split label annotation"label"— Text label annotation viaanno_simple()/anno_block()(for split/name annotations)
- row_annotation_params
A list of parameters passed to the annotation function. Could be a list with the keys as the names of the annotation and the values as the parameters. For the name/split annotations, use aliases:
.row/.rowsforrows_by,.rows.split/.row.splitforrows_split_by. Setting a key toFALSEdisables that annotation.$<key>$show_legendcontrols the legend. For"label"type row (name) annotations, uselabel_rotto control text rotation (default-90on the left side,90on the right side). For"label"type, uselabels_gpto style the label text. Same structure ascolumn_annotation_params.- row_annotation_agg
A function or named list of functions to aggregate values for each row annotation. Same behavior as
column_annotation_agg.- flip
A logical value indicating whether to flip the heatmap. The idea is that, you can simply set
flip = TRUEto flip the heatmap. You don't need to swap the arguments related to rows and columns, except those you specify via...that are passed toComplexHeatmap::Heatmap()directly.- alpha
A numeric value between 0 and 1 specifying the transparency of the heatmap cells.
- seed
The random seed to use. Default is 8525.
- padding
A numeric vector of length 4 specifying the padding of the heatmap in the order of top, right, bottom, left. Like padding in css. Note that it is different than the
paddingargument inComplexHeatmap::draw(), which is the padding in the order of bottom, left, top, right. It also support 1, 2, 3 values like css padding. When 1 element is provided, it will be used for all sides. When 2 elements are provided, the first one will be used for top and bottom, and the second one will be used for left and right. When 3 elements are provided, the first one will be used for top, the second one will be used for left and right, and the third one will be used for bottom. When 4 elements are provided, they will be used for top, right, bottom, and left respectively. If no unit is provided, the default unit will be "mm".- base_size
A positive numeric scalar used as a scaling factor for the overall heatmap size. Default is
1(no scaling). Values greater than 1 enlarge the heatmap; values less than 1 shrink it. Internally, all calculated cell dimensions are multiplied by this factor.- aspect.ratio
A positive numeric scalar giving the height-to-width ratio of a single heatmap cell. When
NULL(default), sensible per-cell_typedefaults are used:tile,label,dot: square cells (ratio = 1).bars: wider-than-tall cells (ratio = 0.5) so individual bars are legible.violin,boxplot,pie: square cells with a larger base size (0.5 in) so embedded sub-plots have enough room. Provide an explicit value to override these defaults (e.g.aspect.ratio = 2for portrait cells,aspect.ratio = 0.5for landscape cells). Note that forcell_type = "pie"the cells are always drawn square by ComplexHeatmap regardless of this setting; use it primarily to budget the figure size. Note that the aspect ratio is not guaranteed to be perfectly preserved; it will also be restricted by the size and height/width ratio of the entire plot itself.
- draw_opts
A named list of additional arguments passed to
ComplexHeatmap::draw(). Arguments already managed internally (annotation_legend_list,padding,show_annotation_legend,annotation_legend_side,column_title) take precedence over any values supplied here. See https://jokergoo.github.io/ComplexHeatmap/reference/draw-HeatmapList-method.html for available options.- layer_fun_callback
A function to add additional layers to the heatmap. The function should have the following arguments:
j,i,x,y,w,h,fill,srandsc. Please also refer to thelayer_funargument inComplexHeatmap::Heatmap.- cell_type
A character string specifying the type of the heatmap cells. The default is "tile" Other options are "bars", "label", "mark", "label+mark" (or equivalently "mark+label"), "dot", "violin", "boxplot" and "pie". Use "label+mark" to render both marks (drawn first, as background) and text labels (drawn on top) in each cell simultaneously, combining all
label_*andmark_*parameters. Note that for pie chart, the values under columns specified byrowswill not be used directly. Instead, the values will just be counted in differentpie_group_bygroups.NAvalues will not be counted.- cell_agg
A function to aggregate the values in the cell, for the cell type "tile" and "label". The default is
mean.- combine
Whether to combine the plots into one when facet is FALSE. Default is TRUE.
- nrow
A numeric value specifying the number of rows in the facet.
- ncol
A numeric value specifying the number of columns in the facet.
- byrow
A logical value indicating whether to fill the plots by row.
- axes
A string specifying how axes should be treated. Passed to
patchwork::wrap_plots(). Only relevant whensplit_byis used andcombineis TRUE. Options are:'keep' will retain all axes in individual plots.
'collect' will remove duplicated axes when placed in the same run of rows or columns of the layout.
'collect_x' and 'collect_y' will remove duplicated x-axes in the columns or duplicated y-axes in the rows respectively.
- axis_titles
A string specifying how axis titltes should be treated. Passed to
patchwork::wrap_plots(). Only relevant whensplit_byis used andcombineis TRUE. Options are:'keep' will retain all axis titles in individual plots.
'collect' will remove duplicated titles in one direction and merge titles in the opposite direction.
'collect_x' and 'collect_y' control this for x-axis titles and y-axis titles respectively.
- guides
A string specifying how guides should be treated in the layout. Passed to
patchwork::wrap_plots(). Only relevant whensplit_byis used andcombineis TRUE. Options are:'collect' will collect guides below to the given nesting level, removing duplicates.
'keep' will stop collection at this level and let guides be placed alongside their plot.
'auto' will allow guides to be collected if a upper level tries, but place them alongside the plot if not.
- design
Specification of the location of areas in the layout, passed to
patchwork::wrap_plots(). Only relevant whensplit_byis used andcombineis TRUE. When specified,nrow,ncol, andbyroware ignored. Seepatchwork::wrap_plots()for more details.- ...
Other arguments passed to
ComplexHeatmap::Heatmap()Whenrow_names_max_widthis passed, a unit is expected. But you can also pass a numeric values, with a default unit "inches", or a string like "5inches" to specify the number and unit directly. Unmatched arguments will be warned and ignored.
Value
A patchwork wrapped heatmap object if combine is TRUE;
otherwise a list of heatmap objects if combine is FALSE and split_by is specified.
Examples
# \donttest{
set.seed(8525)
matrix_data <- matrix(rnorm(60), nrow = 6, ncol = 10)
rownames(matrix_data) <- paste0("R", 1:6)
colnames(matrix_data) <- paste0("C", 1:10)
if (requireNamespace("cluster", quietly = TRUE)) {
Heatmap(matrix_data)
}
 if (requireNamespace("cluster", quietly = TRUE)) {
# use a different color palette
# change the main legend title
# show row names (legend will be hidden)
# show column names
# change the row name annotation name and side
# change the column name annotation name
Heatmap(matrix_data, palette = "viridis", values_by = "z-score",
show_row_names = TRUE, show_column_names = TRUE,
rows_name = "Features", row_names_side = "left",
columns_name = "Samples")
}
if (requireNamespace("cluster", quietly = TRUE)) {
# use a different color palette
# change the main legend title
# show row names (legend will be hidden)
# show column names
# change the row name annotation name and side
# change the column name annotation name
Heatmap(matrix_data, palette = "viridis", values_by = "z-score",
show_row_names = TRUE, show_column_names = TRUE,
rows_name = "Features", row_names_side = "left",
columns_name = "Samples")
}
 if (requireNamespace("cluster", quietly = TRUE)) {
# flip the heatmap
Heatmap(matrix_data, palette = "viridis", values_by = "z-score",
show_row_names = TRUE, show_column_names = TRUE,
rows_name = "Features", row_names_side = "left",
columns_name = "Samples", flip = TRUE)
}
if (requireNamespace("cluster", quietly = TRUE)) {
# flip the heatmap
Heatmap(matrix_data, palette = "viridis", values_by = "z-score",
show_row_names = TRUE, show_column_names = TRUE,
rows_name = "Features", row_names_side = "left",
columns_name = "Samples", flip = TRUE)
}
 if (requireNamespace("cluster", quietly = TRUE)) {
# add annotations to the heatmap
rows_data <- data.frame(
rows = paste0("R", 1:6),
group = sample(c("X", "Y", "Z"), 6, replace = TRUE)
)
Heatmap(matrix_data, rows_data = rows_data,
row_annotation = list(Group = "group"),
row_annotation_type = list(Group = "simple"),
row_annotation_palette = list(Group = "Spectral")
)
}
#> Warning: [Heatmap] Assuming 'row_annotation_agg["Group"] = dplyr::first' for the simple annotation
if (requireNamespace("cluster", quietly = TRUE)) {
# add annotations to the heatmap
rows_data <- data.frame(
rows = paste0("R", 1:6),
group = sample(c("X", "Y", "Z"), 6, replace = TRUE)
)
Heatmap(matrix_data, rows_data = rows_data,
row_annotation = list(Group = "group"),
row_annotation_type = list(Group = "simple"),
row_annotation_palette = list(Group = "Spectral")
)
}
#> Warning: [Heatmap] Assuming 'row_annotation_agg["Group"] = dplyr::first' for the simple annotation
 if (requireNamespace("cluster", quietly = TRUE)) {
Heatmap(matrix_data, rows_data = rows_data,
rows_split_by = "group"
)
}
if (requireNamespace("cluster", quietly = TRUE)) {
Heatmap(matrix_data, rows_data = rows_data,
rows_split_by = "group"
)
}
 if (requireNamespace("cluster", quietly = TRUE)) {
# use label annotation for split groups (shows group labels inside colored blocks)
Heatmap(matrix_data, rows_data = rows_data,
rows_split_by = "group",
row_annotation_params = list(.rows.split = list(
border = FALSE,
labels_gp = grid::gpar(col = "white", fontsize = 12),
labels_rot = 0
)),
row_annotation_type = list(.rows.split = "label")
)
}
if (requireNamespace("cluster", quietly = TRUE)) {
# use label annotation for split groups (shows group labels inside colored blocks)
Heatmap(matrix_data, rows_data = rows_data,
rows_split_by = "group",
row_annotation_params = list(.rows.split = list(
border = FALSE,
labels_gp = grid::gpar(col = "white", fontsize = 12),
labels_rot = 0
)),
row_annotation_type = list(.rows.split = "label")
)
}
 if (requireNamespace("cluster", quietly = TRUE)) {
# label annotation for column splits
columns_data <- data.frame(
columns = paste0("C", 1:10),
batch = rep(c("A", "B"), each = 5)
)
Heatmap(matrix_data, columns_data = columns_data,
columns_split_by = "batch",
column_annotation_type = list(.col.split = "label")
)
}
if (requireNamespace("cluster", quietly = TRUE)) {
# label annotation for column splits
columns_data <- data.frame(
columns = paste0("C", 1:10),
batch = rep(c("A", "B"), each = 5)
)
Heatmap(matrix_data, columns_data = columns_data,
columns_split_by = "batch",
column_annotation_type = list(.col.split = "label")
)
}
 rownames(matrix_data)[1] <- "R12345"
if (requireNamespace("cluster", quietly = TRUE)) {
# label annotation for name annotations: show row/column names as colored labels
Heatmap(matrix_data, rows_data = rows_data,
row_annotation_type = list(.row = "label"),
column_annotation_type = list(.col = "label"),
column_annotation_params = list(.col = list(labels_rot = 90)),
row_annotation_palette = list(.row = "Set2"),
row_annotation_side = list(.row = "right"),
row_annotation_params = list(.row = list(labels_rot = 150))
)
}
rownames(matrix_data)[1] <- "R12345"
if (requireNamespace("cluster", quietly = TRUE)) {
# label annotation for name annotations: show row/column names as colored labels
Heatmap(matrix_data, rows_data = rows_data,
row_annotation_type = list(.row = "label"),
column_annotation_type = list(.col = "label"),
column_annotation_params = list(.col = list(labels_rot = 90)),
row_annotation_palette = list(.row = "Set2"),
row_annotation_side = list(.row = "right"),
row_annotation_params = list(.row = list(labels_rot = 150))
)
}
 if (requireNamespace("cluster", quietly = TRUE)) {
# add labels to the heatmap
Heatmap(matrix_data, rows_data = rows_data,
rows_split_by = "group", cell_type = "label",
base_size = 0.8,
label = function(x) ifelse(
x > 0, scales::number(x, accuracy = 0.01), NA
)
)
}
if (requireNamespace("cluster", quietly = TRUE)) {
# add labels to the heatmap
Heatmap(matrix_data, rows_data = rows_data,
rows_split_by = "group", cell_type = "label",
base_size = 0.8,
label = function(x) ifelse(
x > 0, scales::number(x, accuracy = 0.01), NA
)
)
}
 if (requireNamespace("cluster", quietly = TRUE)) {
# add labels based on an external data
pvalues <- matrix(runif(60, 0, 0.5), nrow = 6, ncol = 10)
Heatmap(matrix_data, rows_data = rows_data,
rows_split_by = "group", cell_type = "label",
base_size = 0.8,
label = function(x, i, j) {
pv <- ComplexHeatmap::pindex(pvalues, i, j)
ifelse(pv < 0.01, "***",
ifelse(pv < 0.05, "**",
ifelse(pv < 0.1, "*", NA)))
}
)
}
if (requireNamespace("cluster", quietly = TRUE)) {
# add labels based on an external data
pvalues <- matrix(runif(60, 0, 0.5), nrow = 6, ncol = 10)
Heatmap(matrix_data, rows_data = rows_data,
rows_split_by = "group", cell_type = "label",
base_size = 0.8,
label = function(x, i, j) {
pv <- ComplexHeatmap::pindex(pvalues, i, j)
ifelse(pv < 0.01, "***",
ifelse(pv < 0.05, "**",
ifelse(pv < 0.1, "*", NA)))
}
)
}
 if (requireNamespace("cluster", quietly = TRUE)) {
# Set label color, size, legend and order
pvalues <- matrix(runif(60, 0, 0.5), nrow = 6, ncol = 10)
Heatmap(matrix_data, rows_data = rows_data,
rows_split_by = "group", cell_type = "label",
base_size = 0.6,
label_name = "Significance",
label = function(x, i, j) {
pv <- ComplexHeatmap::pindex(pvalues, i, j)
if (pv < 0.01)
list("***", color = "red", size = 12, legend = "p < 0.01", order = 1)
else if (pv < 0.05)
list("**", color = "orange", size = 10, legend = "p < 0.05", order = 3)
else if (pv < 0.1)
list("*", color = "yellow", size = 8, legend = "p < 0.1", order = 2)
else NA
}
)
}
if (requireNamespace("cluster", quietly = TRUE)) {
# Set label color, size, legend and order
pvalues <- matrix(runif(60, 0, 0.5), nrow = 6, ncol = 10)
Heatmap(matrix_data, rows_data = rows_data,
rows_split_by = "group", cell_type = "label",
base_size = 0.6,
label_name = "Significance",
label = function(x, i, j) {
pv <- ComplexHeatmap::pindex(pvalues, i, j)
if (pv < 0.01)
list("***", color = "red", size = 12, legend = "p < 0.01", order = 1)
else if (pv < 0.05)
list("**", color = "orange", size = 10, legend = "p < 0.05", order = 3)
else if (pv < 0.1)
list("*", color = "yellow", size = 8, legend = "p < 0.1", order = 2)
else NA
}
)
}
 if (requireNamespace("cluster", quietly = TRUE)) {
# add marks
Heatmap(matrix_data, rows_data = rows_data,
rows_split_by = "group", cell_type = "mark",
mark = function(x, i, j) {
pv <- ComplexHeatmap::pindex(pvalues, i, j)
if(pv < 0.01) list("[x]", legend = "p < 0.01")
else if (pv < 0.02) list("[o]", legend = "p < 0.02")
else if (pv < 0.03) list("[-]", legend = "p < 0.03")
else if (pv < 0.05) list("[()]", legend = "p < 0.05")
else if (pv < 0.06) list("+", legend = "p < 0.06")
else if (pv < 0.07) list("x", legend = "p < 0.07")
else if (pv < 0.08) list("[/]", legend = "p < 0.08")
else if (pv < 0.09) list("[\\]", legend = "p < 0.09")
else NA
}
)
}
if (requireNamespace("cluster", quietly = TRUE)) {
# add marks
Heatmap(matrix_data, rows_data = rows_data,
rows_split_by = "group", cell_type = "mark",
mark = function(x, i, j) {
pv <- ComplexHeatmap::pindex(pvalues, i, j)
if(pv < 0.01) list("[x]", legend = "p < 0.01")
else if (pv < 0.02) list("[o]", legend = "p < 0.02")
else if (pv < 0.03) list("[-]", legend = "p < 0.03")
else if (pv < 0.05) list("[()]", legend = "p < 0.05")
else if (pv < 0.06) list("+", legend = "p < 0.06")
else if (pv < 0.07) list("x", legend = "p < 0.07")
else if (pv < 0.08) list("[/]", legend = "p < 0.08")
else if (pv < 0.09) list("[\\]", legend = "p < 0.09")
else NA
}
)
}
 if (requireNamespace("cluster", quietly = TRUE)) {
# add labels and marks
Heatmap(matrix_data, rows_data = rows_data,
rows_split_by = "group", cell_type = "mark+label",
label = scales::label_number(accuracy = 0.01),
mark = function(x, i, j) {
pv <- ComplexHeatmap::pindex(pvalues, i, j)
if(pv < 0.01) list("{}", legend = "p < 0.01")
else if(pv < 0.05) list("[]", legend = "p < 0.05")
else NA
},
mark_size = 1.5, mark_color = "red"
)
}
if (requireNamespace("cluster", quietly = TRUE)) {
# add labels and marks
Heatmap(matrix_data, rows_data = rows_data,
rows_split_by = "group", cell_type = "mark+label",
label = scales::label_number(accuracy = 0.01),
mark = function(x, i, j) {
pv <- ComplexHeatmap::pindex(pvalues, i, j)
if(pv < 0.01) list("{}", legend = "p < 0.01")
else if(pv < 0.05) list("[]", legend = "p < 0.05")
else NA
},
mark_size = 1.5, mark_color = "red"
)
}
 if (requireNamespace("cluster", quietly = TRUE)) {
# quickly simulate a GO board
go <- matrix(sample(c(0, 1, NA), 81, replace = TRUE), ncol = 9)
Heatmap(
go,
# Do not cluster rows and columns and hide the name annotations
# Use .row/.col aliases (or the actual rows_name/columns_name) in annotation_params
cluster_rows = FALSE, cluster_columns = FALSE,
row_annotation_params = list(.row = FALSE),
column_annotation_params = list(.col = FALSE),
show_row_names = FALSE, show_column_names = FALSE,
# Set the legend items
values_by = "Players", legend_discrete = TRUE,
legend_items = c("Player 1" = 0, "Player 2" = 1),
# Set the pawns
cell_type = "dot", dot_size = function(x) ifelse(is.na(x), 0, 10),
dot_size_name = NULL, # hide the dot size legend
palcolor = c("white", "black"),
# Set the board
add_reticle = TRUE,
# Set the size of the board
width = ggplot2::unit(105, "mm"), height = ggplot2::unit(105, "mm"))
}
if (requireNamespace("cluster", quietly = TRUE)) {
# quickly simulate a GO board
go <- matrix(sample(c(0, 1, NA), 81, replace = TRUE), ncol = 9)
Heatmap(
go,
# Do not cluster rows and columns and hide the name annotations
# Use .row/.col aliases (or the actual rows_name/columns_name) in annotation_params
cluster_rows = FALSE, cluster_columns = FALSE,
row_annotation_params = list(.row = FALSE),
column_annotation_params = list(.col = FALSE),
show_row_names = FALSE, show_column_names = FALSE,
# Set the legend items
values_by = "Players", legend_discrete = TRUE,
legend_items = c("Player 1" = 0, "Player 2" = 1),
# Set the pawns
cell_type = "dot", dot_size = function(x) ifelse(is.na(x), 0, 10),
dot_size_name = NULL, # hide the dot size legend
palcolor = c("white", "black"),
# Set the board
add_reticle = TRUE,
# Set the size of the board
width = ggplot2::unit(105, "mm"), height = ggplot2::unit(105, "mm"))
}
 if (requireNamespace("cluster", quietly = TRUE)) {
# Make the row/column name annotation thicker using the .row/.col aliases
Heatmap(matrix_data,
column_annotation_params = list(.col = list(height = 5)),
row_annotation_params = list(.row = list(width = 5)))
}
if (requireNamespace("cluster", quietly = TRUE)) {
# Make the row/column name annotation thicker using the .row/.col aliases
Heatmap(matrix_data,
column_annotation_params = list(.col = list(height = 5)),
row_annotation_params = list(.row = list(width = 5)))
}
 if (requireNamespace("cluster", quietly = TRUE)) {
# Per-annotation side control: row name annotation on the right,
# all other row annotations on the left (.default)
rows_data2 <- data.frame(
rows = paste0("R", 1:6),
group = sample(c("X", "Y"), 6, replace = TRUE),
score = runif(6)
)
Heatmap(matrix_data, rows_data = rows_data2,
rows_split_by = "group",
row_annotation = list(Score = "score"),
row_annotation_side = list(.default = "left", .row = "right"),
show_row_names = TRUE
)
}
if (requireNamespace("cluster", quietly = TRUE)) {
# Per-annotation side control: row name annotation on the right,
# all other row annotations on the left (.default)
rows_data2 <- data.frame(
rows = paste0("R", 1:6),
group = sample(c("X", "Y"), 6, replace = TRUE),
score = runif(6)
)
Heatmap(matrix_data, rows_data = rows_data2,
rows_split_by = "group",
row_annotation = list(Score = "score"),
row_annotation_side = list(.default = "left", .row = "right"),
show_row_names = TRUE
)
}
 if (requireNamespace("cluster", quietly = TRUE)) {
# Move all row annotations to the right side
Heatmap(matrix_data, rows_data = rows_data2,
rows_split_by = "group",
row_annotation = list(Score = "score"),
row_annotation_side = "right",
show_row_names = TRUE
)
}
if (requireNamespace("cluster", quietly = TRUE)) {
# Move all row annotations to the right side
Heatmap(matrix_data, rows_data = rows_data2,
rows_split_by = "group",
row_annotation = list(Score = "score"),
row_annotation_side = "right",
show_row_names = TRUE
)
}
 if (requireNamespace("cluster", quietly = TRUE)) {
# Split and name annotations on opposite sides:
# split annotation on the default left, name annotation on the right
Heatmap(matrix_data, rows_data = rows_data2,
rows_split_by = "group",
row_annotation_side = list(.default = "left", .row = "right"),
show_row_names = TRUE
)
}
if (requireNamespace("cluster", quietly = TRUE)) {
# Split and name annotations on opposite sides:
# split annotation on the default left, name annotation on the right
Heatmap(matrix_data, rows_data = rows_data2,
rows_split_by = "group",
row_annotation_side = list(.default = "left", .row = "right"),
show_row_names = TRUE
)
}
 if (requireNamespace("cluster", quietly = TRUE)) {
# Row name label annotation on the right side (text rotated 90° clockwise)
Heatmap(matrix_data, rows_data = rows_data2,
row_annotation_type = list(.row = "label"),
row_annotation_palette = list(.row = "Set2"),
row_annotation_side = list(.row = "right"),
show_row_names = TRUE
)
}
if (requireNamespace("cluster", quietly = TRUE)) {
# Row name label annotation on the right side (text rotated 90° clockwise)
Heatmap(matrix_data, rows_data = rows_data2,
row_annotation_type = list(.row = "label"),
row_annotation_palette = list(.row = "Set2"),
row_annotation_side = list(.row = "right"),
show_row_names = TRUE
)
}
 # Use long form data
N <- 500
data <- data.frame(
value = rnorm(N),
c = sample(letters[1:8], N, replace = TRUE),
r = sample(LETTERS[1:5], N, replace = TRUE),
p = sample(c("x", "y"), N, replace = TRUE),
q = sample(c("X", "Y", "Z"), N, replace = TRUE),
a = as.character(sample(1:5, N, replace = TRUE)),
p1 = runif(N),
p2 = runif(N)
)
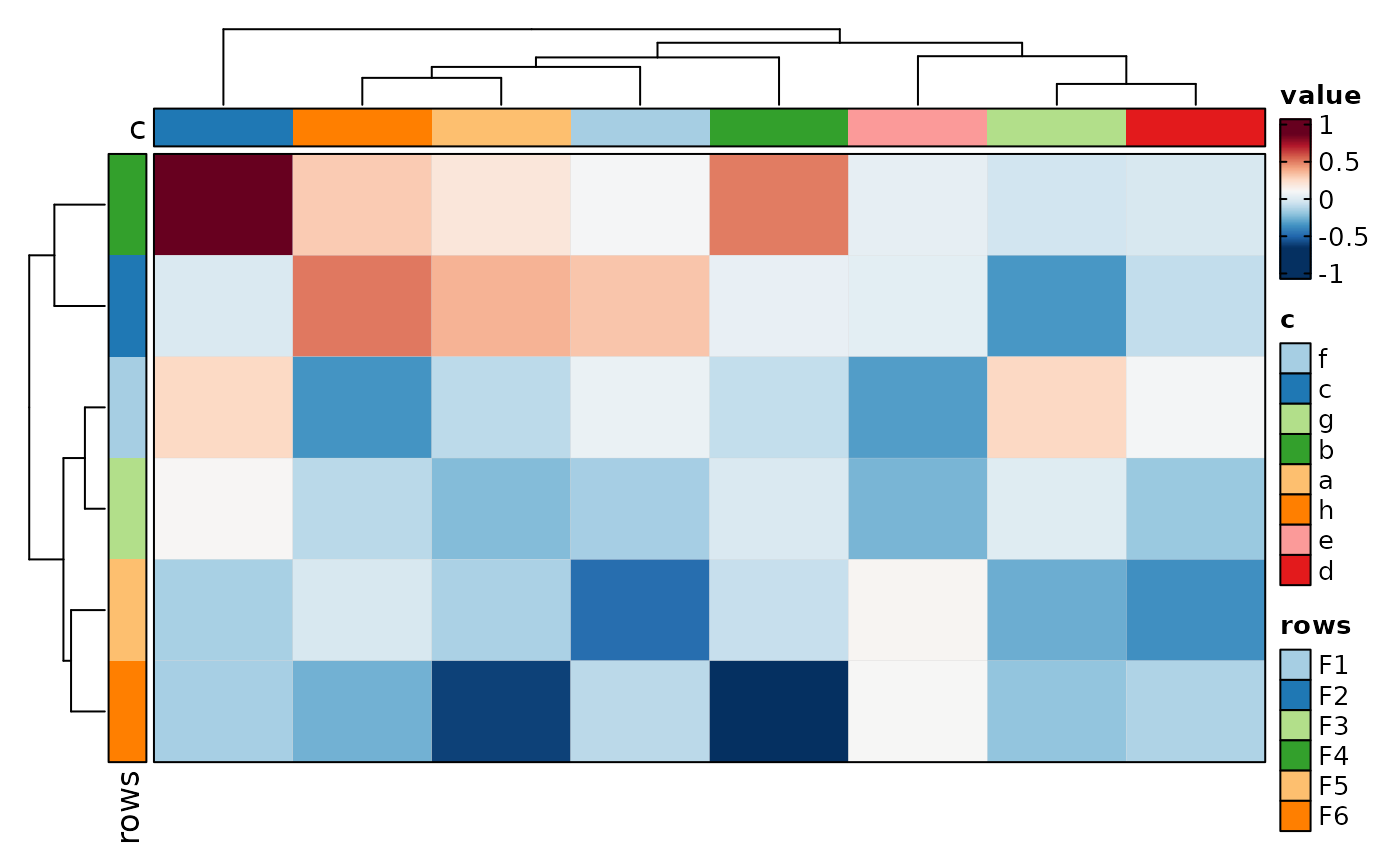
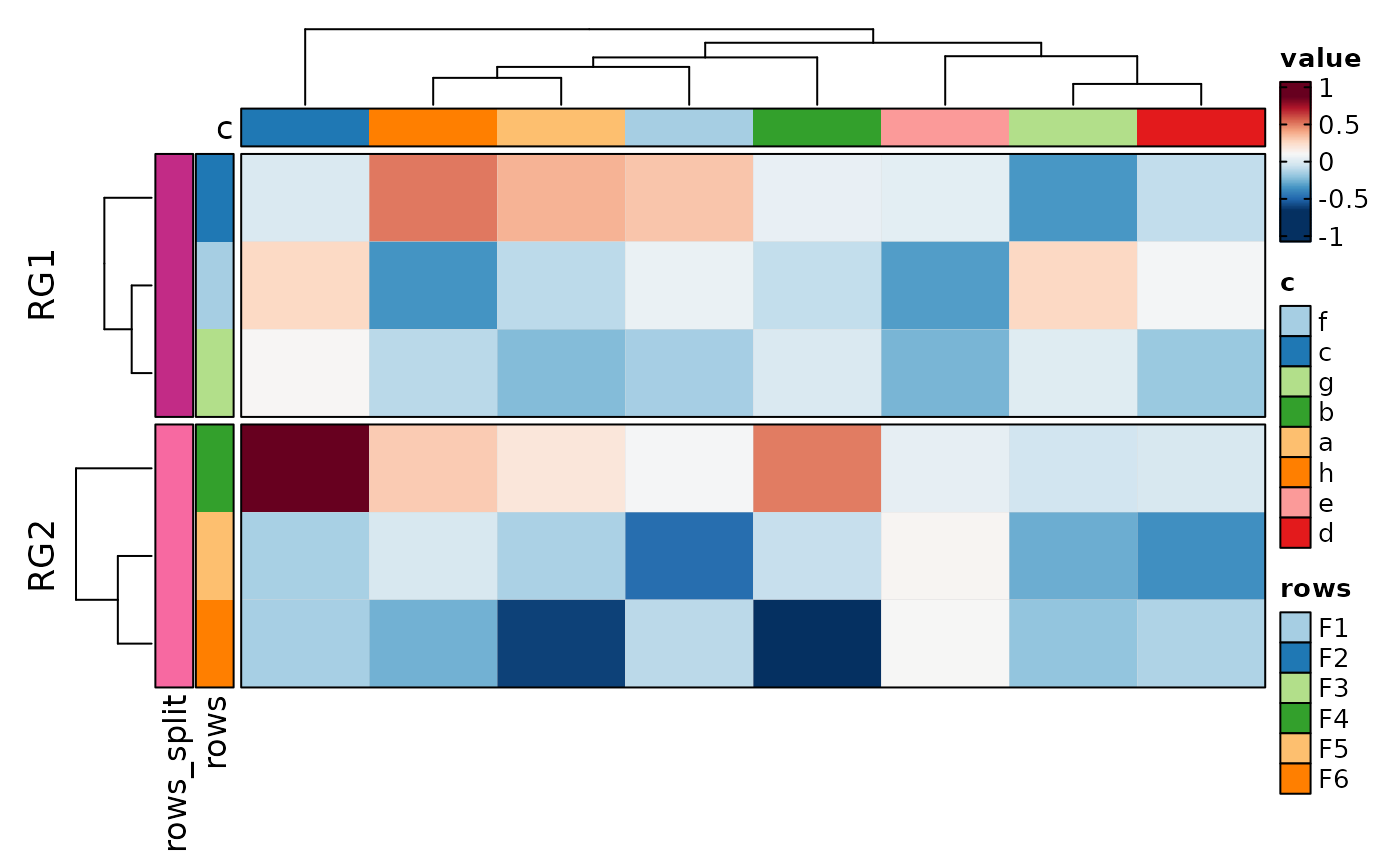
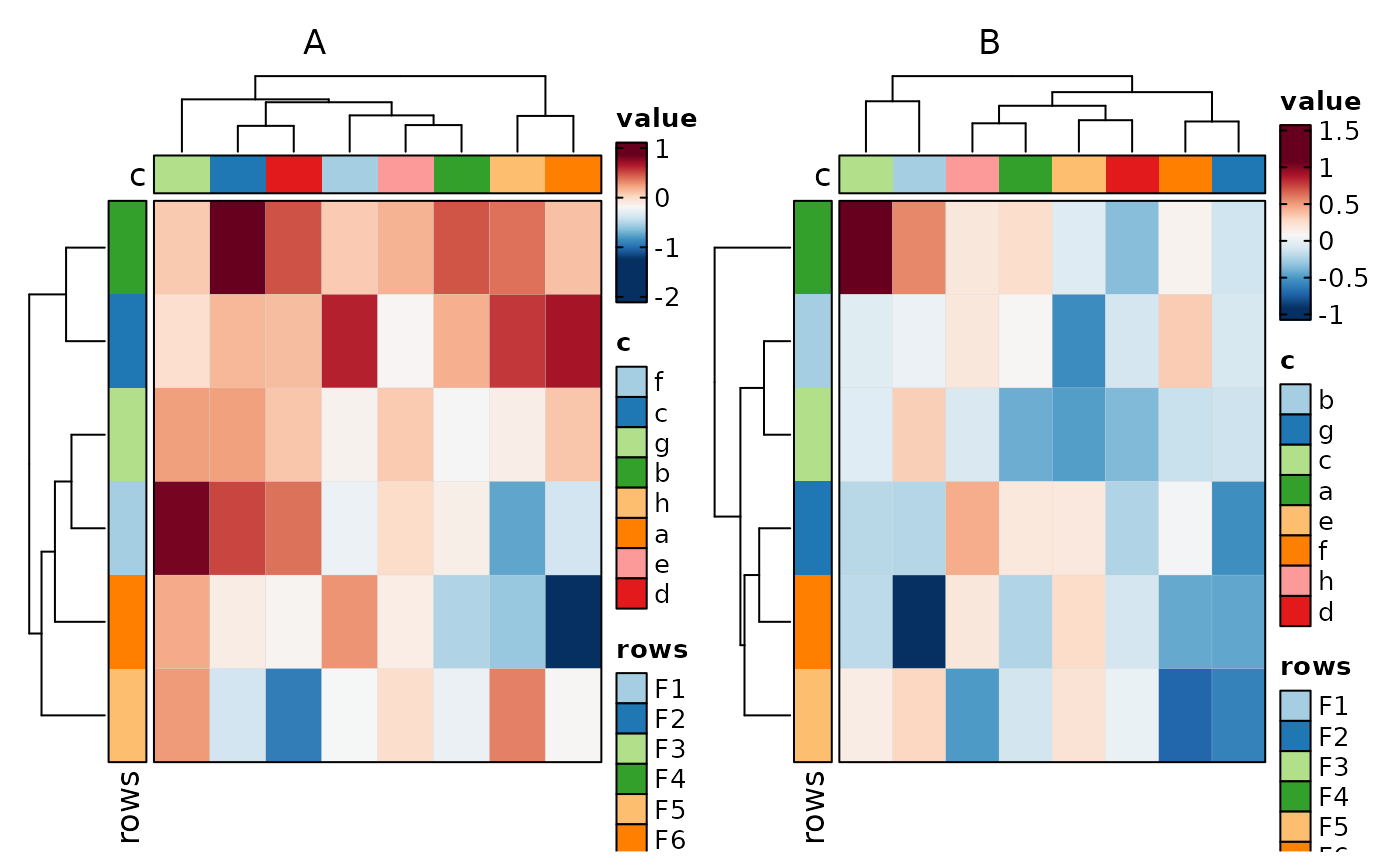
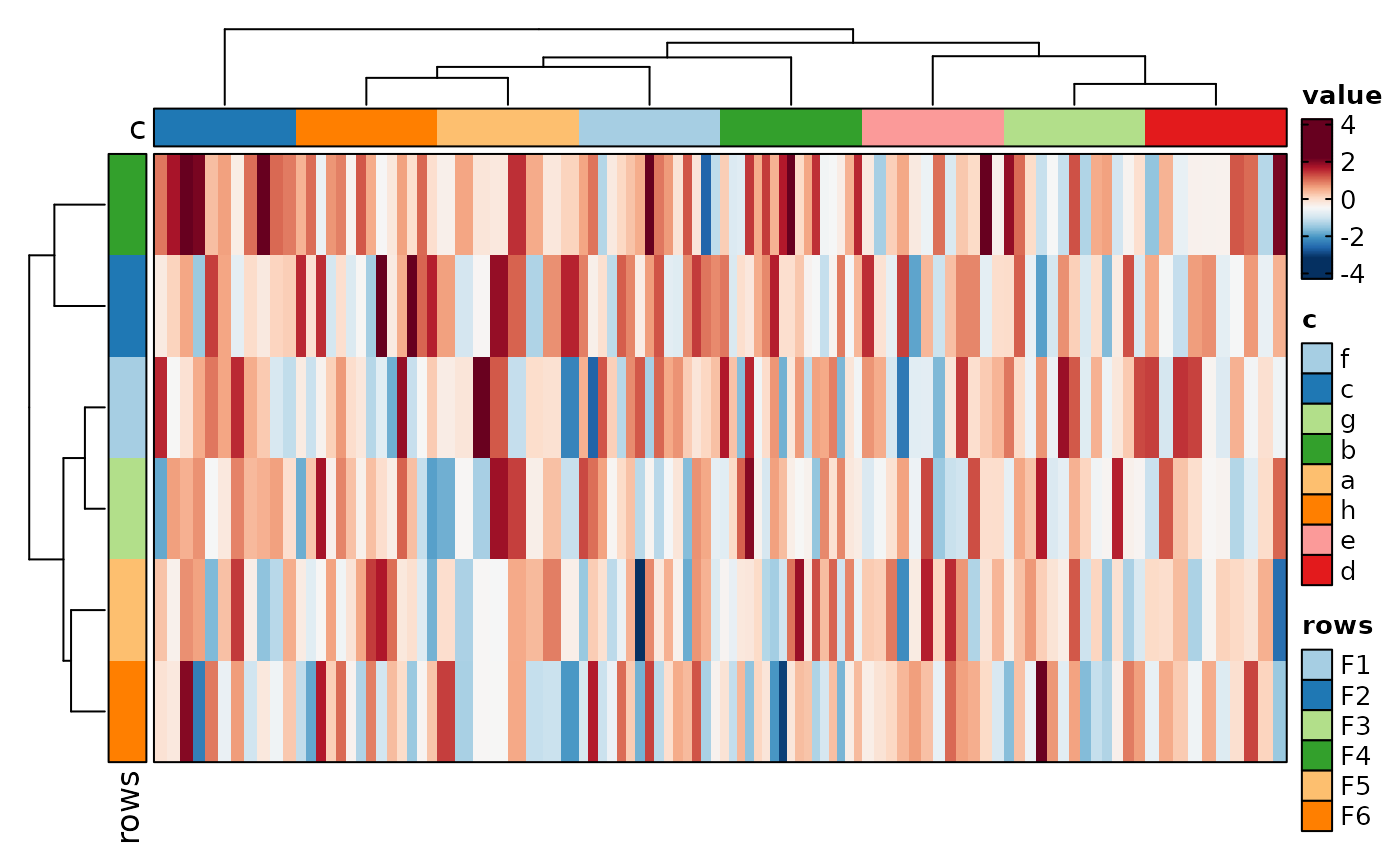
if (requireNamespace("cluster", quietly = TRUE)) {
Heatmap(data, rows_by = "r", columns_by = "c", values_by = "value",
rows_split_by = "p", columns_split_by = "q", show_column_names = TRUE)
}
# Use long form data
N <- 500
data <- data.frame(
value = rnorm(N),
c = sample(letters[1:8], N, replace = TRUE),
r = sample(LETTERS[1:5], N, replace = TRUE),
p = sample(c("x", "y"), N, replace = TRUE),
q = sample(c("X", "Y", "Z"), N, replace = TRUE),
a = as.character(sample(1:5, N, replace = TRUE)),
p1 = runif(N),
p2 = runif(N)
)
if (requireNamespace("cluster", quietly = TRUE)) {
Heatmap(data, rows_by = "r", columns_by = "c", values_by = "value",
rows_split_by = "p", columns_split_by = "q", show_column_names = TRUE)
}
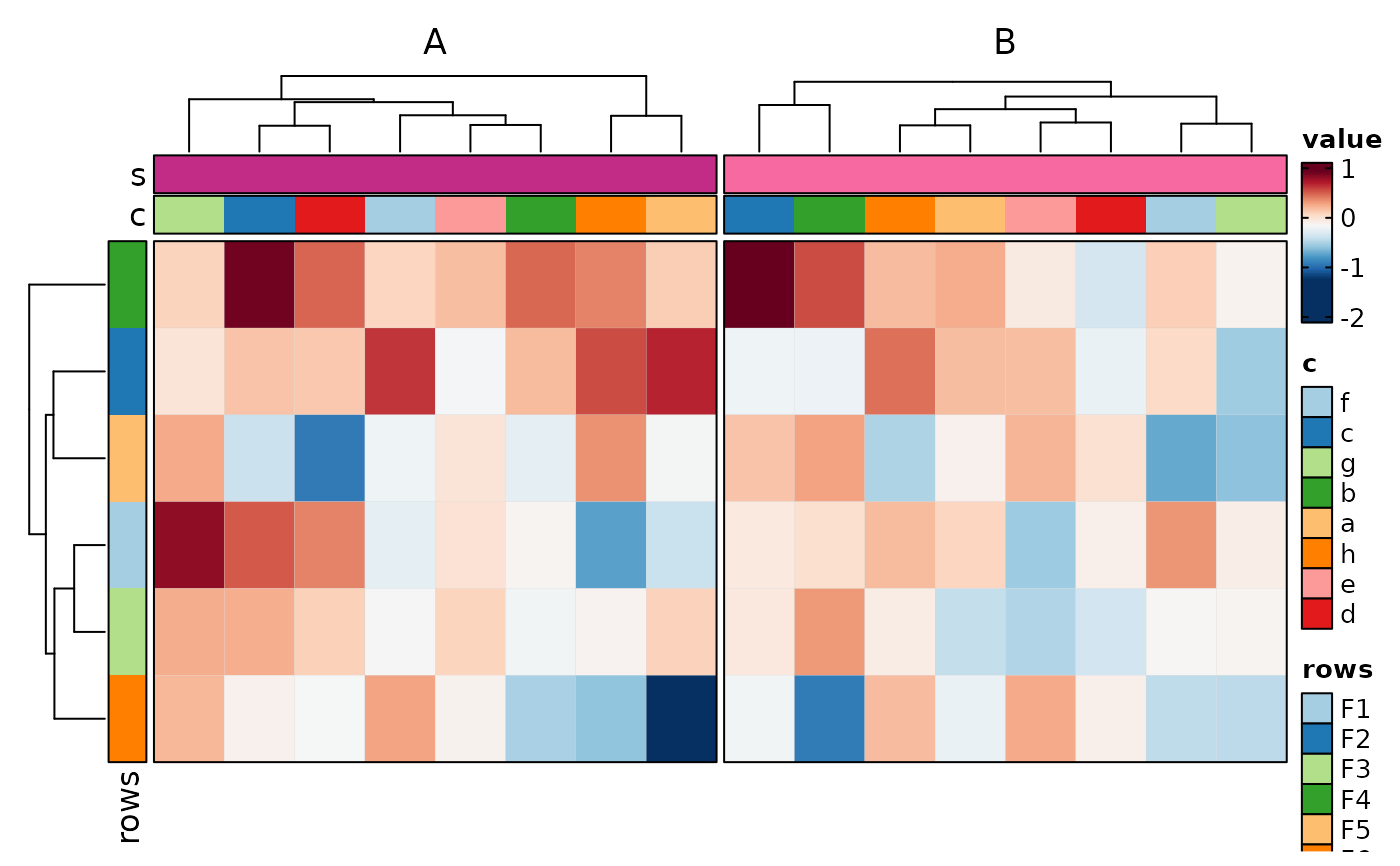
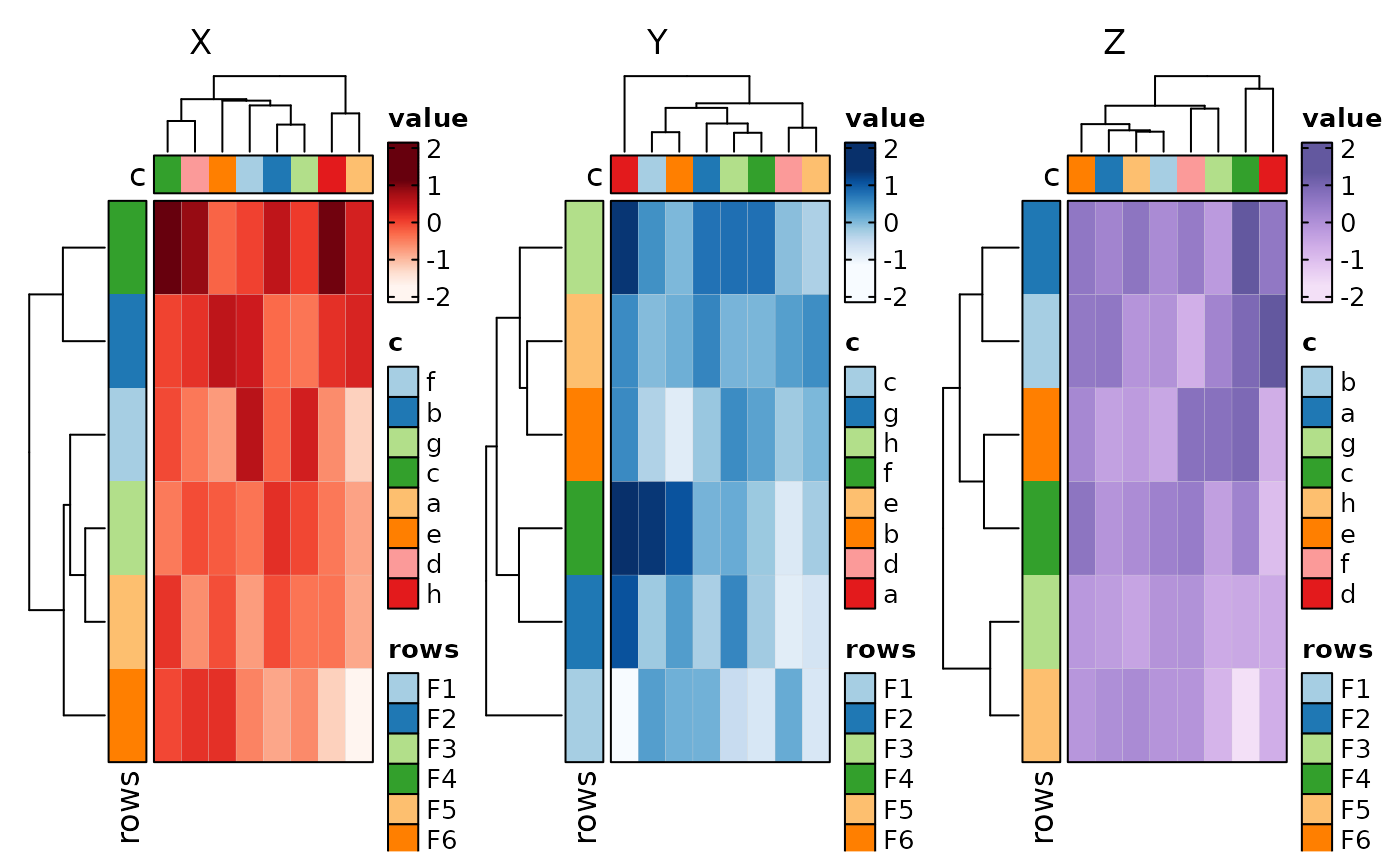
 if (requireNamespace("cluster", quietly = TRUE)) {
# split into multiple heatmaps
Heatmap(data,
values_by = "value", columns_by = "c", rows_by = "r", split_by = "p",
upper_cutoff = 2, lower_cutoff = -2, legend.position = c("none", "right"),
design = "AAAAAA#BBBBBBB"
)
}
if (requireNamespace("cluster", quietly = TRUE)) {
# split into multiple heatmaps
Heatmap(data,
values_by = "value", columns_by = "c", rows_by = "r", split_by = "p",
upper_cutoff = 2, lower_cutoff = -2, legend.position = c("none", "right"),
design = "AAAAAA#BBBBBBB"
)
}
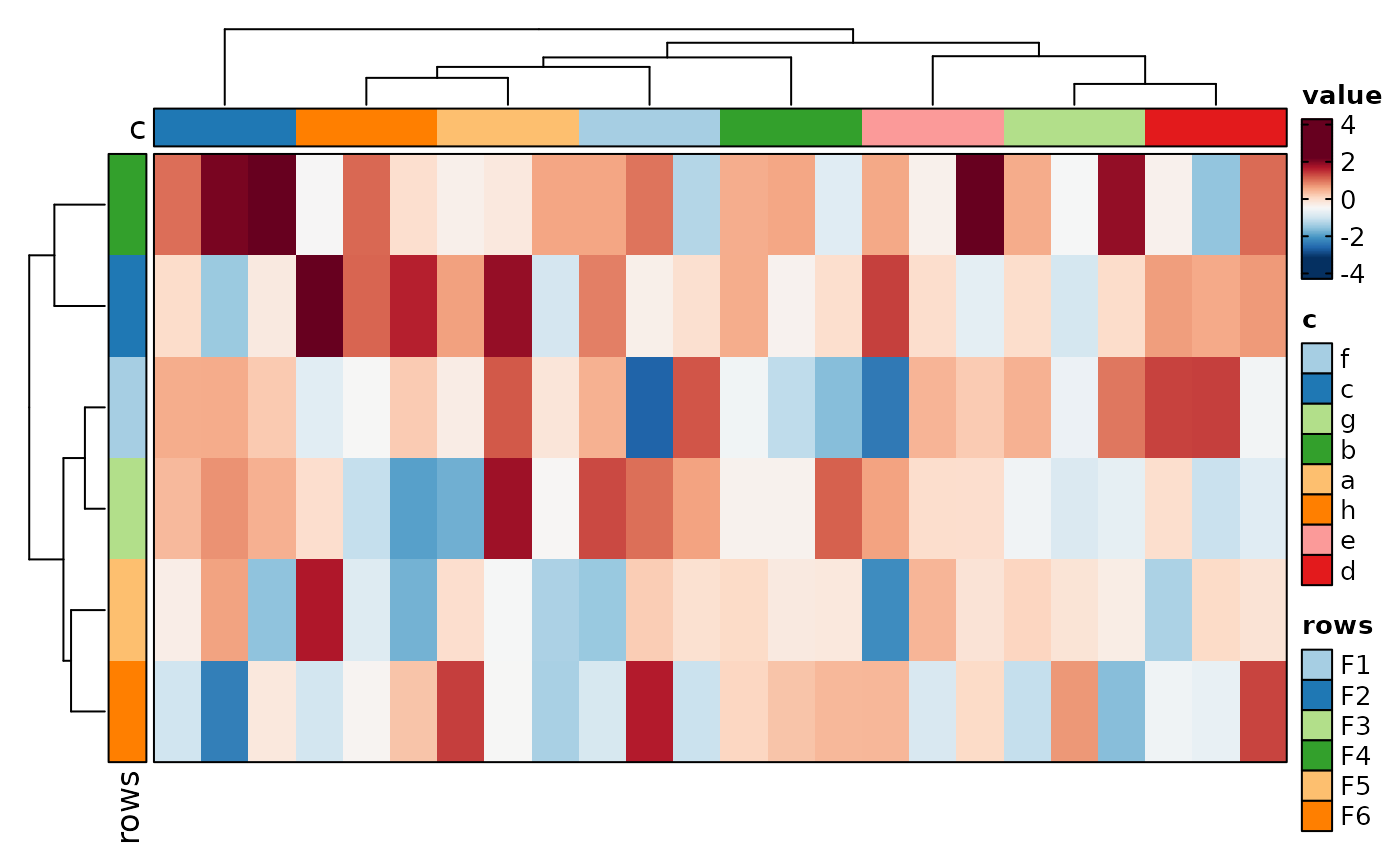
 if (requireNamespace("cluster", quietly = TRUE)) {
# cell_type = "bars" (default is "tile")
Heatmap(data, values_by = "value", rows_by = "r", columns_by = "c",
cell_type = "bars")
}
if (requireNamespace("cluster", quietly = TRUE)) {
# cell_type = "bars" (default is "tile")
Heatmap(data, values_by = "value", rows_by = "r", columns_by = "c",
cell_type = "bars")
}
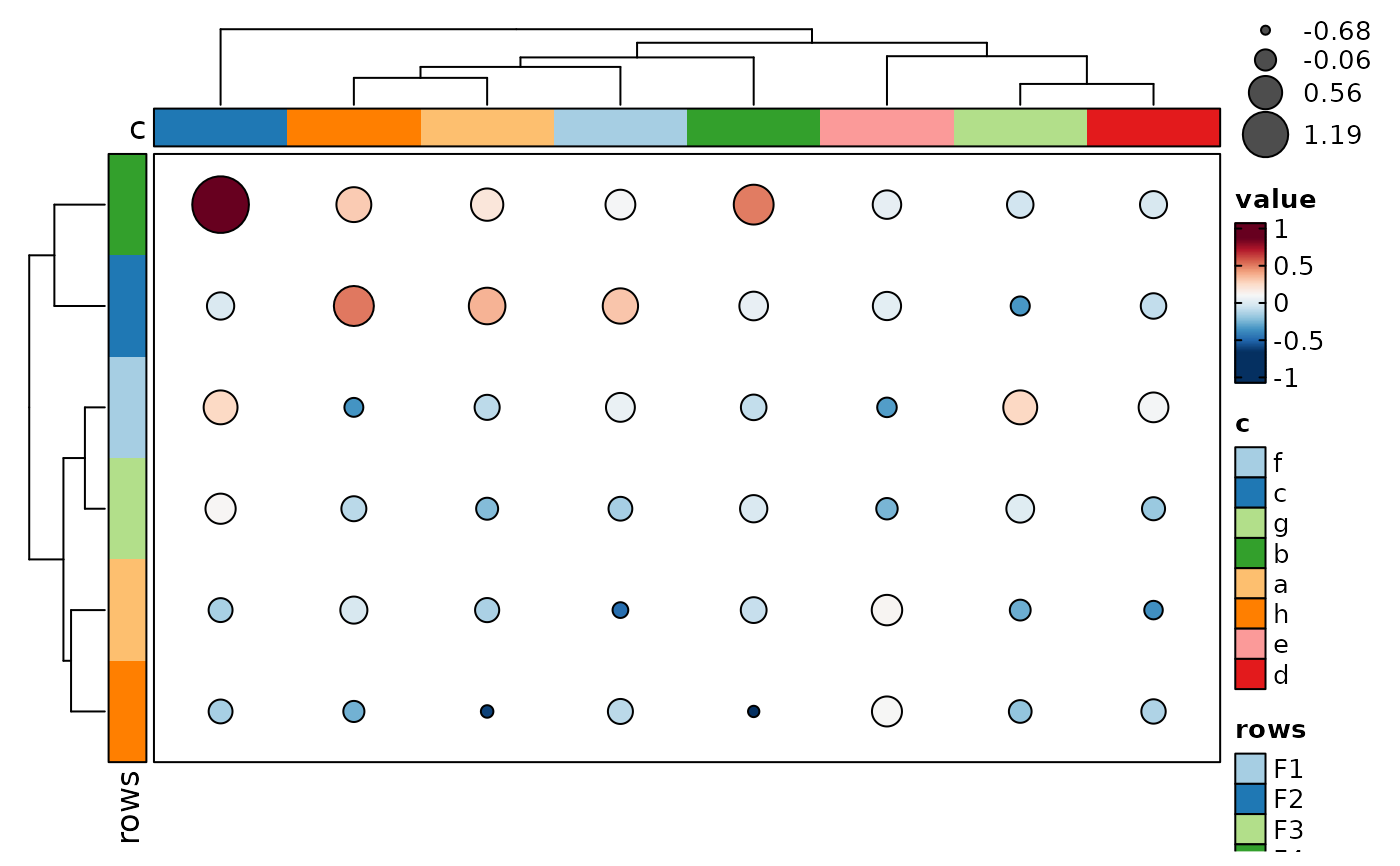
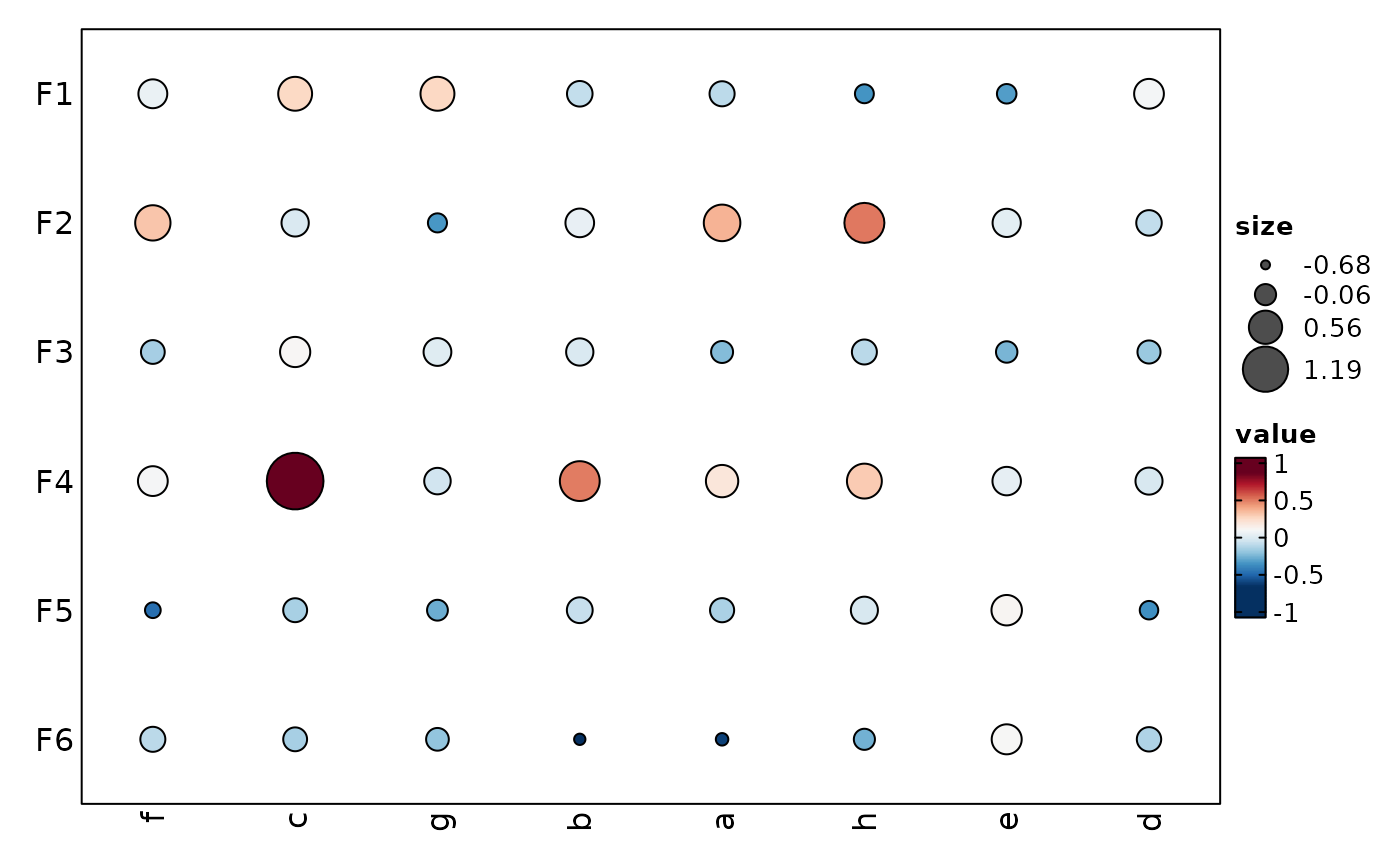
 if (requireNamespace("cluster", quietly = TRUE)) {
p <- Heatmap(data, values_by = "value", rows_by = "r", columns_by = "c",
cell_type = "dot", dot_size = length, dot_size_name = "data points",
add_bg = TRUE, add_reticle = TRUE)
p
}
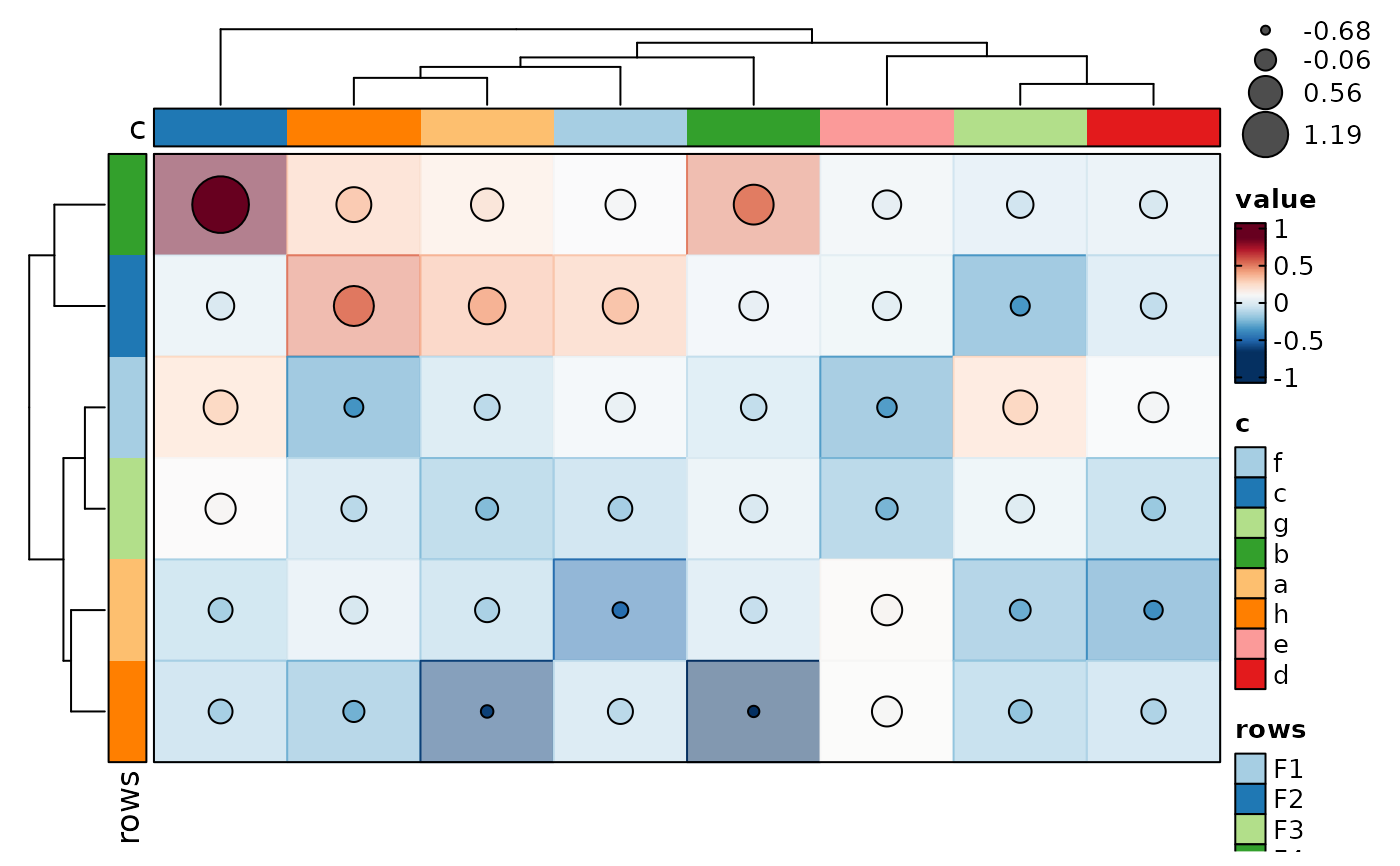
if (requireNamespace("cluster", quietly = TRUE)) {
p <- Heatmap(data, values_by = "value", rows_by = "r", columns_by = "c",
cell_type = "dot", dot_size = length, dot_size_name = "data points",
add_bg = TRUE, add_reticle = TRUE)
p
}
 if (requireNamespace("cluster", quietly = TRUE)) {
dot_size_data <- as.matrix(p$data)
# Make it big so we can see if we get the right indexing
# for dot_size function
dot_size_data["A", "a"] <- max(dot_size_data) * 2
Heatmap(data, values_by = "value", rows_by = "r", columns_by = "c",
cell_type = "dot", dot_size_name = "data points",
dot_size = function(x, i, j) ComplexHeatmap::pindex(dot_size_data, i, j),
show_row_names = TRUE, show_column_names = TRUE,
add_bg = TRUE, add_reticle = TRUE)
}
if (requireNamespace("cluster", quietly = TRUE)) {
dot_size_data <- as.matrix(p$data)
# Make it big so we can see if we get the right indexing
# for dot_size function
dot_size_data["A", "a"] <- max(dot_size_data) * 2
Heatmap(data, values_by = "value", rows_by = "r", columns_by = "c",
cell_type = "dot", dot_size_name = "data points",
dot_size = function(x, i, j) ComplexHeatmap::pindex(dot_size_data, i, j),
show_row_names = TRUE, show_column_names = TRUE,
add_bg = TRUE, add_reticle = TRUE)
}
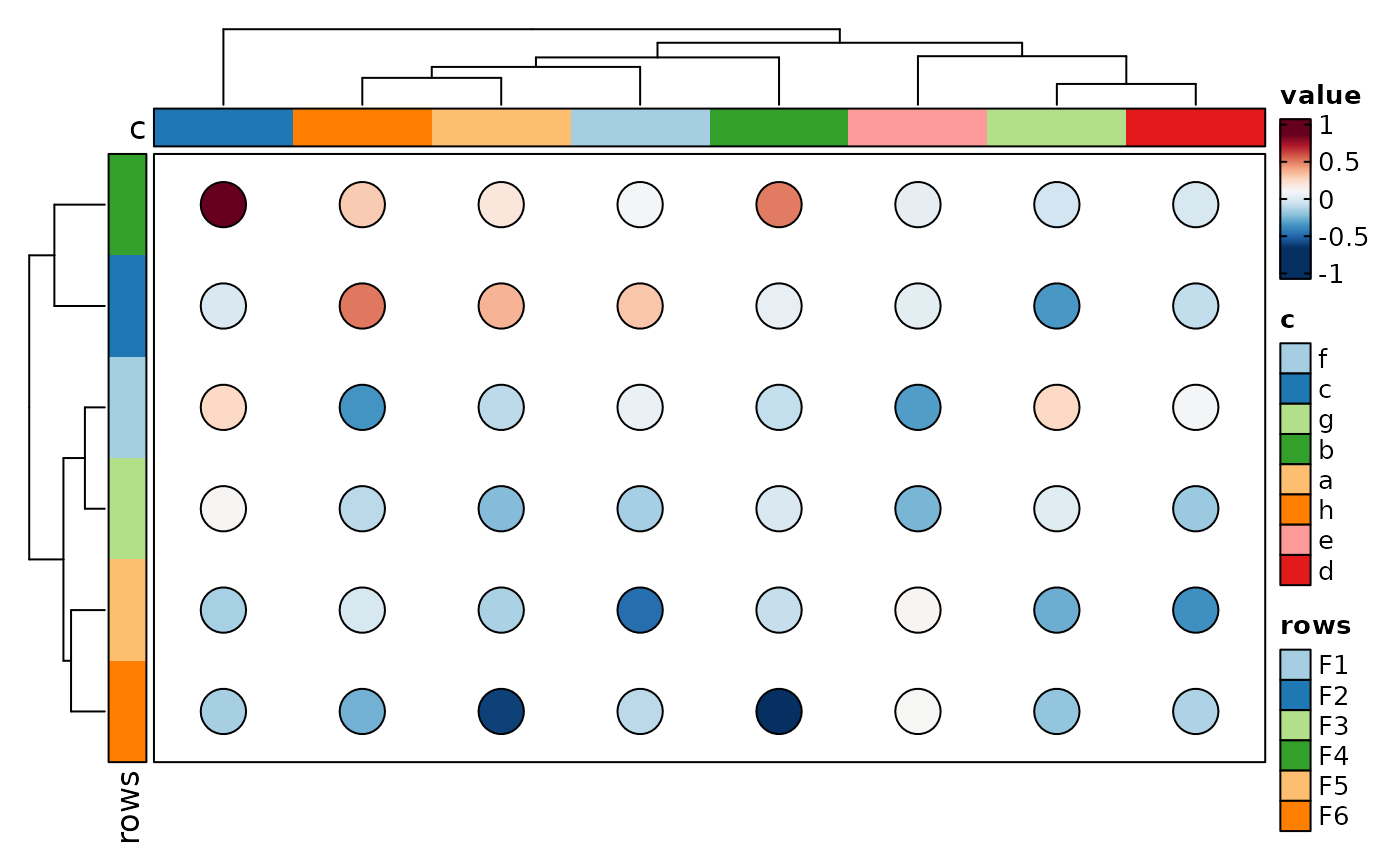
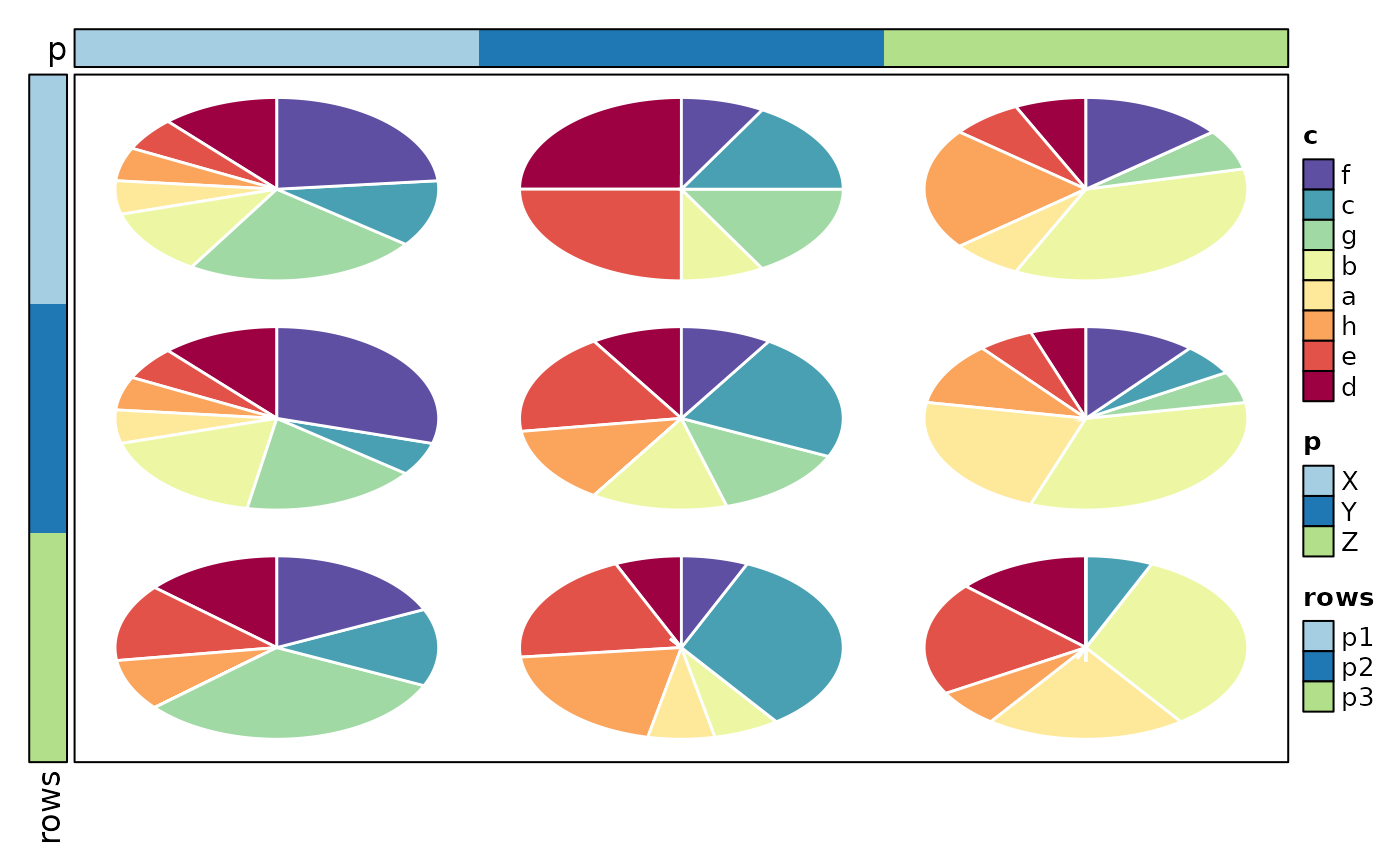
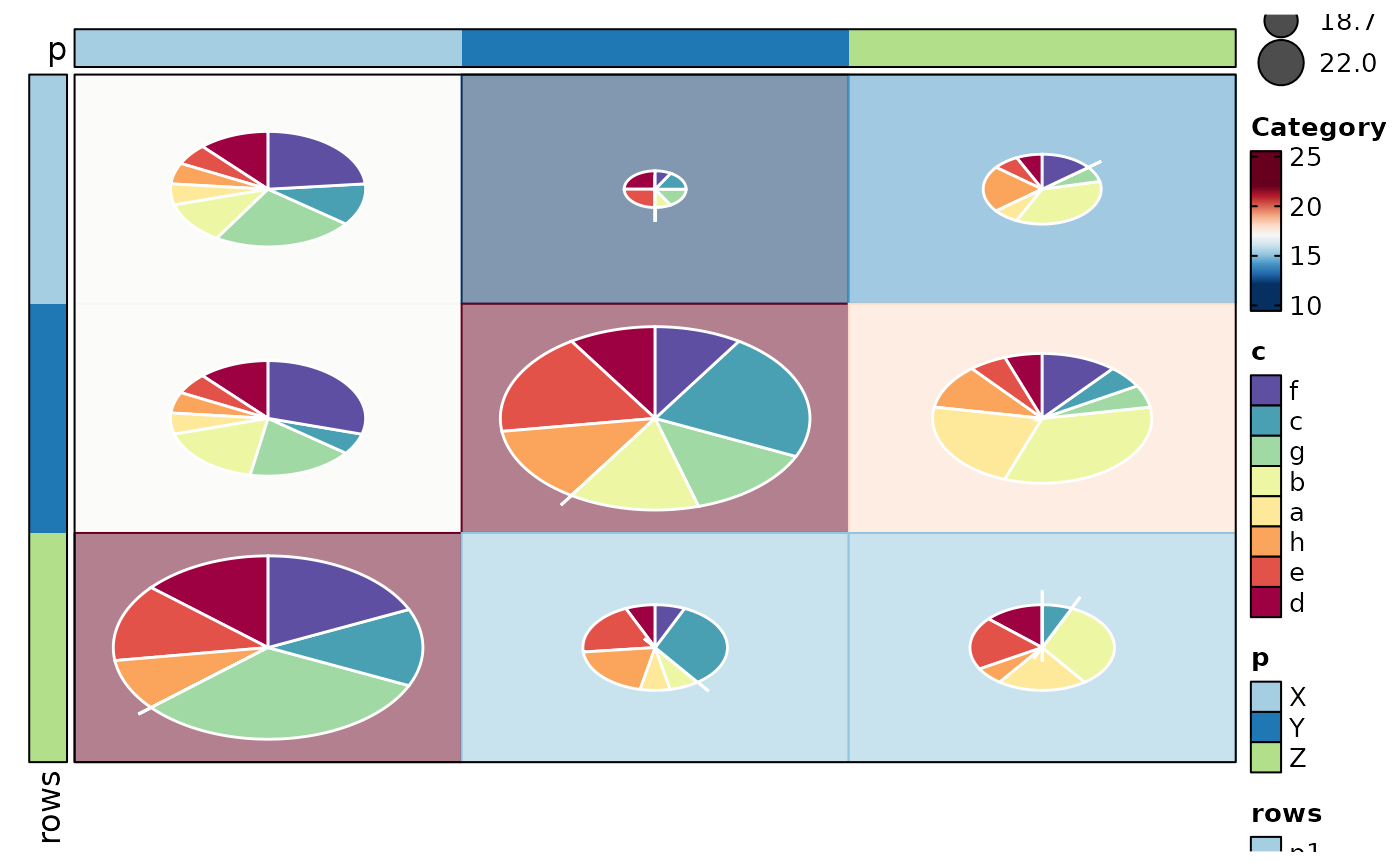
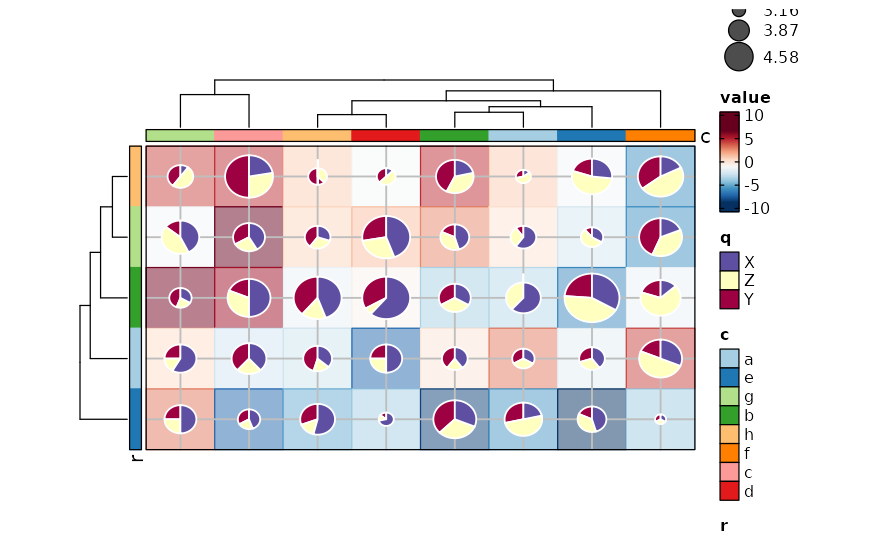
 if (requireNamespace("cluster", quietly = TRUE)) {
Heatmap(data, values_by = "value", rows_by = "r", columns_by = "c",
cell_type = "pie", pie_group_by = "q", pie_size = sqrt,
add_bg = TRUE, add_reticle = TRUE)
}
if (requireNamespace("cluster", quietly = TRUE)) {
Heatmap(data, values_by = "value", rows_by = "r", columns_by = "c",
cell_type = "pie", pie_group_by = "q", pie_size = sqrt,
add_bg = TRUE, add_reticle = TRUE)
}
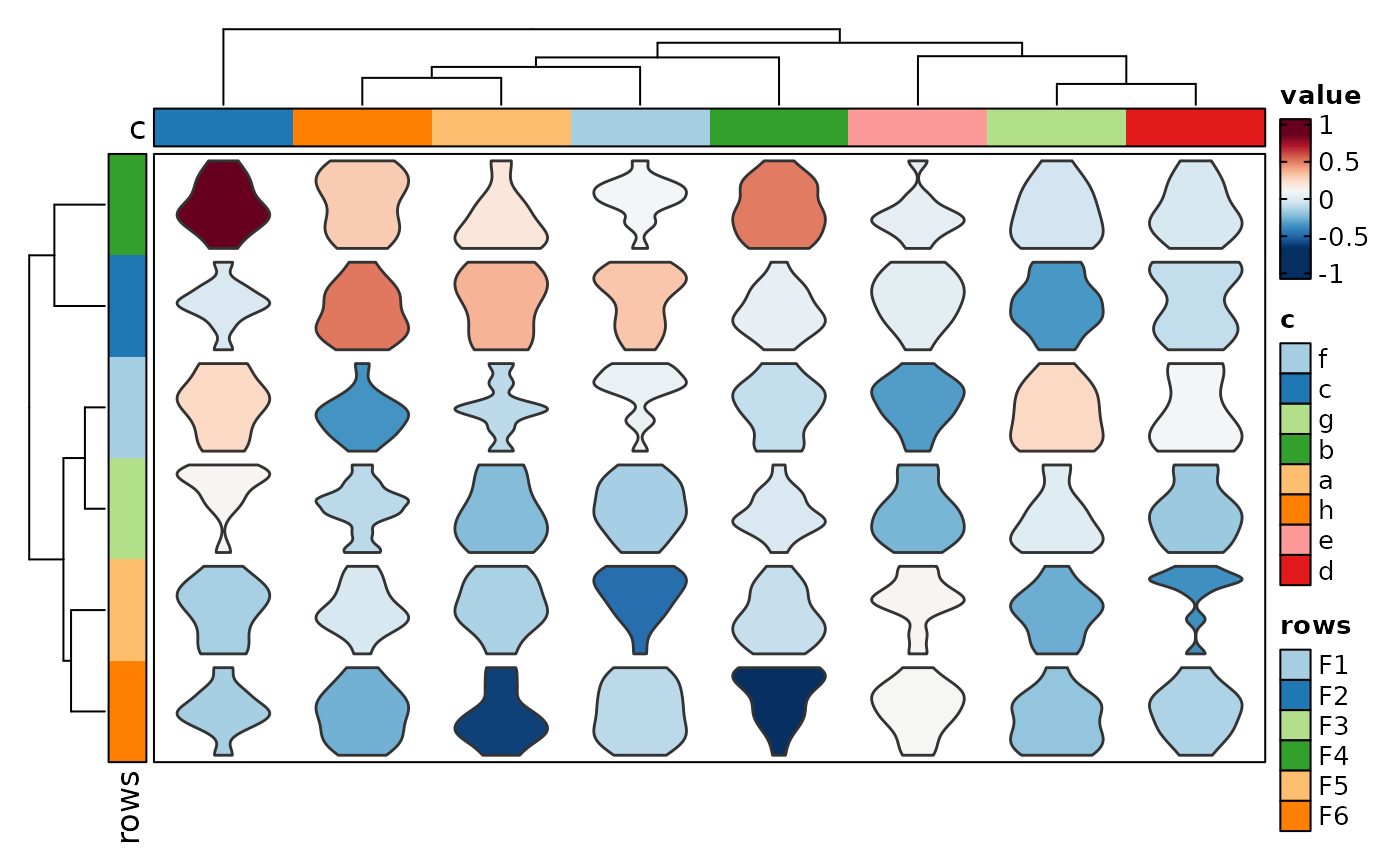
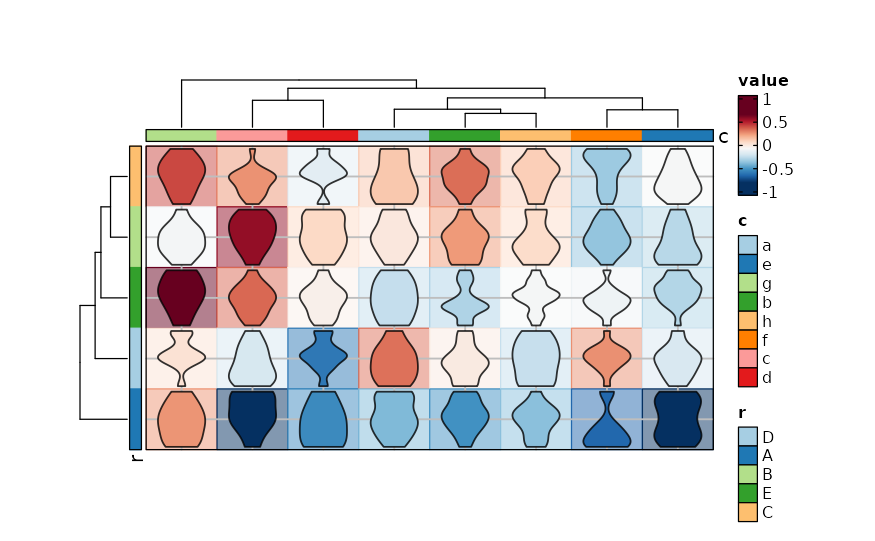
 if (requireNamespace("cluster", quietly = TRUE)) {
Heatmap(data, values_by = "value", rows_by = "r", columns_by = "c",
cell_type = "violin", add_bg = TRUE, add_reticle = TRUE)
}
if (requireNamespace("cluster", quietly = TRUE)) {
Heatmap(data, values_by = "value", rows_by = "r", columns_by = "c",
cell_type = "violin", add_bg = TRUE, add_reticle = TRUE)
}
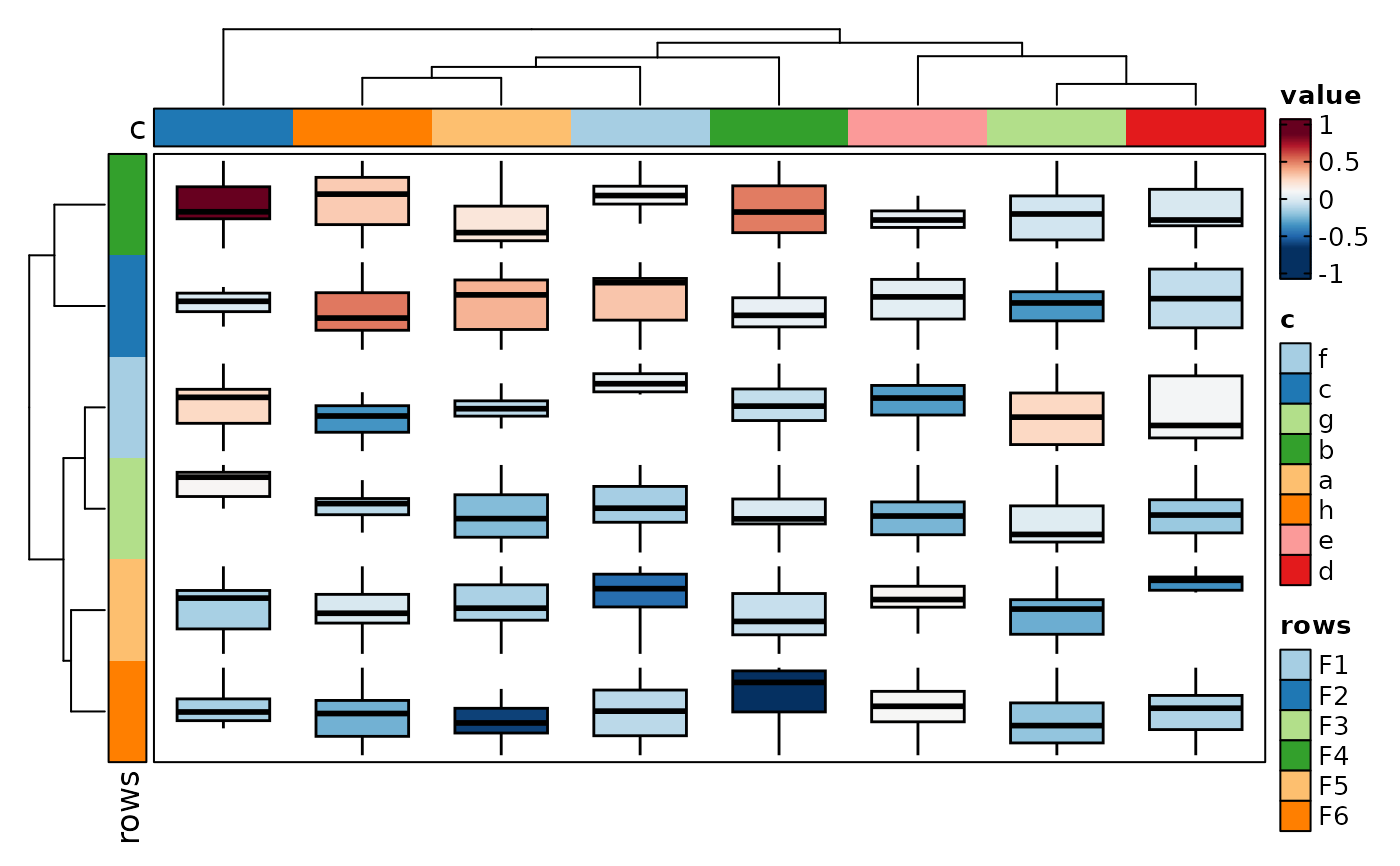
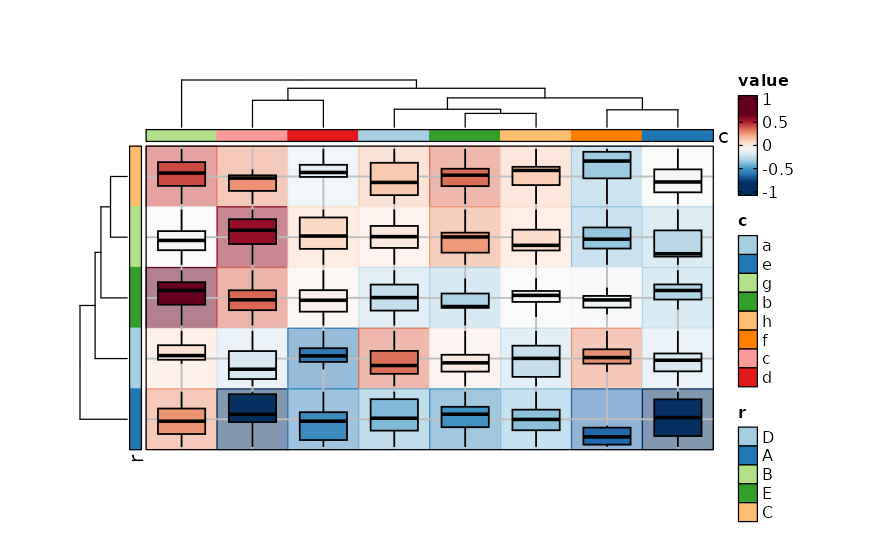
 if (requireNamespace("cluster", quietly = TRUE)) {
Heatmap(data, values_by = "value", rows_by = "r", columns_by = "c",
cell_type = "boxplot", add_bg = TRUE, add_reticle = TRUE)
}
if (requireNamespace("cluster", quietly = TRUE)) {
Heatmap(data, values_by = "value", rows_by = "r", columns_by = "c",
cell_type = "boxplot", add_bg = TRUE, add_reticle = TRUE)
}
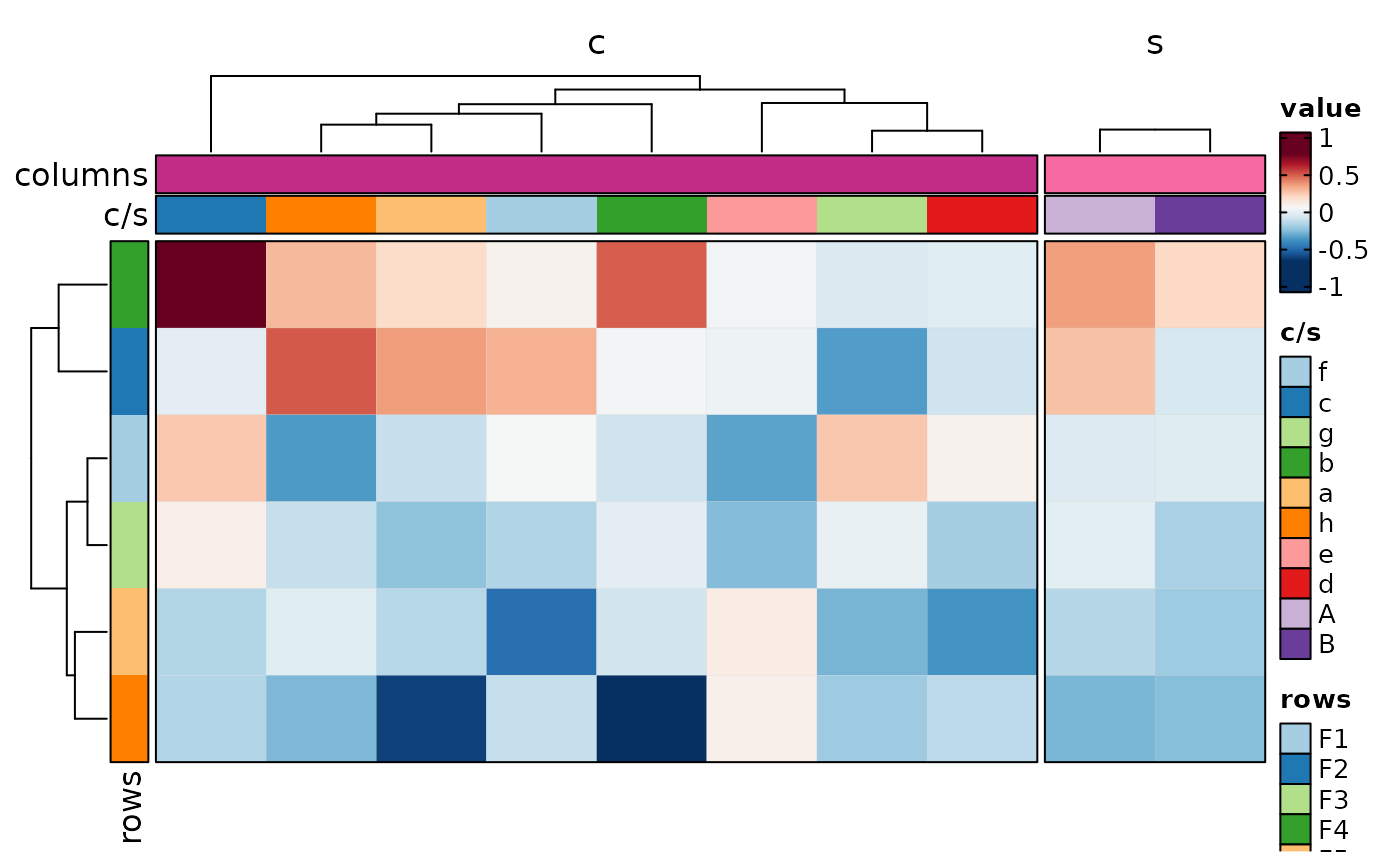
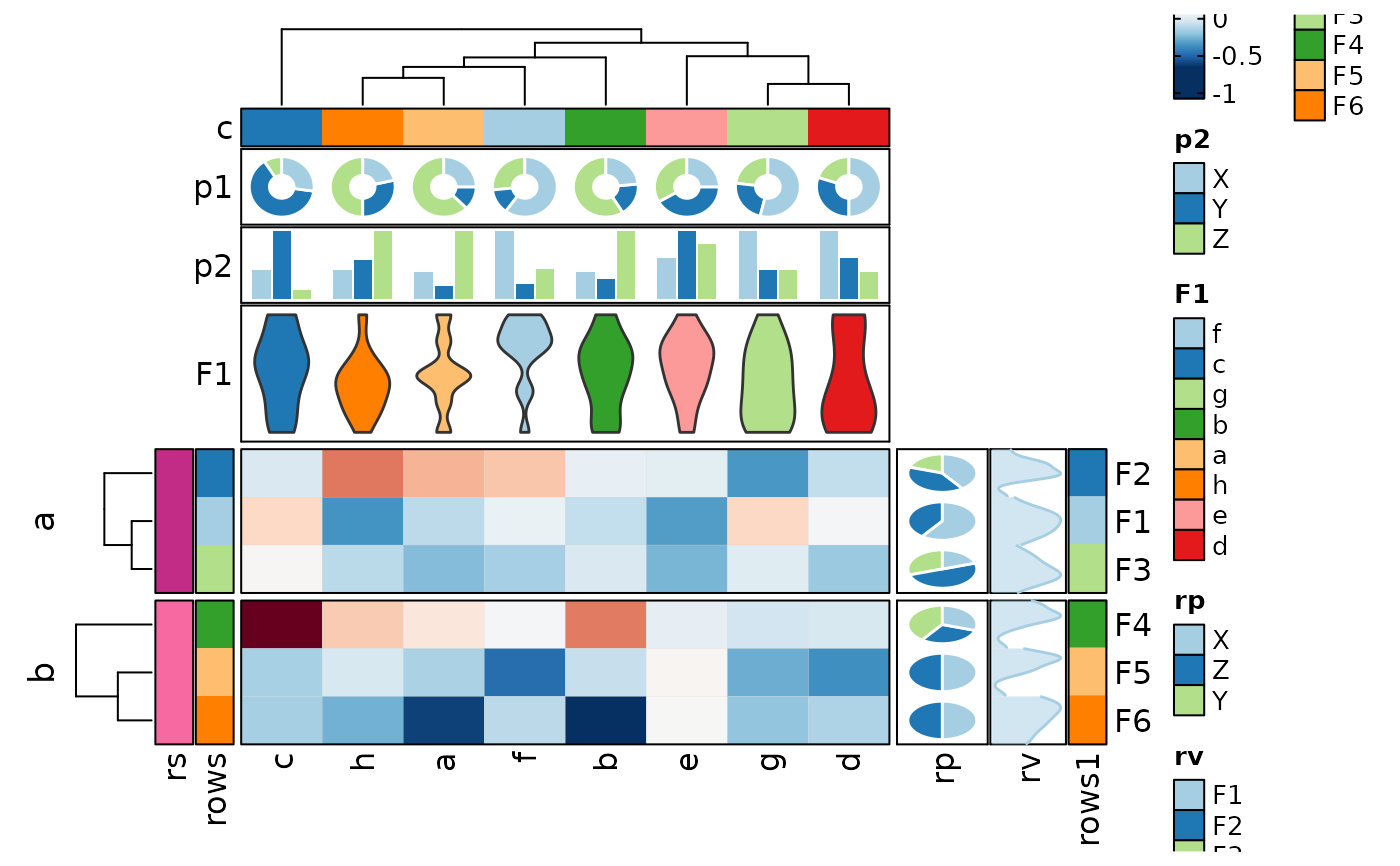
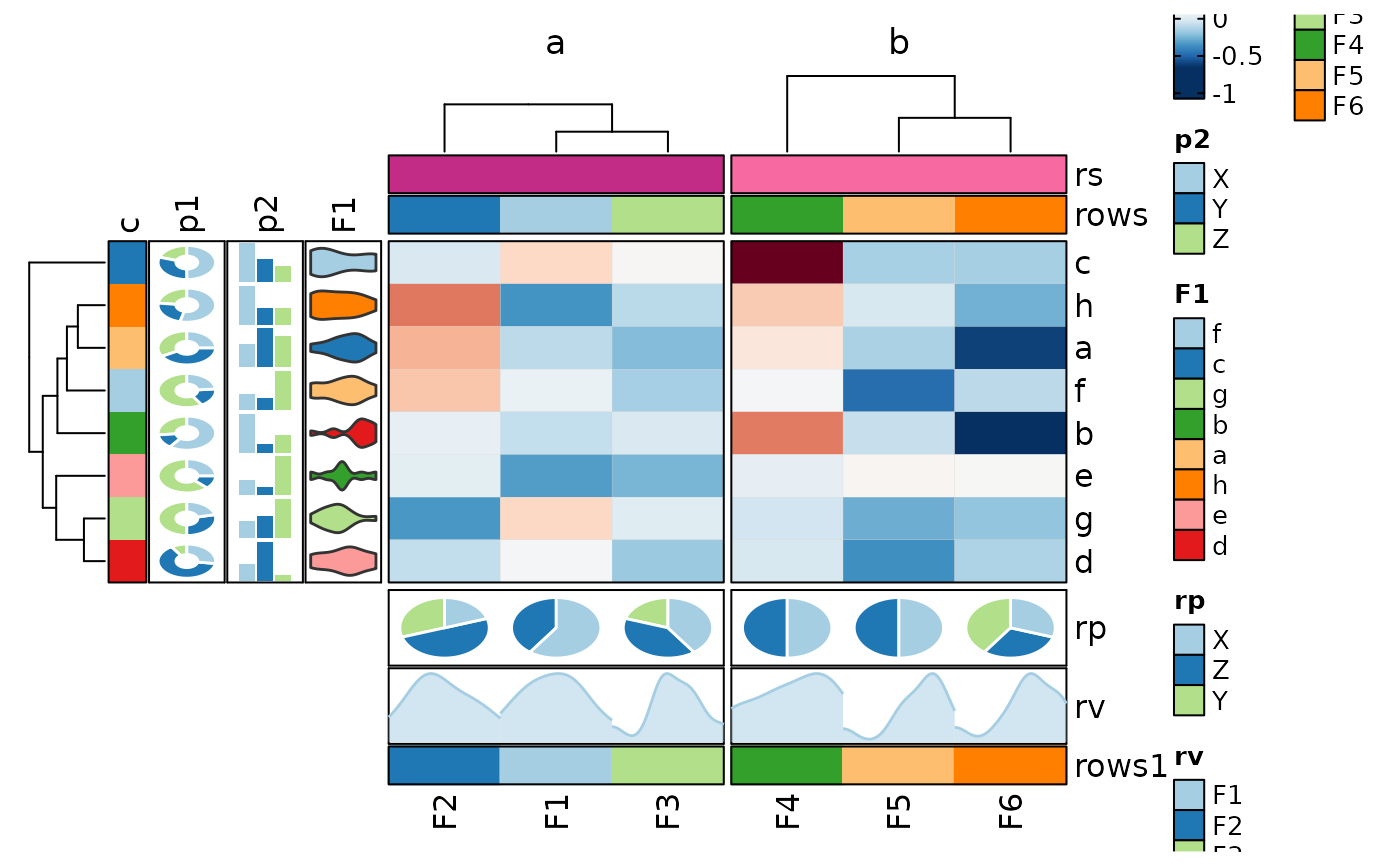
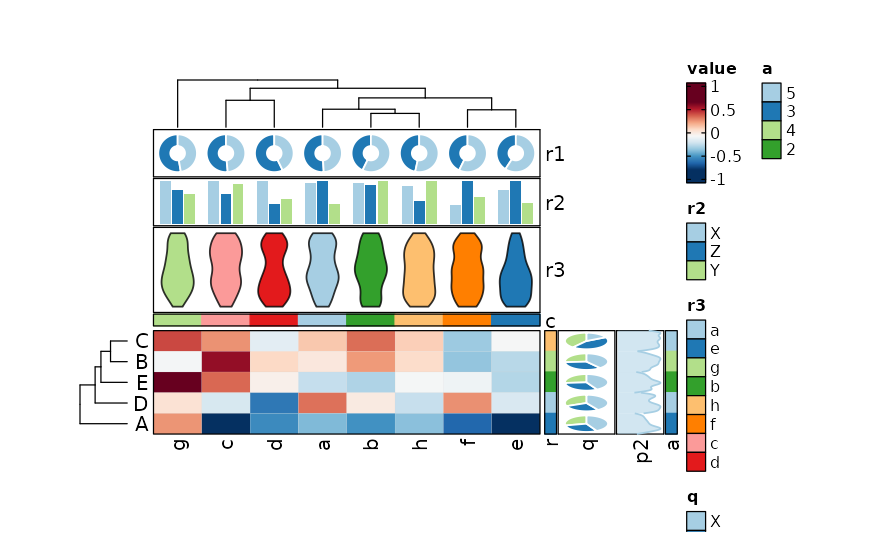
 if (requireNamespace("cluster", quietly = TRUE)) {
Heatmap(data,
values_by = "value", rows_by = "r", columns_by = "c",
column_annotation = list(r1 = "p", r2 = "q", r3 = "p1"),
column_annotation_type = list(r1 = "ring", r2 = "bar", r3 = "violin"),
column_annotation_params = list(
r1 = list(height = grid::unit(10, "mm"), show_legend = FALSE),
r3 = list(height = grid::unit(18, "mm"))
),
row_annotation = c("q", "p2", "a"),
row_annotation_side = "right",
row_annotation_type = list(q = "pie", p2 = "density", a = "simple"),
row_annotation_params = list(q = list(width = grid::unit(12, "mm"))),
show_row_names = TRUE, show_column_names = TRUE
)
}
#> Warning: [Heatmap] Assuming 'row_annotation_agg["a"] = dplyr::first' for the simple annotation
if (requireNamespace("cluster", quietly = TRUE)) {
Heatmap(data,
values_by = "value", rows_by = "r", columns_by = "c",
column_annotation = list(r1 = "p", r2 = "q", r3 = "p1"),
column_annotation_type = list(r1 = "ring", r2 = "bar", r3 = "violin"),
column_annotation_params = list(
r1 = list(height = grid::unit(10, "mm"), show_legend = FALSE),
r3 = list(height = grid::unit(18, "mm"))
),
row_annotation = c("q", "p2", "a"),
row_annotation_side = "right",
row_annotation_type = list(q = "pie", p2 = "density", a = "simple"),
row_annotation_params = list(q = list(width = grid::unit(12, "mm"))),
show_row_names = TRUE, show_column_names = TRUE
)
}
#> Warning: [Heatmap] Assuming 'row_annotation_agg["a"] = dplyr::first' for the simple annotation
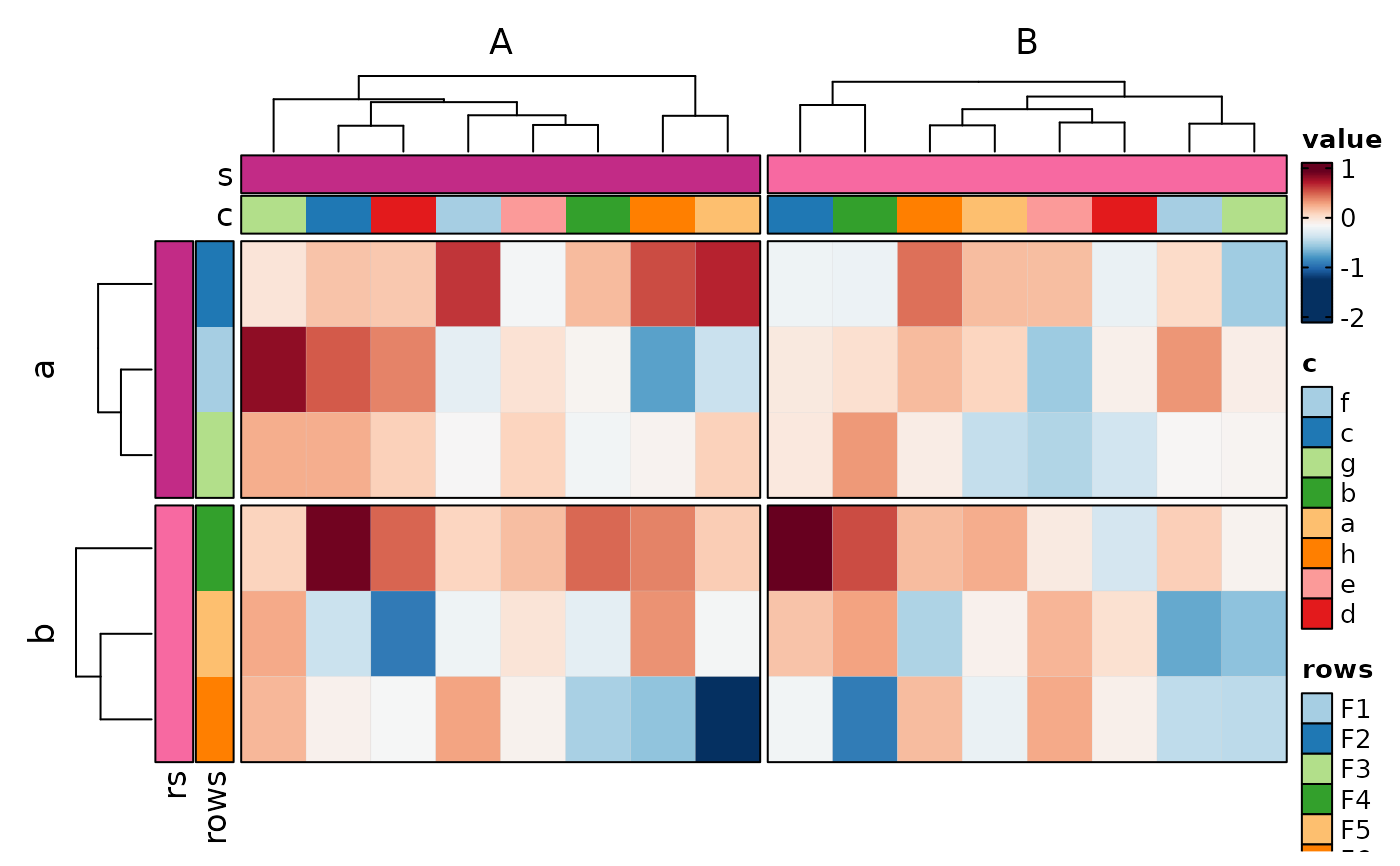
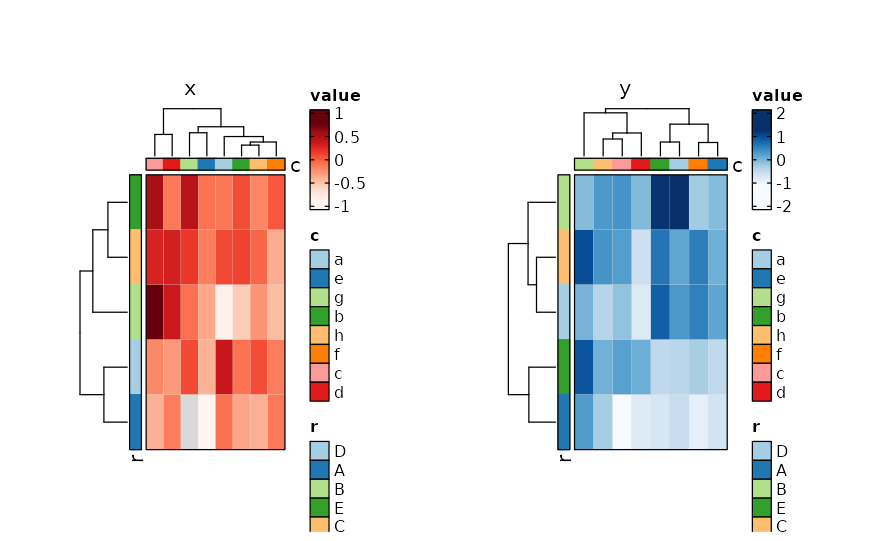
 if (requireNamespace("cluster", quietly = TRUE)) {
Heatmap(data,
values_by = "value", rows_by = "r", columns_by = "c",
split_by = "p", palette = list(x = "Reds", y = "Blues")
)
}
if (requireNamespace("cluster", quietly = TRUE)) {
Heatmap(data,
values_by = "value", rows_by = "r", columns_by = "c",
split_by = "p", palette = list(x = "Reds", y = "Blues")
)
}
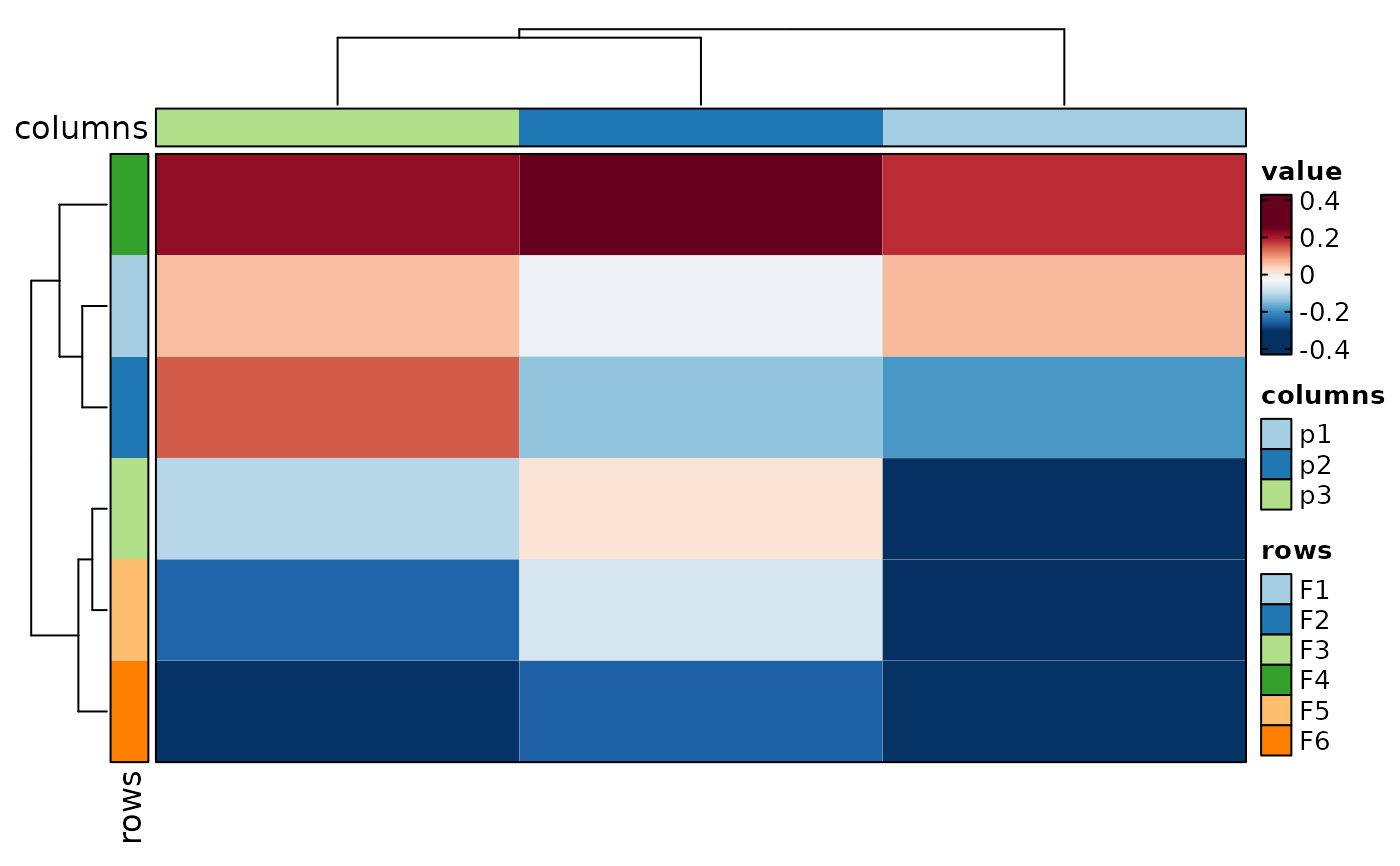
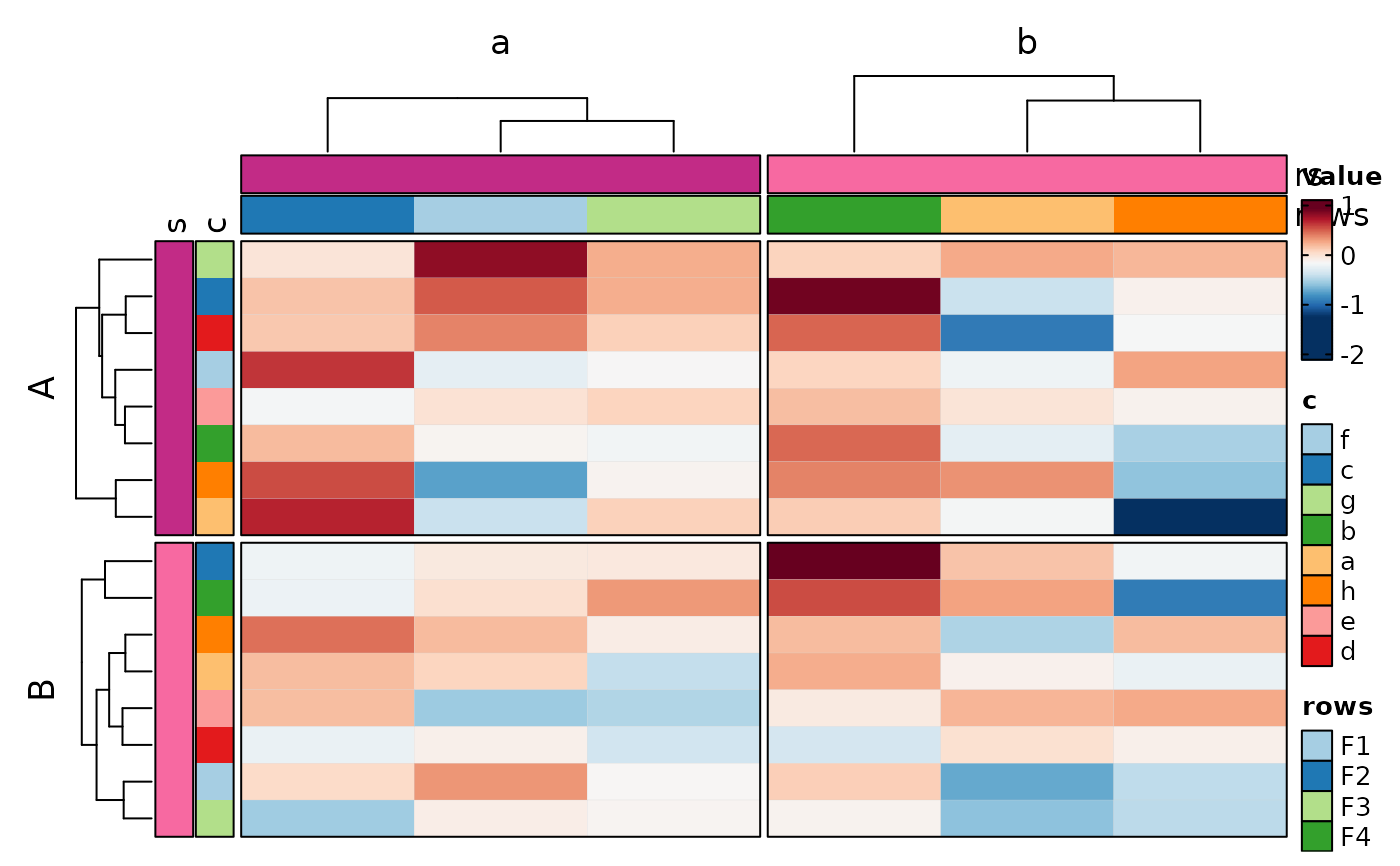
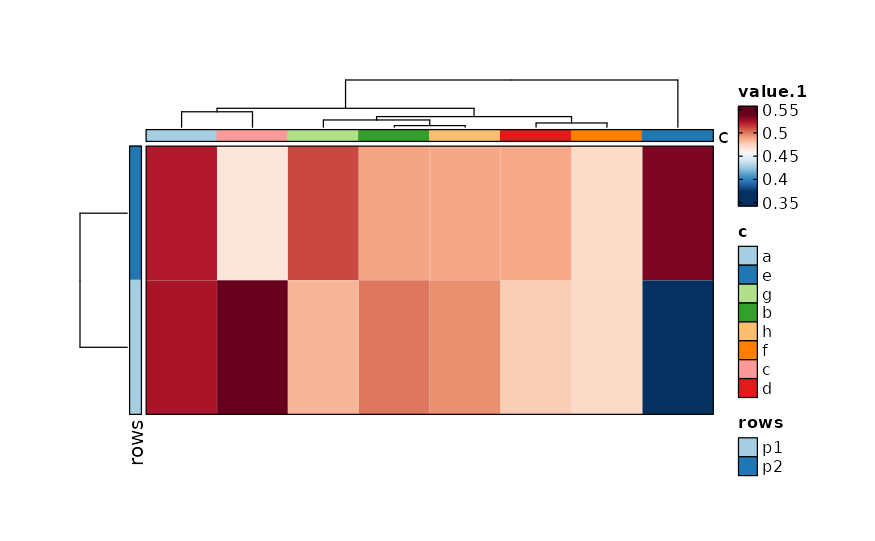
 if (requireNamespace("cluster", quietly = TRUE)) {
# implies in_form = "wide-rows"
Heatmap(data, rows_by = c("p1", "p2"), columns_by = "c")
}
if (requireNamespace("cluster", quietly = TRUE)) {
# implies in_form = "wide-rows"
Heatmap(data, rows_by = c("p1", "p2"), columns_by = "c")
}
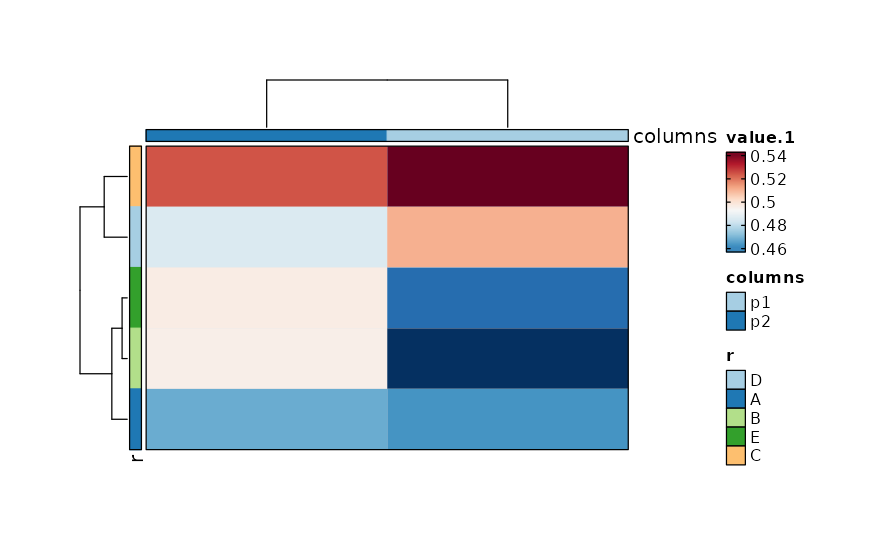
 if (requireNamespace("cluster", quietly = TRUE)) {
# implies wide-columns
Heatmap(data, rows_by = "r", columns_by = c("p1", "p2"))
}
if (requireNamespace("cluster", quietly = TRUE)) {
# implies wide-columns
Heatmap(data, rows_by = "r", columns_by = c("p1", "p2"))
}
 # }
# }