Plot the length distribution of the CDR3 sequences
Usage
ClonalLengthPlot(
  data,
  clone_call = "aa",
  chain = "both",
  plot_type = c("bar", "box", "violin", "density"),
  x_nbreaks = 10,
  group_by = "Sample",
  order = NULL,
  xlab = "Length",
  ylab = NULL,
  position = "dodge",
  facet_by = NULL,
  split_by = NULL,
  ...
)
Arguments
- data
The product of scRepertoire::combineTCR, scRepertoire::combineTCR, or scRepertoire::combineExpression.
- clone_call
How to call the clone - only "nt" or "aa" is supported.
- chain
indicate if both or a specific chain should be used - e.g. "both", "TRA", "TRB", "TRD", "TRG", "IGH", or "IGL" to specify a specific chain.
- plot_type
The type of plot to use. Default is "bar". Possible values are "box", "violin" and "density".
- x_nbreaks
The number of breaks for the x-axis. Default is 10.
- group_by
The column name in the meta data to group the cells. Default: "Sample"
- order
The order of the groups. Default is an empty list. It should be a list of values. The names are the column names, and the values are the order.
- xlab
The x-axis label.
- ylab
The y-axis label.
- position
The position of the bars for bar plot on the x-axis. Default is "dodge".
- facet_by
The column name in the meta data to facet the plots. Default: NULL
- split_by
The column name in the meta data to split the plots. Default: NULL
- ...
Other arguments passed to the specific plot function.
For
barplot, seeplotthis::BarPlot().For
boxplot, seeplotthis::BoxPlot().For
violinplot, seeplotthis::ViolinPlot().For
densityplot, seeplotthis::DensityPlot().
Examples
# \donttest{
set.seed(8525)
data(contig_list, package = "scRepertoire")
data <- scRepertoire::combineTCR(contig_list)
data <- scRepertoire::addVariable(data, variable.name = "Type",
variables = factor(sample(c("B", "L"), 8, replace = TRUE), levels = c("L", "B")))
data <- scRepertoire::addVariable(data, variable.name = "Sex",
variables = factor(sample(c("M", "F"), 8, replace = TRUE), levels = c("M", "F")))
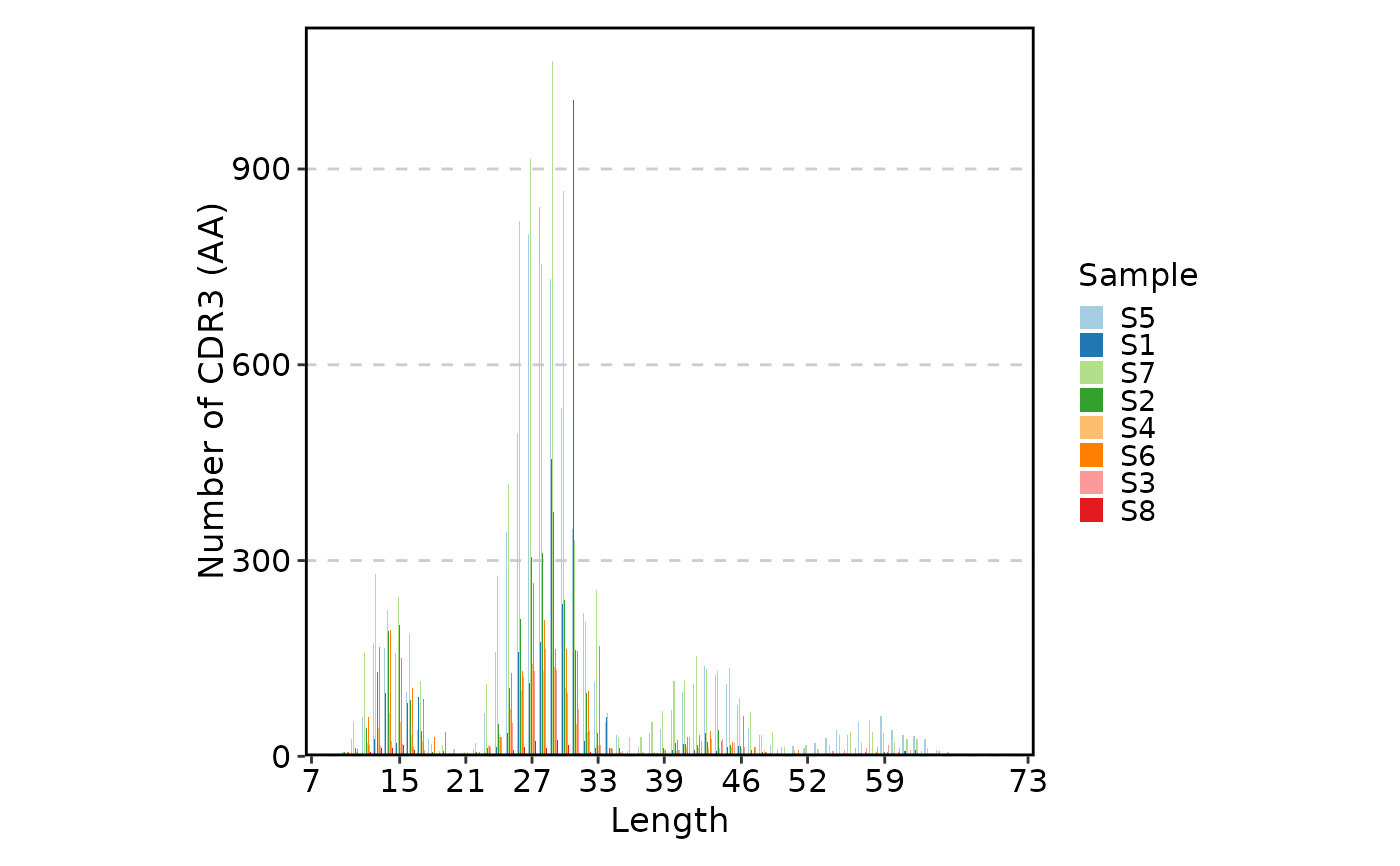
ClonalLengthPlot(data)
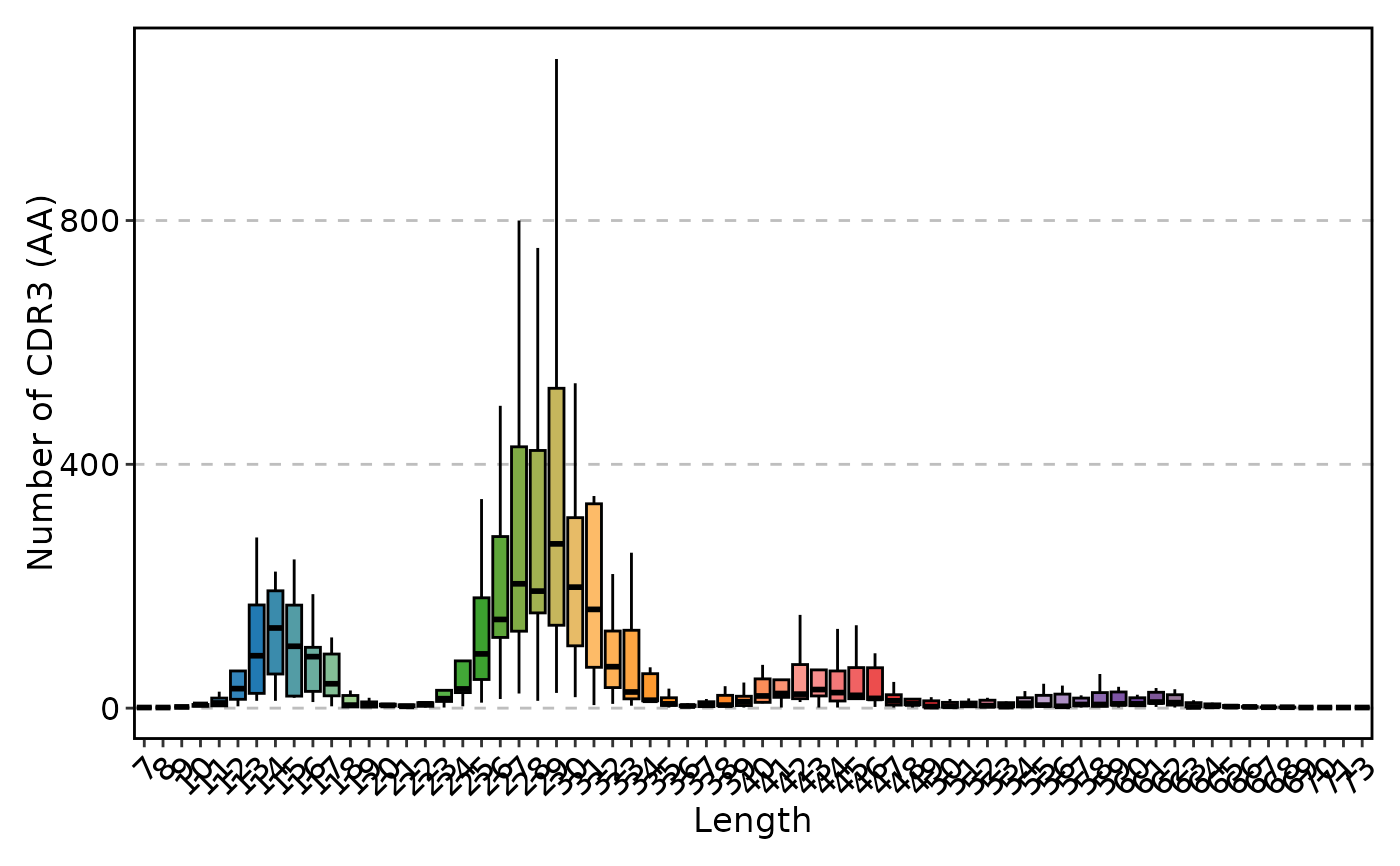
 ClonalLengthPlot(data, plot_type = "box")
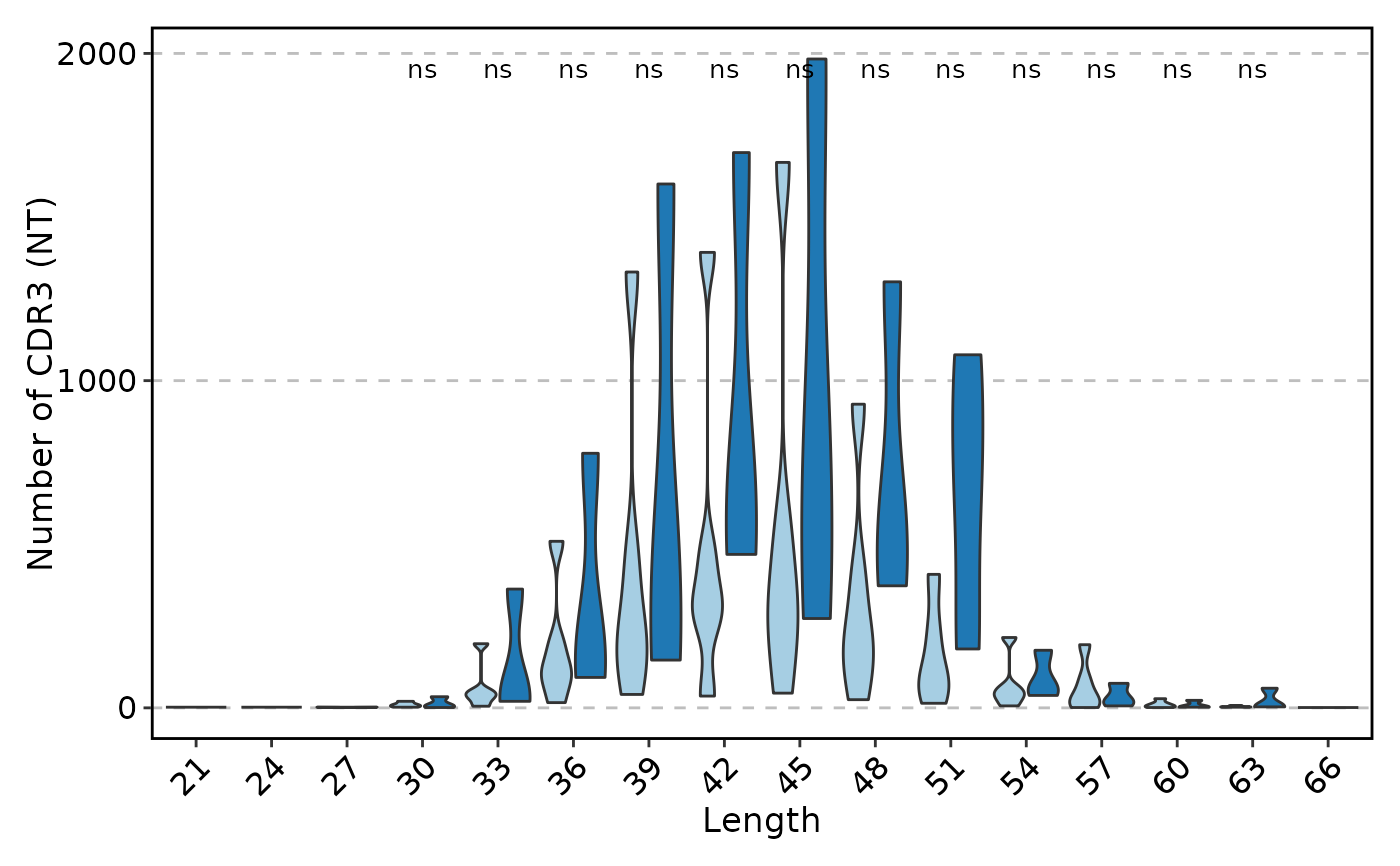
 ClonalLengthPlot(data, clone_call = "nt", plot_type = "violin", chain = "TRB",
group_by = "Type", comparisons = TRUE)
#> Warning: [Box/Violin/BeeswarmPlot] Some pairwise comparisons may fail due to insufficient data points or variability. Adjusting data to ensure valid comparisons.
#> Warning: Groups with fewer than two datapoints have been dropped.
#> ℹ Set `drop = FALSE` to consider such groups for position adjustment purposes.
#> Warning: Groups with fewer than two datapoints have been dropped.
#> ℹ Set `drop = FALSE` to consider such groups for position adjustment purposes.
#> Warning: Groups with fewer than two datapoints have been dropped.
#> ℹ Set `drop = FALSE` to consider such groups for position adjustment purposes.
#> Warning: Groups with fewer than two datapoints have been dropped.
#> ℹ Set `drop = FALSE` to consider such groups for position adjustment purposes.
#> Warning: Groups with fewer than two datapoints have been dropped.
#> ℹ Set `drop = FALSE` to consider such groups for position adjustment purposes.
#> Warning: Groups with fewer than two datapoints have been dropped.
#> ℹ Set `drop = FALSE` to consider such groups for position adjustment purposes.
ClonalLengthPlot(data, clone_call = "nt", plot_type = "violin", chain = "TRB",
group_by = "Type", comparisons = TRUE)
#> Warning: [Box/Violin/BeeswarmPlot] Some pairwise comparisons may fail due to insufficient data points or variability. Adjusting data to ensure valid comparisons.
#> Warning: Groups with fewer than two datapoints have been dropped.
#> ℹ Set `drop = FALSE` to consider such groups for position adjustment purposes.
#> Warning: Groups with fewer than two datapoints have been dropped.
#> ℹ Set `drop = FALSE` to consider such groups for position adjustment purposes.
#> Warning: Groups with fewer than two datapoints have been dropped.
#> ℹ Set `drop = FALSE` to consider such groups for position adjustment purposes.
#> Warning: Groups with fewer than two datapoints have been dropped.
#> ℹ Set `drop = FALSE` to consider such groups for position adjustment purposes.
#> Warning: Groups with fewer than two datapoints have been dropped.
#> ℹ Set `drop = FALSE` to consider such groups for position adjustment purposes.
#> Warning: Groups with fewer than two datapoints have been dropped.
#> ℹ Set `drop = FALSE` to consider such groups for position adjustment purposes.
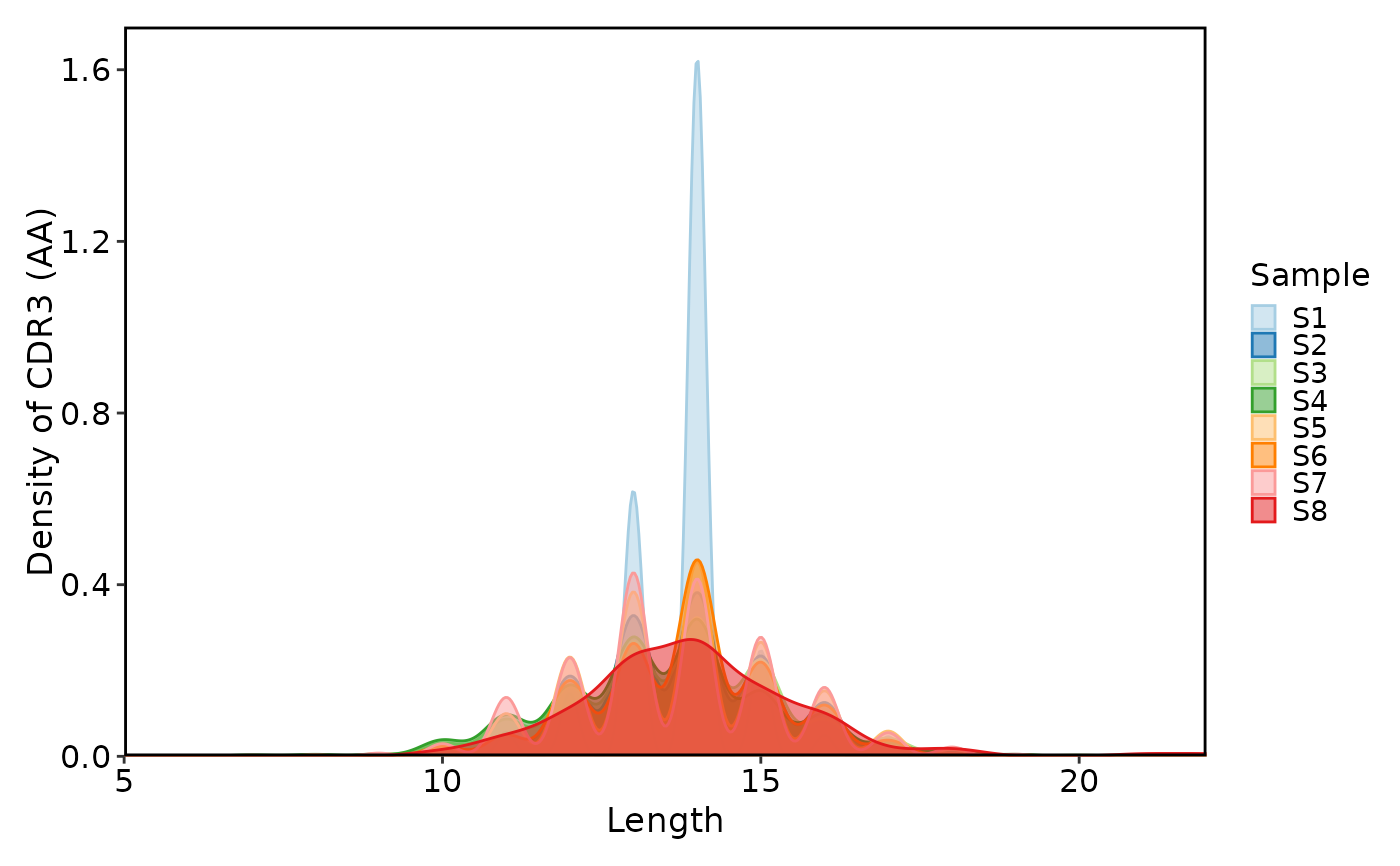
 ClonalLengthPlot(data, plot_type = "density", chain = "TRA")
 # }
# }