Box plot, bar plot (mean values), or violin plot with optional jitter points, trend line, statistical test, background, line, and highlight.
When base = "bar", bars show the mean values with optional error bars (SEM, SD, or CI).
Usage
BoxPlot(
  data,
  x,
  x_sep = "_",
  y = NULL,
  base = c("box", "bar"),
  in_form = c("long", "wide"),
  split_by = NULL,
  split_by_sep = "_",
  symnum_args = NULL,
  sort_x = NULL,
  flip = FALSE,
  keep_empty = FALSE,
  keep_na = FALSE,
  group_by = NULL,
  group_by_sep = "_",
  group_name = NULL,
  paired_by = NULL,
  x_text_angle = ifelse(isTRUE(flip), 0, 45),
  step_increase = 0.1,
  fill_mode = ifelse(!is.null(group_by), "dodge", "x"),
  palreverse = FALSE,
  position_dodge_preserve = "total",
  theme = "theme_this",
  theme_args = list(),
  palette = "Paired",
  palcolor = NULL,
  alpha = 1,
  aspect.ratio = NULL,
  legend.position = "right",
  legend.direction = "vertical",
  add_point = FALSE,
  pt_color = if (isTRUE(add_beeswarm)) NULL else "grey30",
  pt_size = NULL,
  pt_alpha = 1,
  jitter_width = NULL,
  jitter_height = 0,
  stack = FALSE,
  y_max = NULL,
  y_min = NULL,
  add_beeswarm = FALSE,
  beeswarm_method = "swarm",
  beeswarm_cex = 1,
  beeswarm_priority = "ascending",
  beeswarm_dodge = 0.9,
  add_trend = FALSE,
  trend_color = NULL,
  trend_linewidth = 1,
  trend_ptsize = 2,
  add_stat = NULL,
  stat_name = NULL,
  stat_color = "black",
  stat_size = 1,
  stat_stroke = 1,
  stat_shape = 25,
  add_errorbar = "SEM",
  errorbar_color = "grey20",
  errorbar_width = 0.4,
  errorbar_linewidth = 0.6,
  add_bg = FALSE,
  bg_palette = "stripe",
  bg_palcolor = NULL,
  bg_alpha = 0.2,
  add_line = NULL,
  line_color = "red2",
  line_width = 0.6,
  line_type = 2,
  highlight = NULL,
  highlight_color = "red2",
  highlight_size = 1,
  highlight_alpha = 1,
  comparisons = NULL,
  ref_group = NULL,
  pairwise_method = "wilcox.test",
  multiplegroup_comparisons = FALSE,
  multiple_method = "kruskal.test",
  sig_label = "p.format",
  sig_labelsize = 3.5,
  hide_ns = FALSE,
  facet_by = NULL,
  facet_scales = "fixed",
  facet_ncol = NULL,
  facet_nrow = NULL,
  facet_byrow = TRUE,
  title = NULL,
  subtitle = NULL,
  xlab = NULL,
  ylab = NULL,
  seed = 8525,
  combine = TRUE,
  nrow = NULL,
  ncol = NULL,
  byrow = TRUE,
  axes = NULL,
  axis_titles = axes,
  guides = NULL,
  ...
)

ViolinPlot(
  data,
  x,
  x_sep = "_",
  y = NULL,
  in_form = c("long", "wide"),
  split_by = NULL,
  split_by_sep = "_",
  symnum_args = NULL,
  sort_x = NULL,
  flip = FALSE,
  keep_empty = FALSE,
  keep_na = FALSE,
  group_by = NULL,
  group_by_sep = "_",
  group_name = NULL,
  paired_by = NULL,
  x_text_angle = ifelse(isTRUE(flip), 0, 45),
  step_increase = 0.1,
  fill_mode = ifelse(!is.null(group_by), "dodge", "x"),
  palreverse = FALSE,
  position_dodge_preserve = "total",
  theme = "theme_this",
  theme_args = list(),
  palette = "Paired",
  palcolor = NULL,
  alpha = 1,
  aspect.ratio = NULL,
  legend.position = "right",
  legend.direction = "vertical",
  add_point = FALSE,
  pt_color = if (isTRUE(add_beeswarm)) NULL else "grey30",
  pt_size = NULL,
  pt_alpha = 1,
  jitter_width = NULL,
  jitter_height = 0,
  stack = FALSE,
  y_max = NULL,
  y_min = NULL,
  add_beeswarm = FALSE,
  beeswarm_method = "swarm",
  beeswarm_cex = 1,
  beeswarm_priority = "ascending",
  beeswarm_dodge = 0.9,
  add_box = FALSE,
  box_color = "black",
  box_width = 0.1,
  box_ptsize = 2.5,
  add_trend = FALSE,
  trend_color = NULL,
  trend_linewidth = 1,
  trend_ptsize = 2,
  add_stat = NULL,
  stat_name = NULL,
  stat_color = "black",
  stat_size = 1,
  stat_stroke = 1,
  stat_shape = 25,
  add_bg = FALSE,
  bg_palette = "stripe",
  bg_palcolor = NULL,
  bg_alpha = 0.2,
  add_line = NULL,
  line_color = "red2",
  line_width = 0.6,
  line_type = 2,
  highlight = NULL,
  highlight_color = "red2",
  highlight_size = 1,
  highlight_alpha = 1,
  comparisons = NULL,
  ref_group = NULL,
  pairwise_method = "wilcox.test",
  multiplegroup_comparisons = FALSE,
  multiple_method = "kruskal.test",
  sig_label = "p.format",
  sig_labelsize = 3.5,
  hide_ns = FALSE,
  facet_by = NULL,
  facet_scales = "fixed",
  facet_ncol = NULL,
  facet_nrow = NULL,
  facet_byrow = TRUE,
  title = NULL,
  subtitle = NULL,
  xlab = NULL,
  ylab = NULL,
  seed = 8525,
  combine = TRUE,
  nrow = NULL,
  ncol = NULL,
  byrow = TRUE,
  axes = NULL,
  axis_titles = axes,
  guides = NULL,
  ...
)

BeeswarmPlot(
  data,
  x,
  x_sep = "_",
  y = NULL,
  in_form = c("long", "wide"),
  split_by = NULL,
  split_by_sep = "_",
  symnum_args = NULL,
  sort_x = NULL,
  flip = FALSE,
  keep_empty = FALSE,
  keep_na = FALSE,
  group_by = NULL,
  group_by_sep = "_",
  group_name = NULL,
  paired_by = NULL,
  x_text_angle = ifelse(isTRUE(flip), 0, 45),
  step_increase = 0.1,
  fill_mode = ifelse(!is.null(group_by), "dodge", "x"),
  palreverse = FALSE,
  theme = "theme_this",
  theme_args = list(),
  palette = "Paired",
  palcolor = NULL,
  alpha = 1,
  aspect.ratio = NULL,
  legend.position = "right",
  legend.direction = "vertical",
  pt_color = NULL,
  pt_size = NULL,
  pt_alpha = 1,
  position_dodge_preserve = "total",
  jitter_width = NULL,
  jitter_height = 0,
  stack = FALSE,
  y_max = NULL,
  y_min = NULL,
  add_violin = FALSE,
  beeswarm_method = "swarm",
  beeswarm_cex = 1,
  beeswarm_priority = "ascending",
  beeswarm_dodge = 0.9,
  add_box = FALSE,
  box_color = "black",
  box_width = 0.1,
  box_ptsize = 2.5,
  add_trend = FALSE,
  trend_color = NULL,
  trend_linewidth = 1,
  trend_ptsize = 2,
  add_stat = NULL,
  stat_name = NULL,
  stat_color = "black",
  stat_size = 1,
  stat_stroke = 1,
  stat_shape = 25,
  add_bg = FALSE,
  bg_palette = "stripe",
  bg_palcolor = NULL,
  bg_alpha = 0.2,
  add_line = NULL,
  line_color = "red2",
  line_width = 0.6,
  line_type = 2,
  highlight = NULL,
  highlight_color = "red2",
  highlight_size = 1,
  highlight_alpha = 1,
  comparisons = NULL,
  ref_group = NULL,
  pairwise_method = "wilcox.test",
  multiplegroup_comparisons = FALSE,
  multiple_method = "kruskal.test",
  sig_label = "p.format",
  sig_labelsize = 3.5,
  hide_ns = FALSE,
  facet_by = NULL,
  facet_scales = "fixed",
  facet_ncol = NULL,
  facet_nrow = NULL,
  facet_byrow = TRUE,
  title = NULL,
  subtitle = NULL,
  xlab = NULL,
  ylab = NULL,
  seed = 8525,
  combine = TRUE,
  nrow = NULL,
  ncol = NULL,
  byrow = TRUE,
  axes = NULL,
  axis_titles = axes,
  guides = NULL,
  ...
)
Arguments
- data
A data frame.
- x
A character string specifying the column name of the data frame to plot for the x-axis.
- x_sep
A character string to concatenate the columns in
x, if multiple columns are provided. Whenin_formis "wide",xcolumns will not be concatenated.- y
A character string specifying the column name of the data frame to plot for the y-axis.
- base
A character string to specify the base plot type. Either "box", "violin", "bar" or "none" (used by BeeswarmPlot). When "bar", bars showing the mean values are plotted. This is mutually exclusive with
add_box.- in_form
A character string to specify the input data type. Either "long" or "wide".
- split_by
The column(s) to split data by and plot separately.
- split_by_sep
The separator for multiple split_by columns. See
split_by- symnum_args
A list of arguments to pass to the function
symnumfor symbolic number coding of p-values. For example,symnum_args <- list(cutpoints = c(0, 0.0001, 0.001, 0.01, 0.05, Inf), symbols = c("****", "***", "**", "*", "ns")). In other words, we use the following convention for symbols indicating statistical significance:ns: p > 0.05*: p <= 0.05**: p <= 0.01***: p <= 0.001****: p <= 0.0001
- sort_x
An expression (in character string) to order x-axis. For example, "mean(y)" will order the x-axis by the mean of y. Default is NULL, which means keeping the original order of x. Note that when keep_empty is TRUE for x, the empty x levels will always be placed at the end of the x-axis.
- flip
A logical value to flip the plot.
- keep_empty
One of FALSE, TRUE and "level". It can also take a named list to specify different behavior for different columns. Without a named list, the behavior applies to the categorical/character columns used on the plot, for example, the
x,group_by,fill_by, etc.FALSE(default): Drop empty factor levels from the data before plotting.TRUE: Keep empty factor levels and show them as a separate category in the plot."level": Keep empty factor levels, but do not show them in the plot. But they will be assigned colors from the palette to maintain consistency across multiple plots. Alias:levels
- keep_na
A logical value or a character to replace the NA values in the data. It can also take a named list to specify different behavior for different columns. If TRUE or NA, NA values will be replaced with NA. If FALSE, NA values will be removed from the data before plotting. If a character string is provided, NA values will be replaced with the provided string. If a named vector/list is provided, the names should be the column names to apply the behavior to, and the values should be one of TRUE, FALSE, or a character string. Without a named vector/list, the behavior applies to categorical/character columns used on the plot, for example, the
x,group_by,fill_by, etc.- group_by
Columns to group the data for plotting For those plotting functions that do not support multiple groups, They will be concatenated into one column, using
group_by_sepas the separator- group_by_sep
The separator for multiple group_by columns. See
group_by- group_name
A character string to name the legend of dodge.
- paired_by
A character string of the column name identifying paired observations for paired tests.
- x_text_angle
A numeric value specifying the angle of the x-axis text.
- step_increase
A numeric value to specify the step increase in fraction of total height for every additional comparison of the significance labels.
- fill_mode
A character string to specify the fill mode. Either "dodge", "x", "mean", "median".
- palreverse
A logical value indicating whether to reverse the palette. Default is FALSE.
- position_dodge_preserve
Should dodging preserve the "total" width of all elements at a position, or the width of a "single" element?
- theme
A character string or a theme class (i.e. ggplot2::theme_classic) specifying the theme to use. Default is "theme_this".
- theme_args
A list of arguments to pass to the theme function.
- palette
A character string specifying the palette to use. A named list or vector can be used to specify the palettes for different
split_byvalues.- palcolor
A character string specifying the color to use in the palette. A named list can be used to specify the colors for different
split_byvalues. If some values are missing, the values from the palette will be used (palcolor will be NULL for those values).- alpha
A numeric value specifying the transparency of the plot.
- aspect.ratio
A numeric value specifying the aspect ratio of the plot.
- legend.position
A character string specifying the position of the legend. if
waiver(), for single groups, the legend will be "none", otherwise "right".- legend.direction
A character string specifying the direction of the legend.
- add_point
A logical value to add (jitter) points to the plot.
- pt_color
A character string to specify the color of the points.
- pt_size
A numeric value to specify the size of the points.
- pt_alpha
A numeric value to specify the transparency of the points.
- jitter_width
A numeric value to specify the width of the jitter. Defaults to 0.5, but when paired_by is provided, it will be set to 0.
- jitter_height
A numeric value to specify the height of the jitter.
- stack
A logical value whether to stack the facetted plot by 'facet_by'.
- y_max
A numeric value or a character string to specify the maximum value of the y-axis. You can also use quantile notation like "q95" to specify the 95th percentile. When comparisons are set and a numeric y_max is provided, it will be used to set the y-axis limit, including the significance labels.
- y_min
A numeric value or a character string to specify the minimum value of the y-axis. You can also use quantile notation like "q5" to specify the 5th percentile.
- add_beeswarm
A logical value to add beeswarm points to the plot instead of jittered points. When TRUE, points are positioned using the beeswarm algorithm to avoid overlap while showing density. Requires the ggbeeswarm package to be installed.
- beeswarm_method
A character string to specify the beeswarm method. Either "swarm", "compactswarm", "hex", "square", or "center". Default is "swarm". See ggbeeswarm::geom_beeswarm for details.
- beeswarm_cex
A numeric value to specify the scaling for adjusting point spacing in beeswarm. Default is 1. Larger values space out points more.
- beeswarm_priority
A character string to specify point layout priority. Either "ascending", "descending", "density", or "random". Default is "ascending".
- beeswarm_dodge
A numeric value to specify the dodge width for beeswarm points when group_by is provided. Default is 0.9
- add_trend
A logical value to add trend line to the plot.
- trend_color
A character string to specify the color of the trend line. This won't work when
group_byis specified, the trend line will be colored by thegroup_byvariable.#'- trend_linewidth
A numeric value to specify the width of the trend line.
- trend_ptsize
A numeric value to specify the size of the trend line points.
- add_stat
A character string to add statistical test to the plot.
- stat_name
A character string to specify the name of the stat legend.
- stat_color
A character string to specify the color of the statistical test.
- stat_size
A numeric value to specify the size of the statistical test.
- stat_stroke
A numeric value to specify the stroke of the statistical test.
- stat_shape
A numeric value to specify the shape of the statistical test.
- add_errorbar
A character string to specify the type of error bars to add to bar plots. Only available when
base = "bar". Case insensitive. Available options are:"SEM" (default): Standard error of the mean.
"SD": Standard deviation.
"CI" or "CIXX" (e.g., "CI95"): Confidence interval. "CI" defaults to "CI95" (95\
"none": No error bars.
- errorbar_color
A character string to specify the color of the error bars. Default is "black".
- errorbar_width
A numeric value to specify the width of the error bar caps. Default is 0.5.
- errorbar_linewidth
A numeric value to specify the line width of the error bars. Default is 0.75.
- add_bg
A logical value to add background to the plot.
- bg_palette
A character string to specify the palette of the background.
- bg_palcolor
A character vector to specify the colors of the background.
- bg_alpha
A numeric value to specify the transparency of the background.
- add_line
A character string to add a line to the plot.
- line_color
A character string to specify the color of the line.
- line_width
A numeric value to specify the size of the line.
- line_type
A numeric value to specify the type of the line.
- highlight
A vector of character strings to highlight the points. It should be a subset of the row names of the data. If TRUE, it will highlight all points.
- highlight_color
A character string to specify the color of the highlighted points.
- highlight_size
A numeric value to specify the size of the highlighted points.
- highlight_alpha
A numeric value to specify the transparency of the highlighted points.
- comparisons
A logical value or a list of vectors to perform pairwise comparisons. If
TRUE, it will perform pairwise comparisons for all pairs.- ref_group
A character string to specify the reference group for comparisons.
- pairwise_method
A character string to specify the pairwise comparison method.
- multiplegroup_comparisons
A logical value to perform multiple group comparisons.
- multiple_method
A character string to specify the multiple group comparison method.
- sig_label
A character string to specify the label of the significance test. For multiple group comparisons (
multiplegroup_comparisons = TRUE), it must be either "p.format" or "p.signif". For pairwise comparisons, it can be:the column containing the label (e.g.: label = "p" or label = "p.adj"), where p is the p-value. Other possible values are "p.signif", "p.adj.signif", "p.format", "p.adj.format".
an expression that can be formatted by the glue() package. For example, when specifying
label = "Wilcoxon, p = {p}", the expression{p}will be replaced by its value.a combination of plotmath expressions and glue expressions. You may want some of the statistical parameter in italic; for example:
label = "Wilcoxon, p= {p}"See https://rpkgs.datanovia.com/ggpubr/reference/geom_pwc.html for more details.
- sig_labelsize
A numeric value to specify the size of the significance test label.
- hide_ns
A logical value to hide the non-significant comparisons.
- facet_by
A character string specifying the column name of the data frame to facet the plot. Otherwise, the data will be split by
split_byand generate multiple plots and combine them into one usingpatchwork::wrap_plots- facet_scales
Whether to scale the axes of facets. Default is "fixed" Other options are "free", "free_x", "free_y". See
ggplot2::facet_wrap- facet_ncol
A numeric value specifying the number of columns in the facet. When facet_by is a single column and facet_wrap is used.
- facet_nrow
A numeric value specifying the number of rows in the facet. When facet_by is a single column and facet_wrap is used.
- facet_byrow
A logical value indicating whether to fill the plots by row. Default is TRUE.
- title
A character string specifying the title of the plot. A function can be used to generate the title based on the default title. This is useful when split_by is used and the title needs to be dynamic.
- subtitle
A character string specifying the subtitle of the plot.
- xlab
A character string specifying the x-axis label.
- ylab
A character string specifying the y-axis label.
- seed
The random seed to use. Default is 8525.
- combine
Whether to combine the plots into one when facet is FALSE. Default is TRUE.
- nrow
A numeric value specifying the number of rows in the facet.
- ncol
A numeric value specifying the number of columns in the facet.
- byrow
A logical value indicating whether to fill the plots by row.
- axes
A string specifying how axes should be treated. Passed to
patchwork::wrap_plots(). Only relevant whensplit_byis used andcombineis TRUE. Options are:'keep' will retain all axes in individual plots.
'collect' will remove duplicated axes when placed in the same run of rows or columns of the layout.
'collect_x' and 'collect_y' will remove duplicated x-axes in the columns or duplicated y-axes in the rows respectively.
- axis_titles
A string specifying how axis titltes should be treated. Passed to
patchwork::wrap_plots(). Only relevant whensplit_byis used andcombineis TRUE. Options are:'keep' will retain all axis titles in individual plots.
'collect' will remove duplicated titles in one direction and merge titles in the opposite direction.
'collect_x' and 'collect_y' control this for x-axis titles and y-axis titles respectively.
- guides
A string specifying how guides should be treated in the layout. Passed to
patchwork::wrap_plots(). Only relevant whensplit_byis used andcombineis TRUE. Options are:'collect' will collect guides below to the given nesting level, removing duplicates.
'keep' will stop collection at this level and let guides be placed alongside their plot.
'auto' will allow guides to be collected if a upper level tries, but place them alongside the plot if not.
- ...
Additional arguments.
- add_box
A logical value to add box plot to the plot.
- box_color
A character string to specify the color of the box plot.
- box_width
A numeric value to specify the width of the box plot.
- box_ptsize
A numeric value to specify the size of the box plot points in the middle.
- add_violin
Logical, whether to add violin plot behind the beeswarm points. Adding violin to a beeswarm plot is actually not supported. A message will be shown to remind users to use
ViolinPlot(..., add_beeswarm = TRUE)instead.
Value
The Box / Violin plot(s).
When split_by is not provided, it returns a ggplot object.
When split_by is provided, it returns a object of plots wrapped by patchwork::wrap_plots if combine = TRUE;
otherwise, it returns a list of ggplot objects.
Examples
# \donttest{
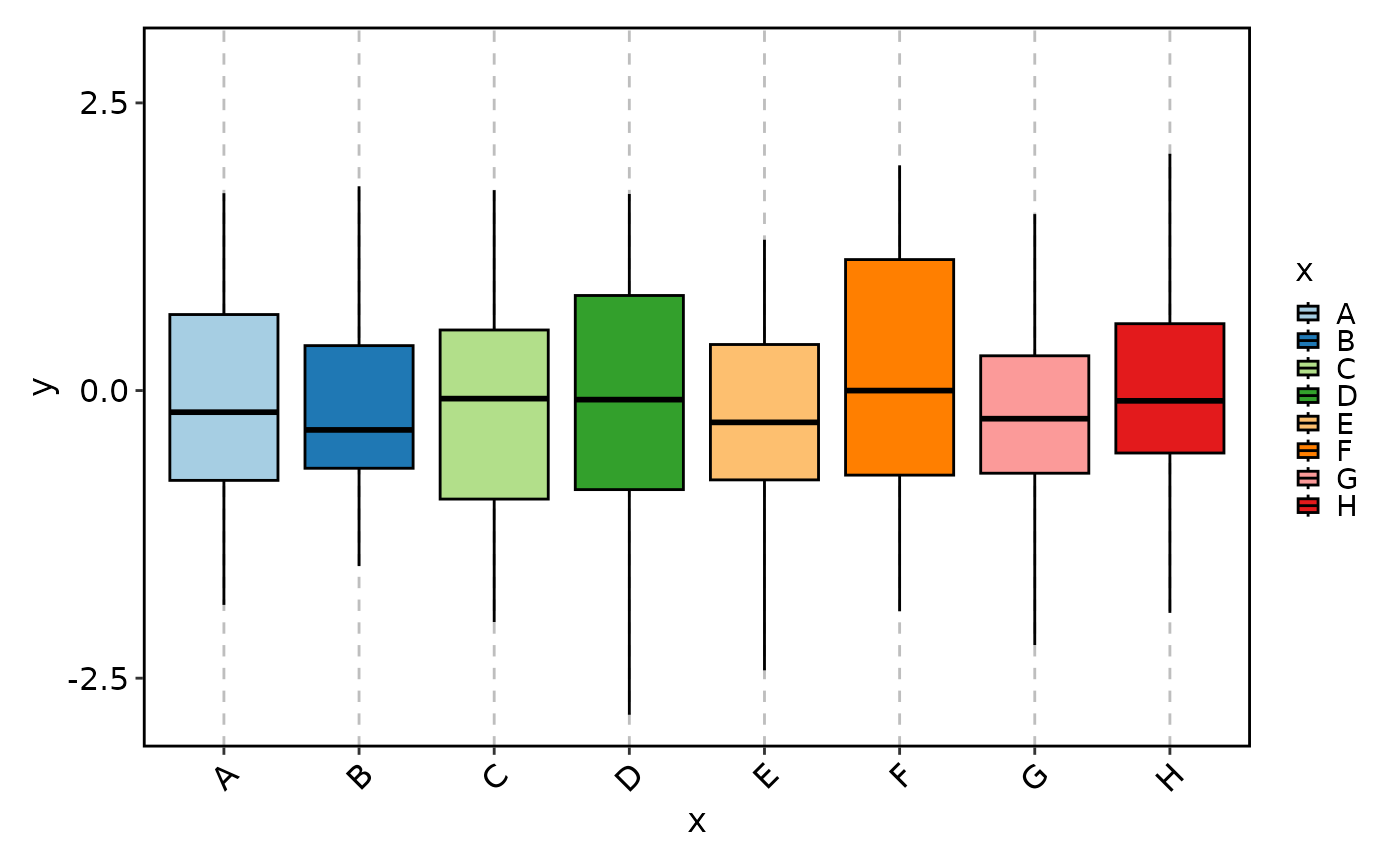
set.seed(8525)
data <- data.frame(
x = rep(LETTERS[1:8], each = 40),
y = c(rnorm(160), rnorm(160, mean = 1)),
group1 = sample(c("g1", "g2"), 320, replace = TRUE),
group2 = sample(c("h1", "h2", "h3", "h4"), 320, replace = TRUE)
)
BoxPlot(data, x = "x", y = "y")
 BoxPlot(data, x = "x", y = "y", add_beeswarm = TRUE, pt_color = "grey30")
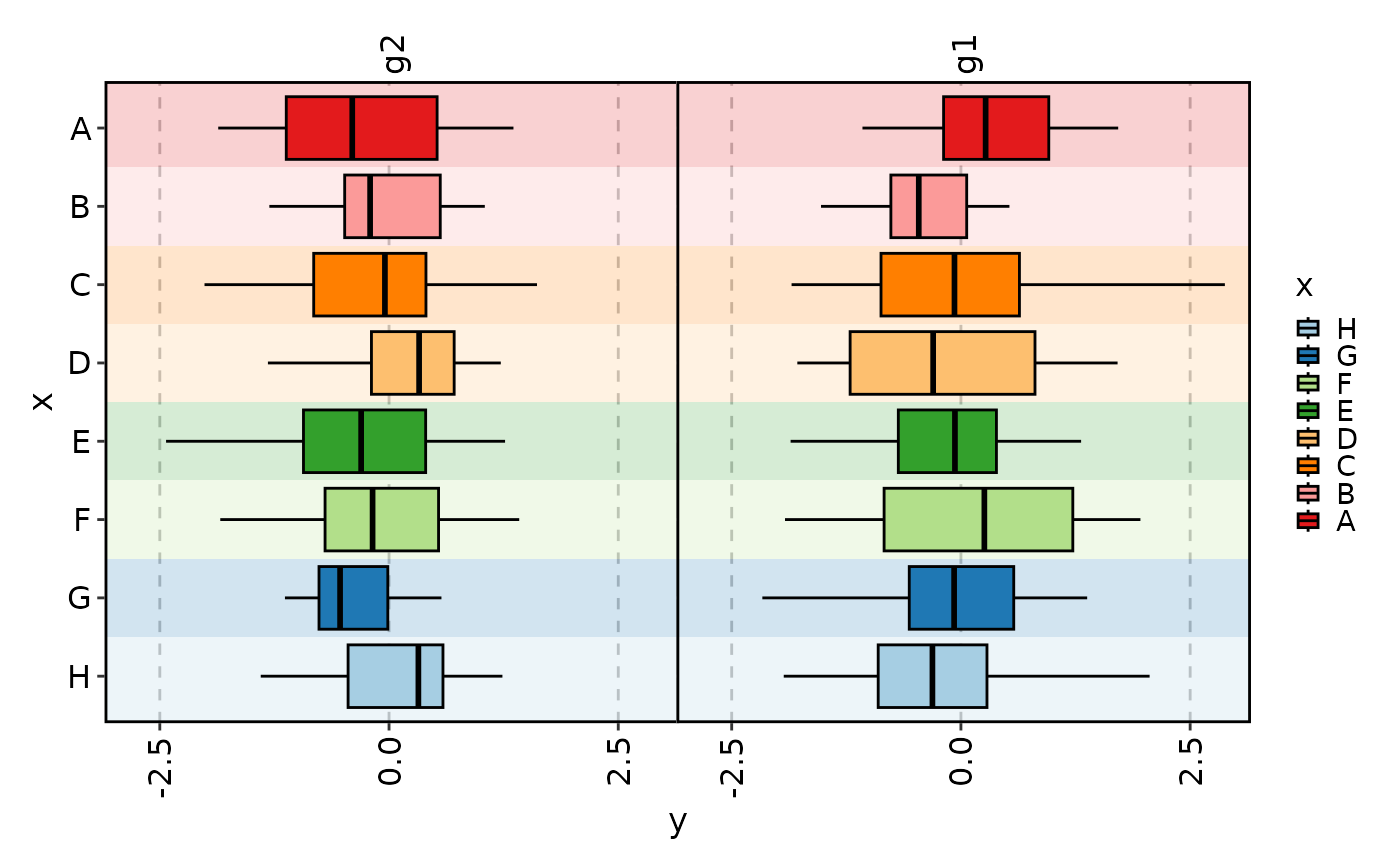 BoxPlot(data,
x = "x", y = "y",
stack = TRUE, flip = TRUE, facet_by = "group1",
add_bg = TRUE, bg_palette = "Paired"
)
BoxPlot(data,
x = "x", y = "y",
stack = TRUE, flip = TRUE, facet_by = "group1",
add_bg = TRUE, bg_palette = "Paired"
)
 BoxPlot(data,
x = "x", y = "y",
stack = TRUE, flip = TRUE, split_by = "group1",
add_bg = TRUE, bg_palette = "Paired",
palcolor = list(g1 = c("red", "blue"), g2 = c("blue", "red"))
)
BoxPlot(data,
x = "x", y = "y",
stack = TRUE, flip = TRUE, split_by = "group1",
add_bg = TRUE, bg_palette = "Paired",
palcolor = list(g1 = c("red", "blue"), g2 = c("blue", "red"))
)
 # sort_x
data <- data.frame(
x = factor(rep(LETTERS[1:5], each = 40),
levels = c(LETTERS[1:2], "unused", LETTERS[3:5])),
y = c(rnorm(40, mean = 5), rnorm(40, mean = 4), rnorm(40, mean = 3),
rnorm(40, mean = 2), rnorm(40, mean = 1))
)
BoxPlot(data, x = "x", y = "y", sort_x = "mean(y)", keep_empty = TRUE)
# sort_x
data <- data.frame(
x = factor(rep(LETTERS[1:5], each = 40),
levels = c(LETTERS[1:2], "unused", LETTERS[3:5])),
y = c(rnorm(40, mean = 5), rnorm(40, mean = 4), rnorm(40, mean = 3),
rnorm(40, mean = 2), rnorm(40, mean = 1))
)
BoxPlot(data, x = "x", y = "y", sort_x = "mean(y)", keep_empty = TRUE)
 BoxPlot(data, x = "x", y = "y", sort_x = "mean(-y)", keep_empty = TRUE)
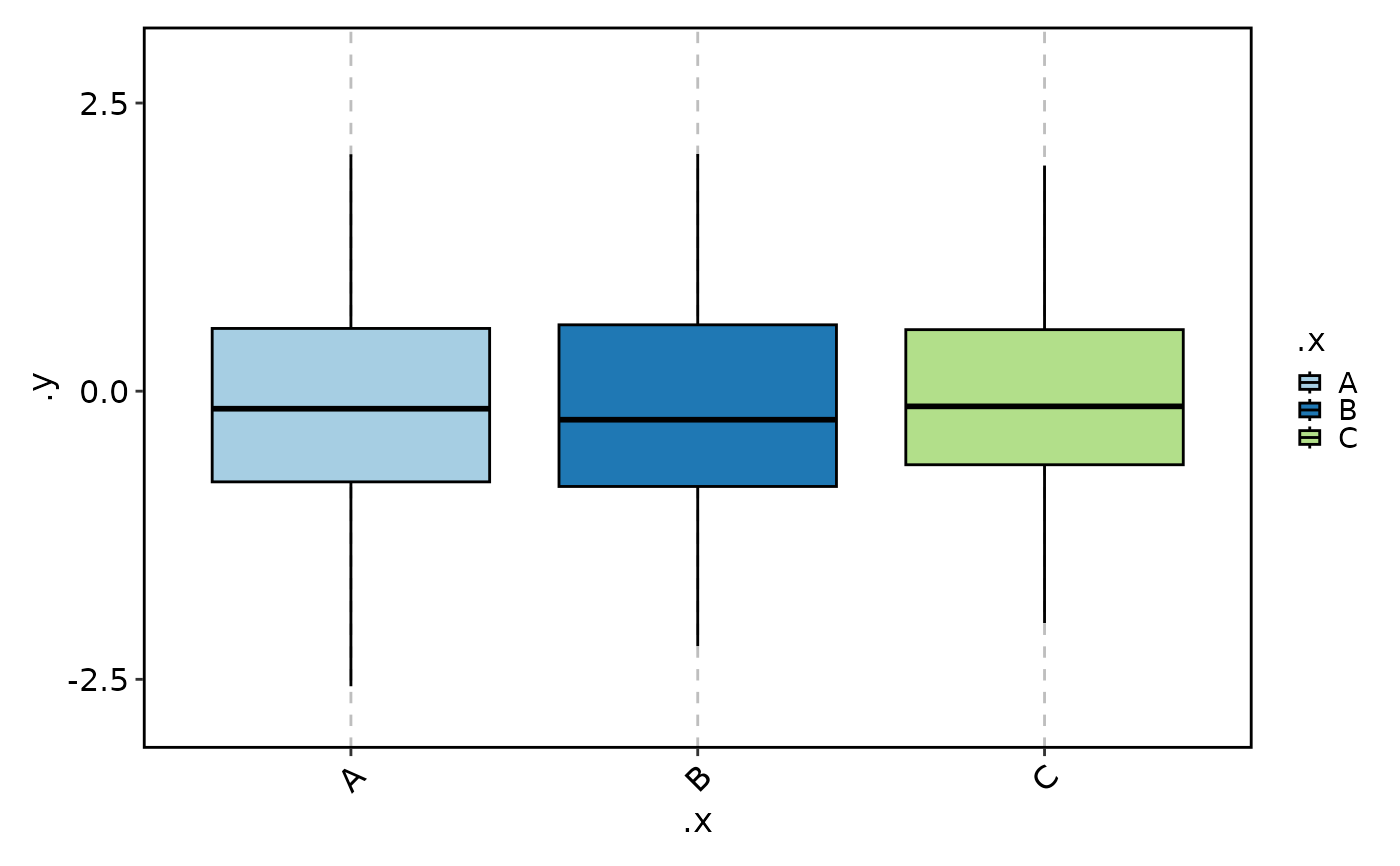
 # wide form data
data_wide <- data.frame(
A = rnorm(100),
B = rnorm(100),
C = rnorm(100)
)
BoxPlot(data_wide, x = c("A", "B", "C"), in_form = "wide")
# wide form data
data_wide <- data.frame(
A = rnorm(100),
B = rnorm(100),
C = rnorm(100)
)
BoxPlot(data_wide, x = c("A", "B", "C"), in_form = "wide")
 paired_data <- data.frame(
subject = rep(paste0("s", 1:10), each = 2),
visit = rep(c("pre", "post"), times = 10),
value = rnorm(20)
)
# paired plot with connected lines and paired test
BoxPlot(
paired_data,
x = "visit", y = "value", comparisons = TRUE,
paired_by = "subject", add_point = TRUE
)
paired_data <- data.frame(
subject = rep(paste0("s", 1:10), each = 2),
visit = rep(c("pre", "post"), times = 10),
value = rnorm(20)
)
# paired plot with connected lines and paired test
BoxPlot(
paired_data,
x = "visit", y = "value", comparisons = TRUE,
paired_by = "subject", add_point = TRUE
)
 paired_group_data <- data.frame(
subject = rep(paste0("s", 1:6), each = 2),
x = rep(c("A", "B"), each = 6),
group = rep(c("before", "after"), times = 6),
value = rnorm(12)
)
BoxPlot(
paired_group_data,
x = "x", y = "value",
paired_by = "subject", group_by = "group",
comparisons = TRUE, pt_size = 3, pt_color = "red"
)
#> Warning: Forcing 'add_point' = TRUE when 'paired_by' is provided.
#> Warning: [Box/Violin/BeeswarmPlot] Some pairwise comparisons may fail due to insufficient data points or variability. Adjusting data to ensure valid comparisons.
paired_group_data <- data.frame(
subject = rep(paste0("s", 1:6), each = 2),
x = rep(c("A", "B"), each = 6),
group = rep(c("before", "after"), times = 6),
value = rnorm(12)
)
BoxPlot(
paired_group_data,
x = "x", y = "value",
paired_by = "subject", group_by = "group",
comparisons = TRUE, pt_size = 3, pt_color = "red"
)
#> Warning: Forcing 'add_point' = TRUE when 'paired_by' is provided.
#> Warning: [Box/Violin/BeeswarmPlot] Some pairwise comparisons may fail due to insufficient data points or variability. Adjusting data to ensure valid comparisons.
 # keep_na and keep_empty example
data <- data.frame(
x = factor(rep(c(LETTERS[1:3], NA, LETTERS[5:8]), each = 40),
levels = c(LETTERS[1:8])),
y = c(rnorm(160), rnorm(160, mean = 1)),
group1 = sample(c("g1", "g2"), 320, replace = TRUE),
group2 = factor(sample(c("h1", NA, "h3", "h4"), 320, replace = TRUE),
levels = c("h1", "h2", "h3", "h4"))
)
BoxPlot(data, x = "x", y = "y",
title = "keep_na = FALSE; keep_empty = FALSE")
# keep_na and keep_empty example
data <- data.frame(
x = factor(rep(c(LETTERS[1:3], NA, LETTERS[5:8]), each = 40),
levels = c(LETTERS[1:8])),
y = c(rnorm(160), rnorm(160, mean = 1)),
group1 = sample(c("g1", "g2"), 320, replace = TRUE),
group2 = factor(sample(c("h1", NA, "h3", "h4"), 320, replace = TRUE),
levels = c("h1", "h2", "h3", "h4"))
)
BoxPlot(data, x = "x", y = "y",
title = "keep_na = FALSE; keep_empty = FALSE")
 BoxPlot(data, x = "x", y = "y", keep_na = TRUE, keep_empty = TRUE,
title = "keep_na = TRUE; keep_empty = TRUE")
BoxPlot(data, x = "x", y = "y", keep_na = TRUE, keep_empty = TRUE,
title = "keep_na = TRUE; keep_empty = TRUE")
 BoxPlot(data, x = "x", y = "y", keep_na = TRUE, keep_empty = TRUE,
title = "keep_na = TRUE; keep_empty = TRUE", facet_by = "group2")
BoxPlot(data, x = "x", y = "y", keep_na = TRUE, keep_empty = TRUE,
title = "keep_na = TRUE; keep_empty = TRUE", facet_by = "group2")
 BoxPlot(data, x = "x", y = "y", keep_na = TRUE, keep_empty = 'level',
title = "keep_na = TRUE; keep_empty = 'level'")
BoxPlot(data, x = "x", y = "y", keep_na = TRUE, keep_empty = 'level',
title = "keep_na = TRUE; keep_empty = 'level'")
 BoxPlot(data, x = "x", y = "y", group_by = "group2",
title = "keep_na = FALSE; keep_empty = FALSE; group_by = 'group2'")
BoxPlot(data, x = "x", y = "y", group_by = "group2",
title = "keep_na = FALSE; keep_empty = FALSE; group_by = 'group2'")
 BoxPlot(data, x = "x", y = "y", group_by = "group2",
keep_na = TRUE, keep_empty = TRUE,
title = "keep_na = TRUE; keep_empty = TRUE; group_by = 'group2'")
BoxPlot(data, x = "x", y = "y", group_by = "group2",
keep_na = TRUE, keep_empty = TRUE,
title = "keep_na = TRUE; keep_empty = TRUE; group_by = 'group2'")
 BoxPlot(data, x = "x", y = "y", group_by = "group2",
keep_na = TRUE, keep_empty = 'level',
title = "keep_na = TRUE; keep_empty = 'level'; group_by = 'group2'")
BoxPlot(data, x = "x", y = "y", group_by = "group2",
keep_na = TRUE, keep_empty = 'level',
title = "keep_na = TRUE; keep_empty = 'level'; group_by = 'group2'")
 BoxPlot(data, x = "x", y = "y", group_by = "group2",
keep_na = list(x = TRUE, group2 = FALSE),
keep_empty = list(x = FALSE, group2 = TRUE),
title = "keep_na: x=TRUE, group2=FALSE\nkeep_empty: x=FALSE, group2=TRUE"
)
BoxPlot(data, x = "x", y = "y", group_by = "group2",
keep_na = list(x = TRUE, group2 = FALSE),
keep_empty = list(x = FALSE, group2 = TRUE),
title = "keep_na: x=TRUE, group2=FALSE\nkeep_empty: x=FALSE, group2=TRUE"
)
 BoxPlot(data, x = "x", y = "y", group_by = "group2",
keep_na = list(x = FALSE, group2 = TRUE),
keep_empty = list(x = TRUE, group2 = FALSE),
title = "keep_na: x=FALSE, group2=TRUE\nkeep_empty: x=TRUE, group2=FALSE"
)
BoxPlot(data, x = "x", y = "y", group_by = "group2",
keep_na = list(x = FALSE, group2 = TRUE),
keep_empty = list(x = TRUE, group2 = FALSE),
title = "keep_na: x=FALSE, group2=TRUE\nkeep_empty: x=TRUE, group2=FALSE"
)
 # Bar plot (base = "bar") shows mean values with error bars
data$y <- abs(data$y) # make y values positive for better bar plot visualization
BoxPlot(data, x = "x", y = "y", base = "bar")
# Bar plot (base = "bar") shows mean values with error bars
data$y <- abs(data$y) # make y values positive for better bar plot visualization
BoxPlot(data, x = "x", y = "y", base = "bar")
 BoxPlot(data, x = "x", y = "y", base = "bar", add_errorbar = "SD")
 BoxPlot(data, x = "x", y = "y", base = "bar", add_errorbar = "CI95")
 BoxPlot(data, x = "x", y = "y", base = "bar", add_errorbar = "none")
 BoxPlot(data, x = "x", y = "y", base = "bar", group_by = "group1")
 BoxPlot(data, x = "x", y = "y", base = "bar", add_point = TRUE)
 BoxPlot(data, x = "x", y = "y", base = "bar",
fill_mode = "mean", palette = "Blues")
BoxPlot(data, x = "x", y = "y", base = "bar",
fill_mode = "mean", palette = "Blues")
 # }
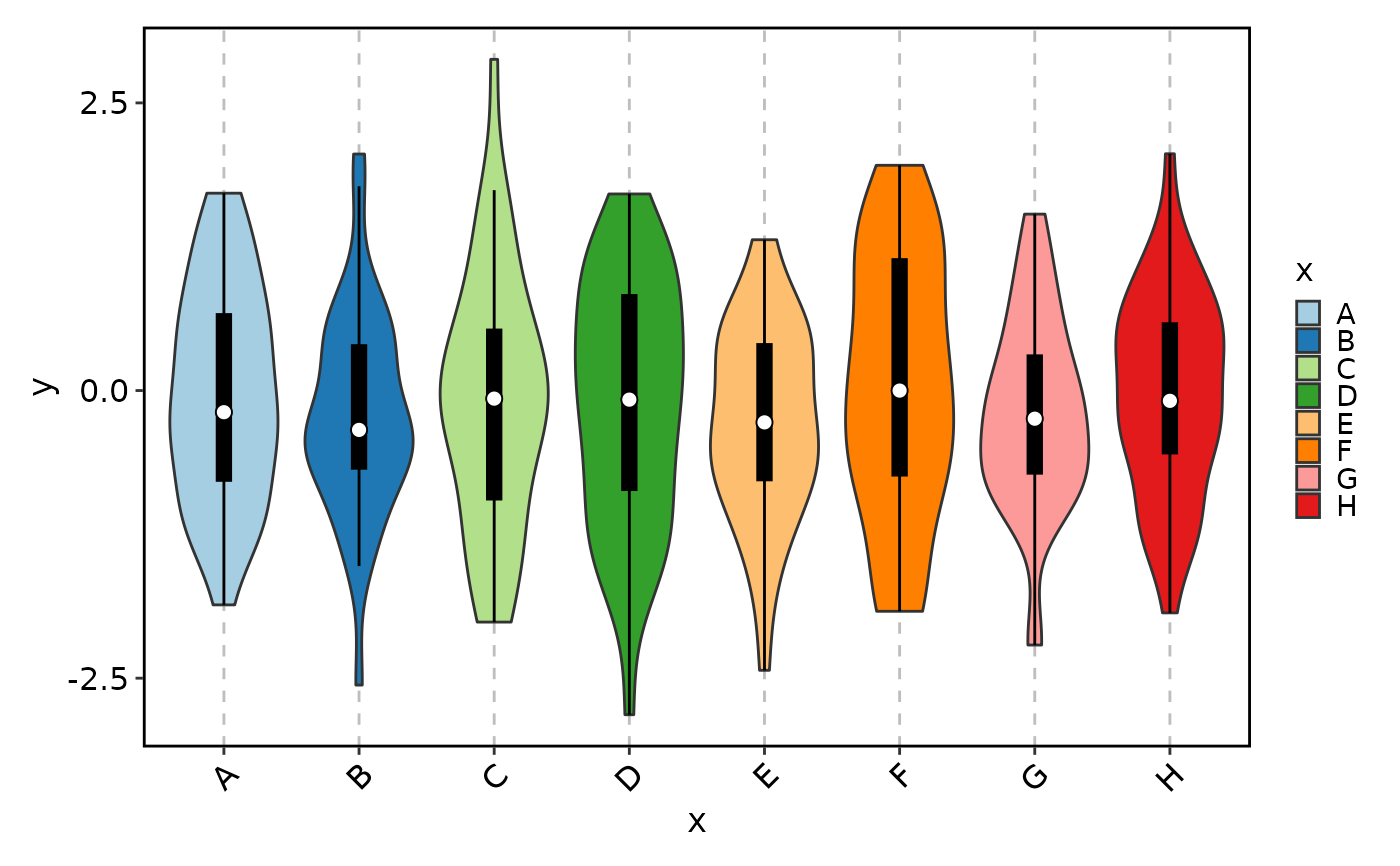
# \donttest{
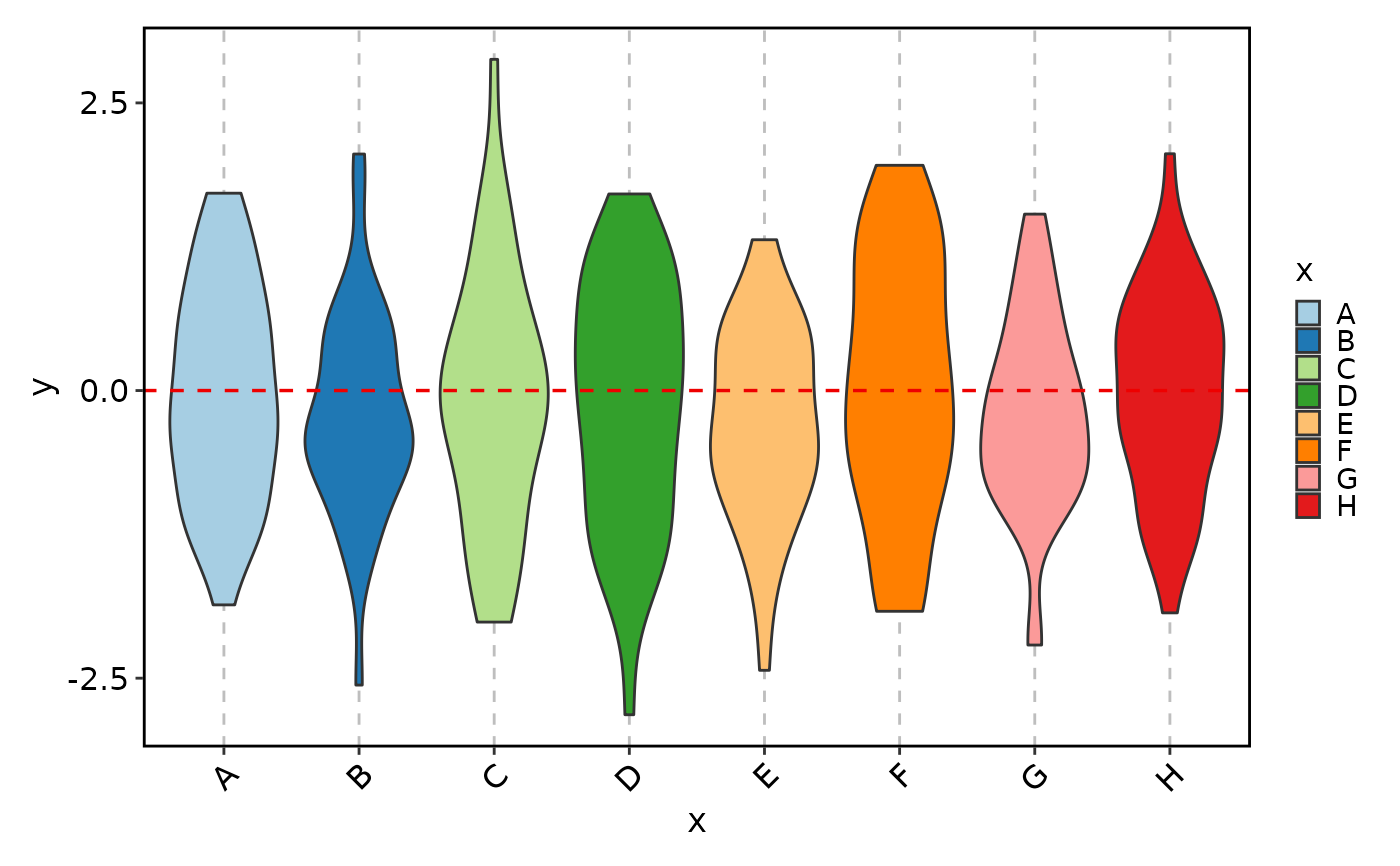
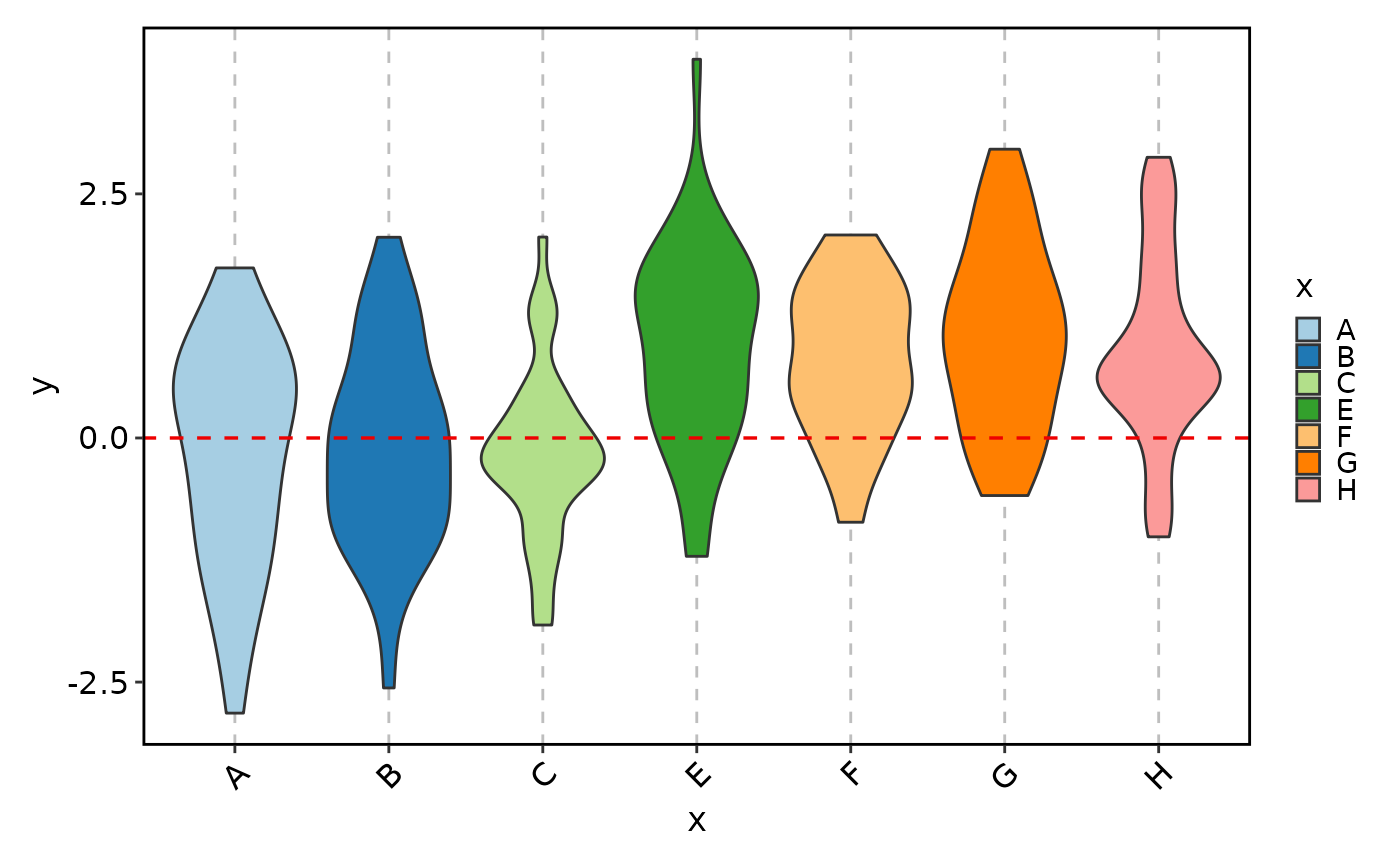
ViolinPlot(data, x = "x", y = "y")
# }
# \donttest{
ViolinPlot(data, x = "x", y = "y")
 ViolinPlot(data, x = "x", y = "y", add_beeswarm = TRUE, pt_color = "grey30")
 ViolinPlot(data, x = "x", y = "y", add_box = TRUE)
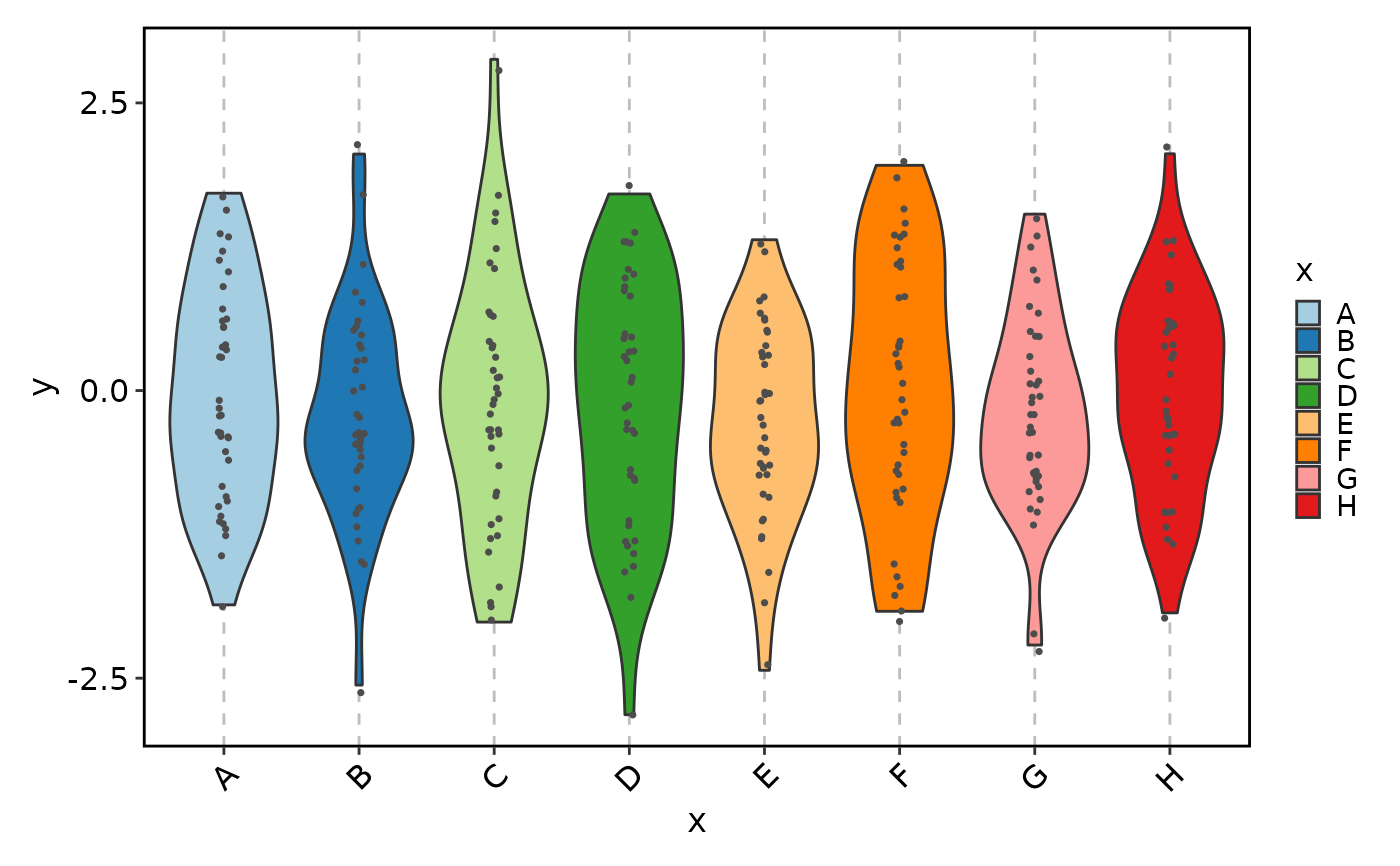
 ViolinPlot(data, x = "x", y = "y", add_point = TRUE)
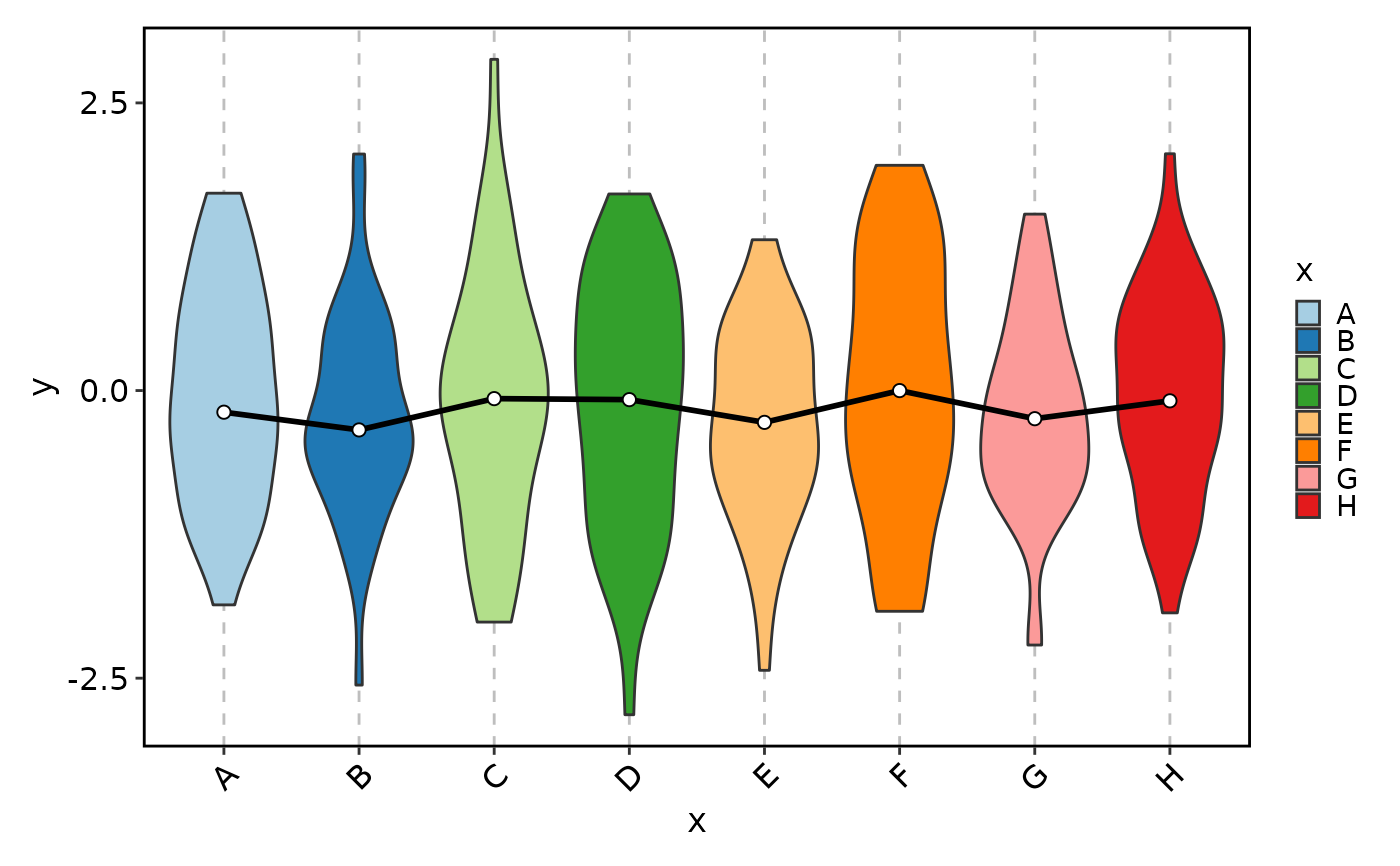
 ViolinPlot(data, x = "x", y = "y", add_trend = TRUE)
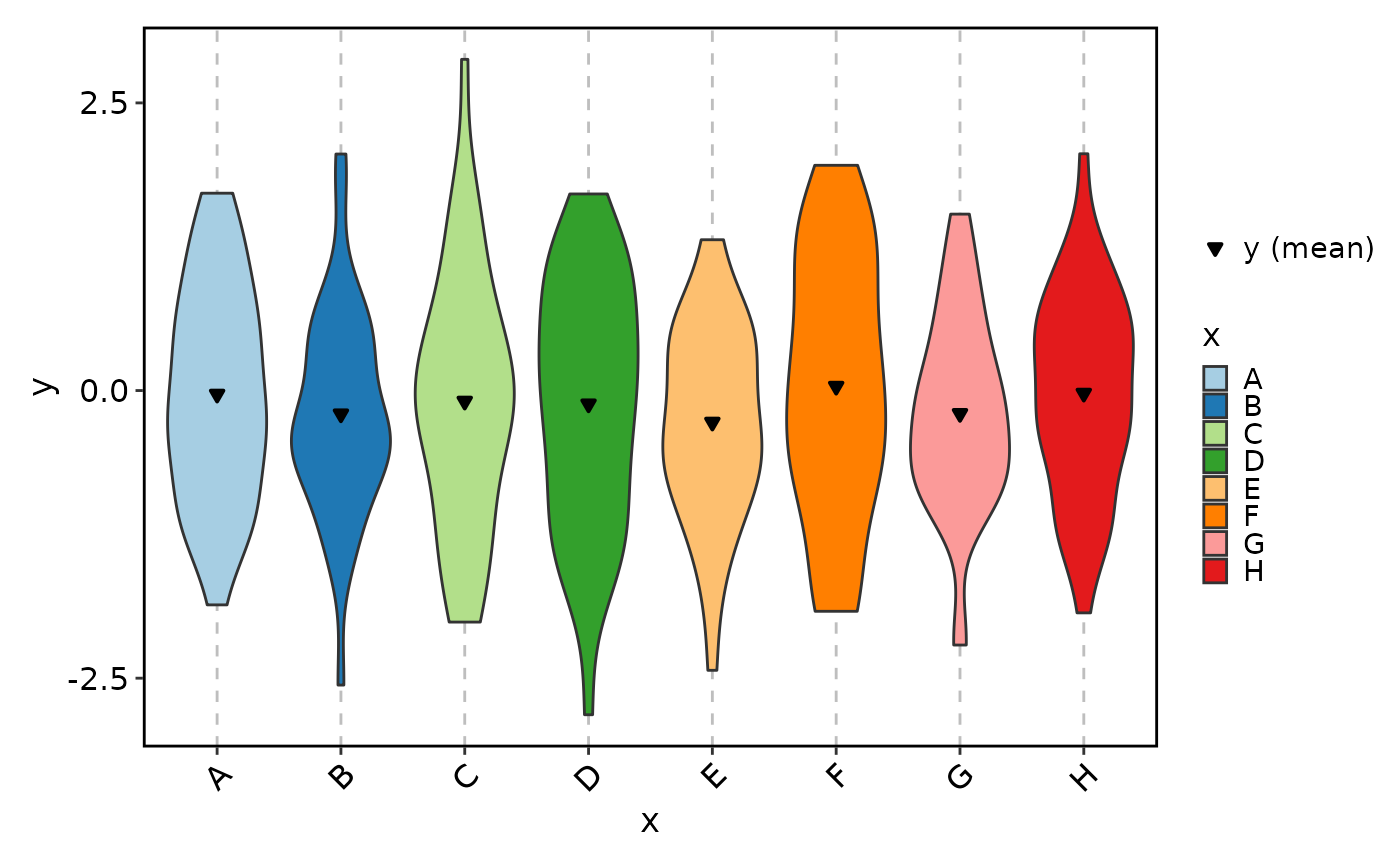
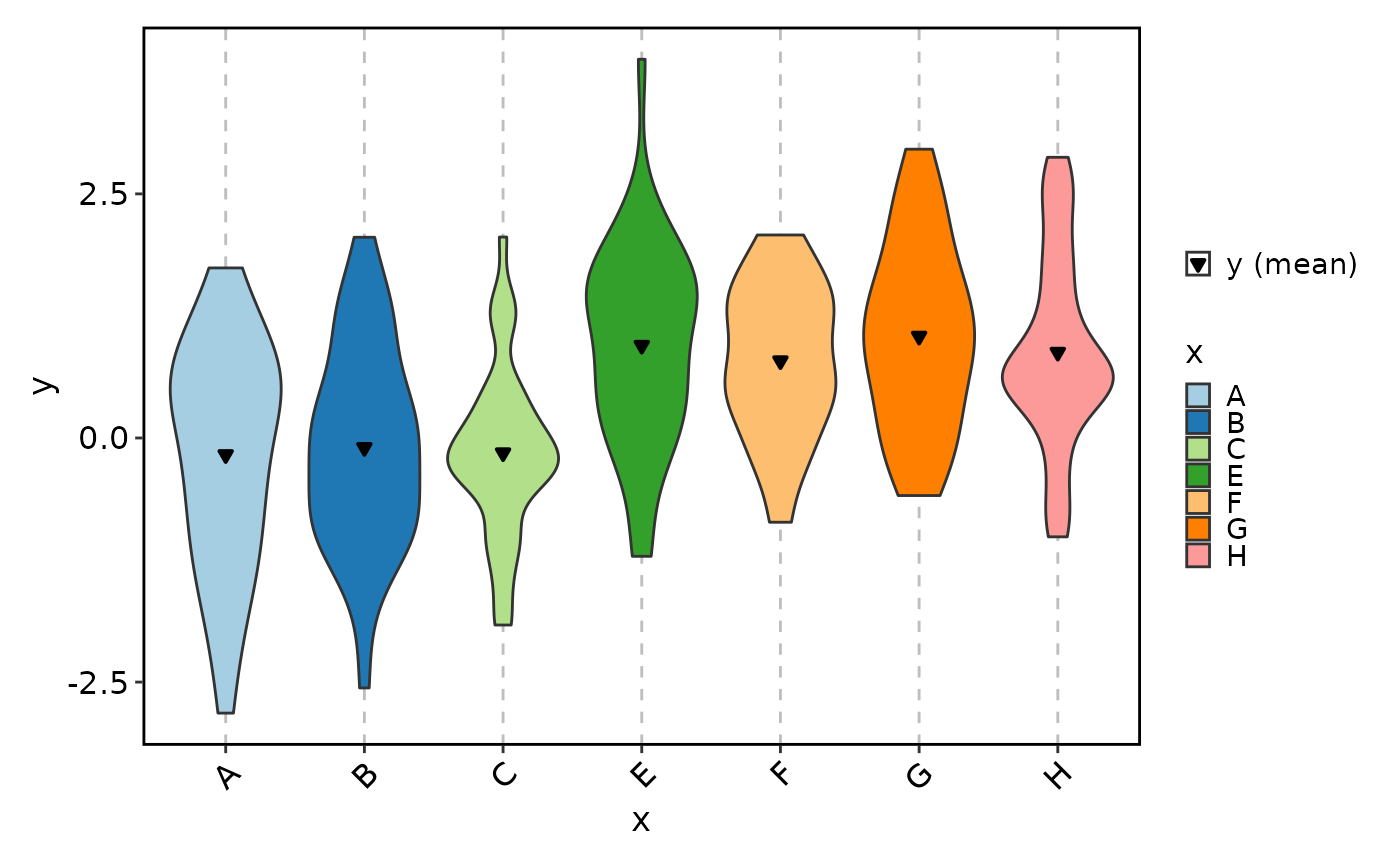
 ViolinPlot(data, x = "x", y = "y", add_stat = mean)
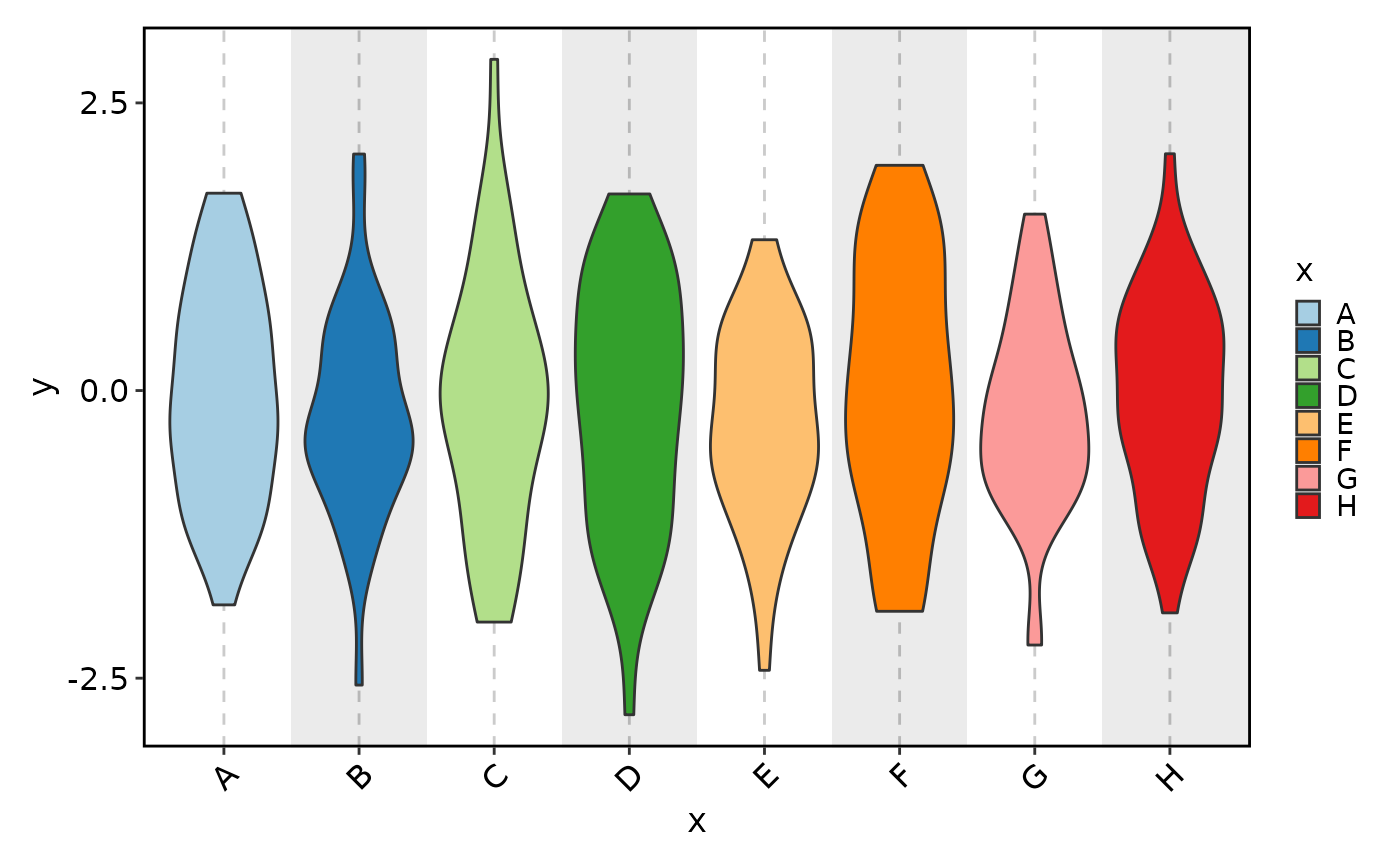
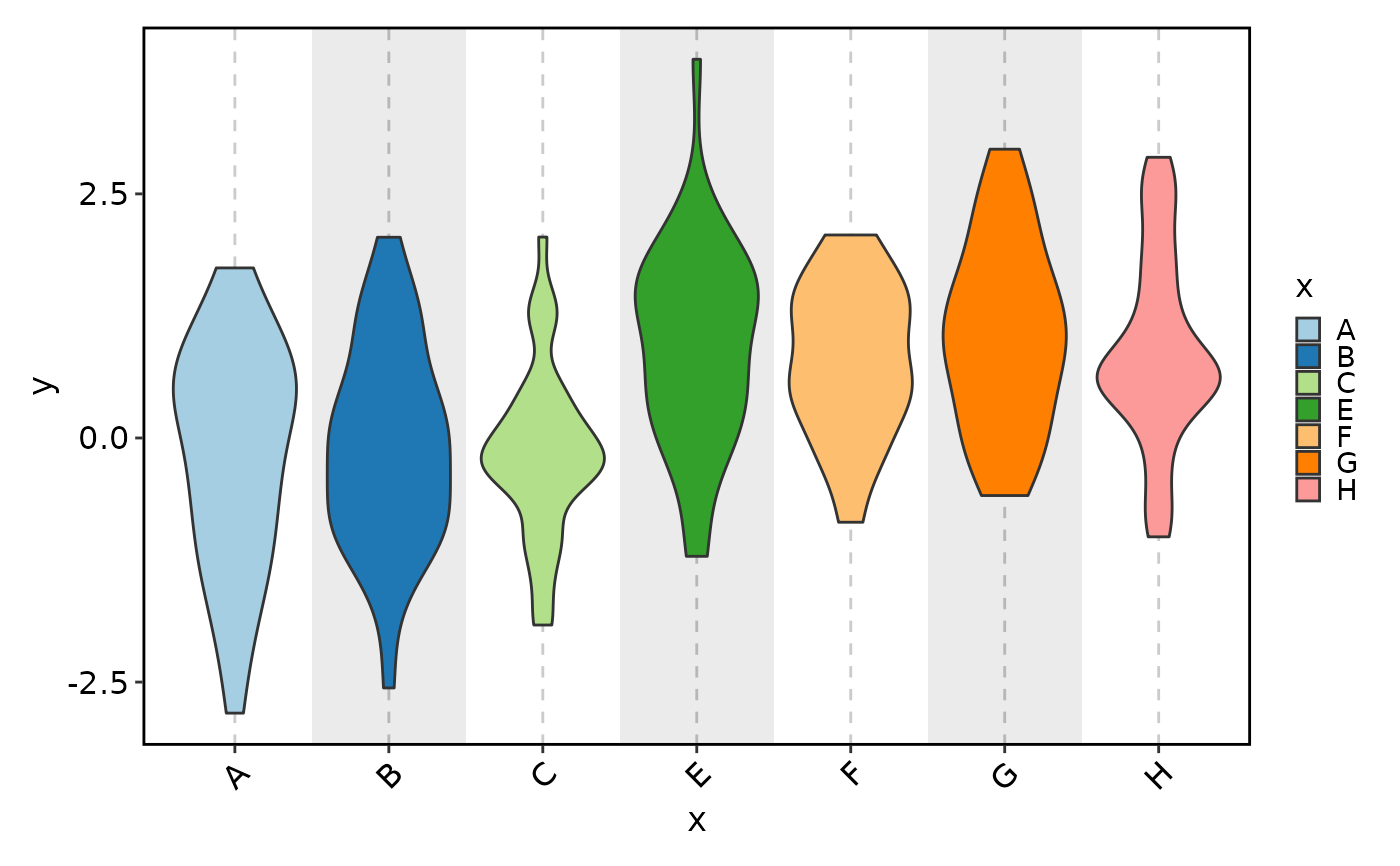
 ViolinPlot(data, x = "x", y = "y", add_bg = TRUE)
 ViolinPlot(data, x = "x", y = "y", add_line = 0)
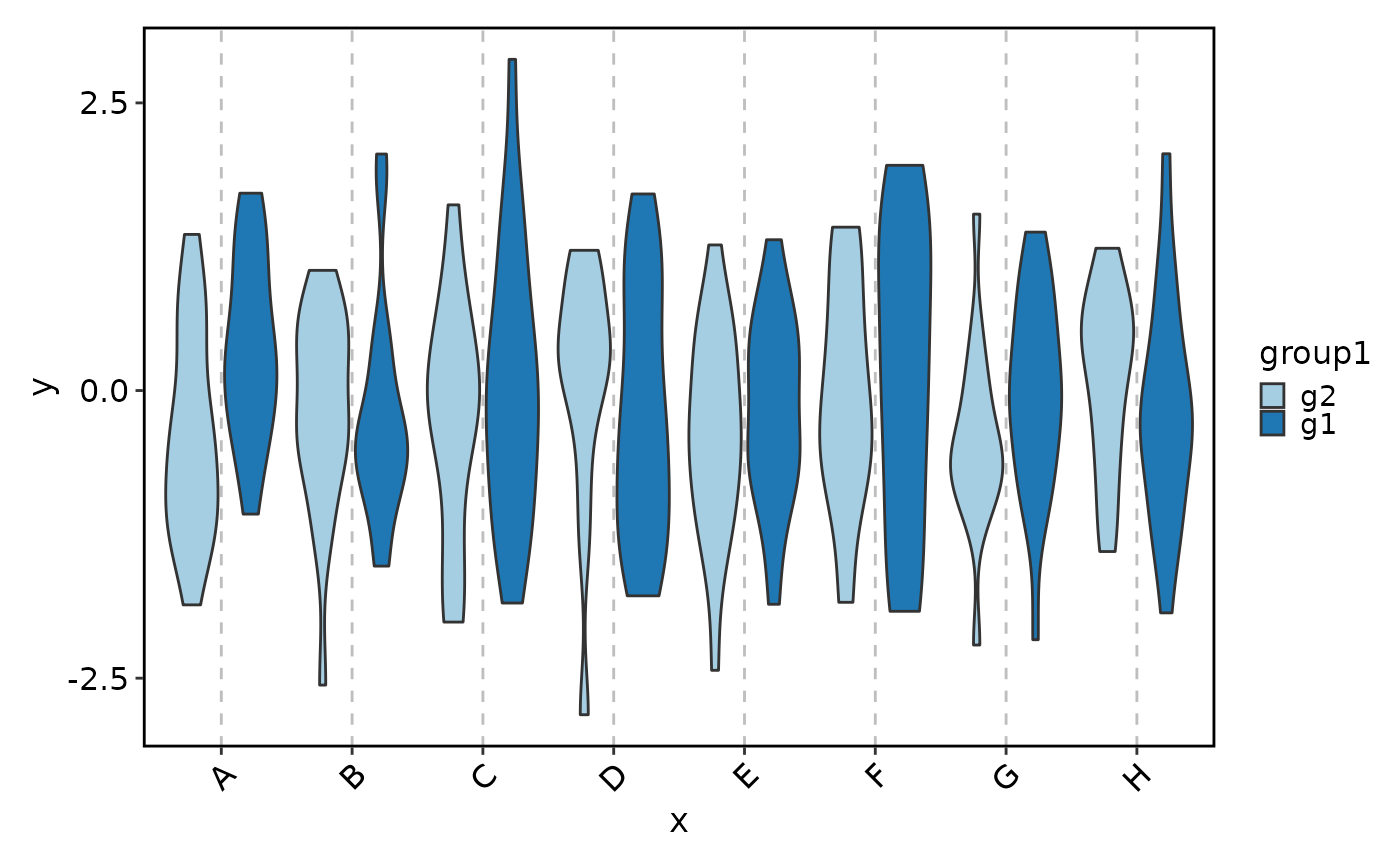
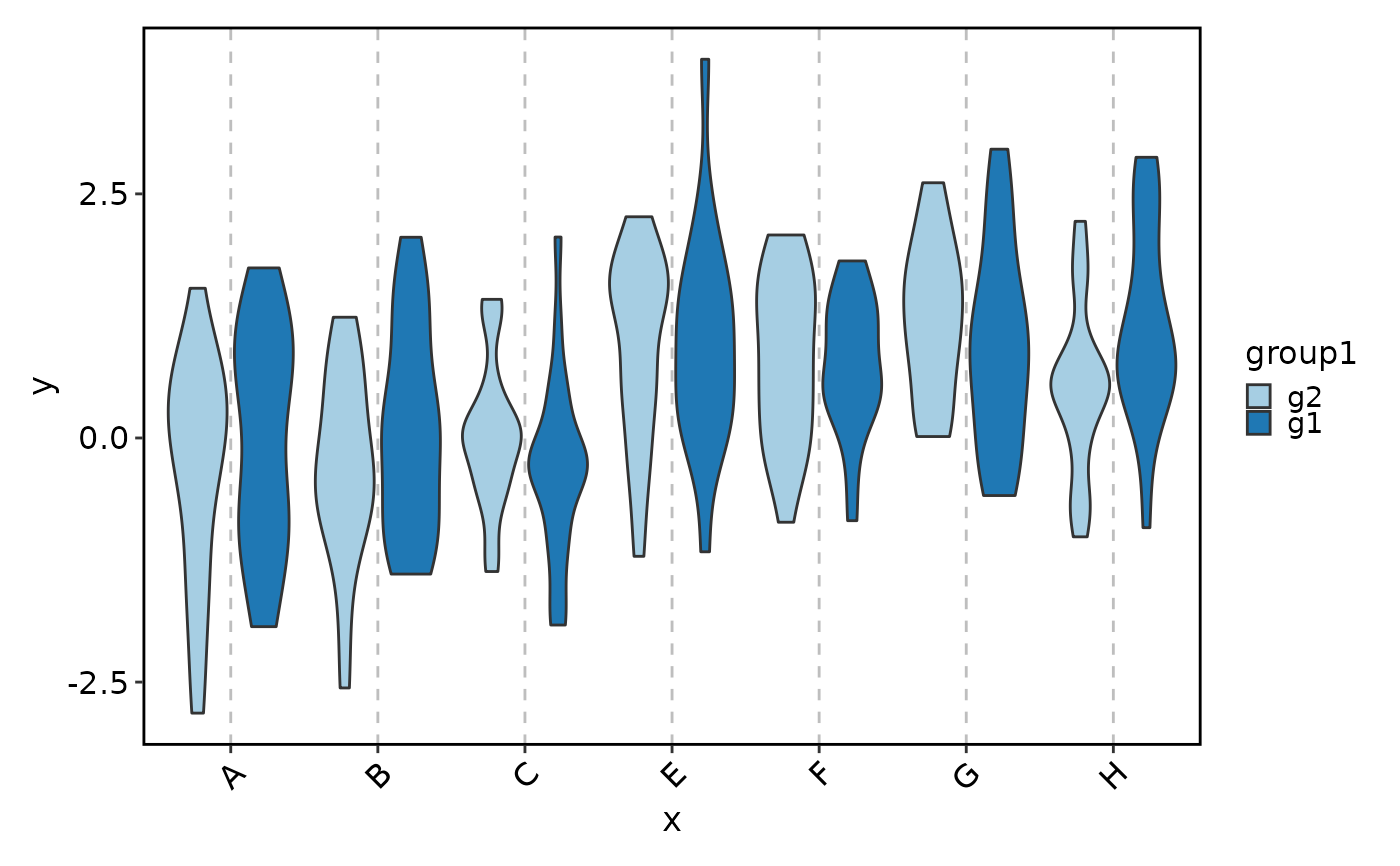
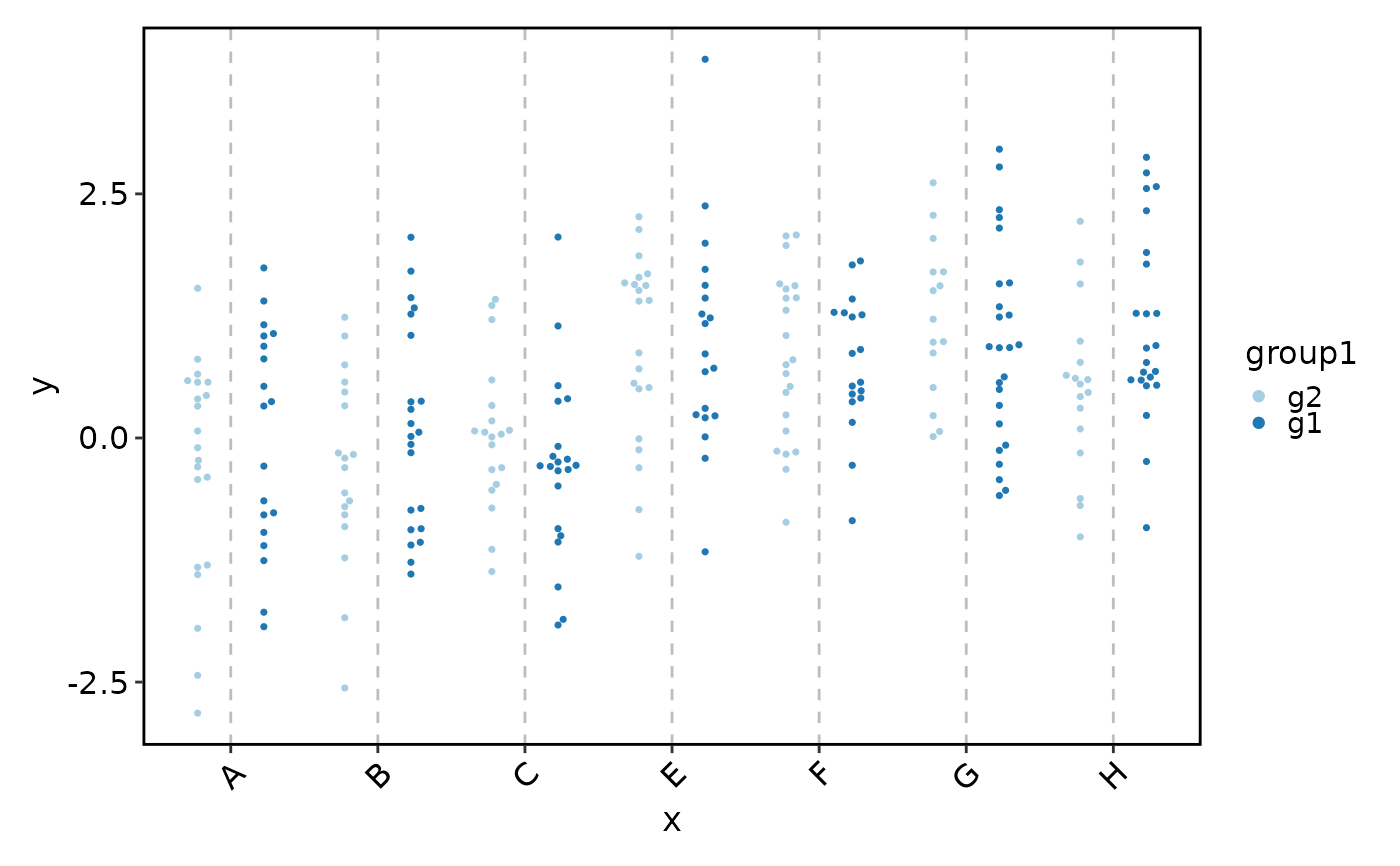
 ViolinPlot(data, x = "x", y = "y", group_by = "group1")
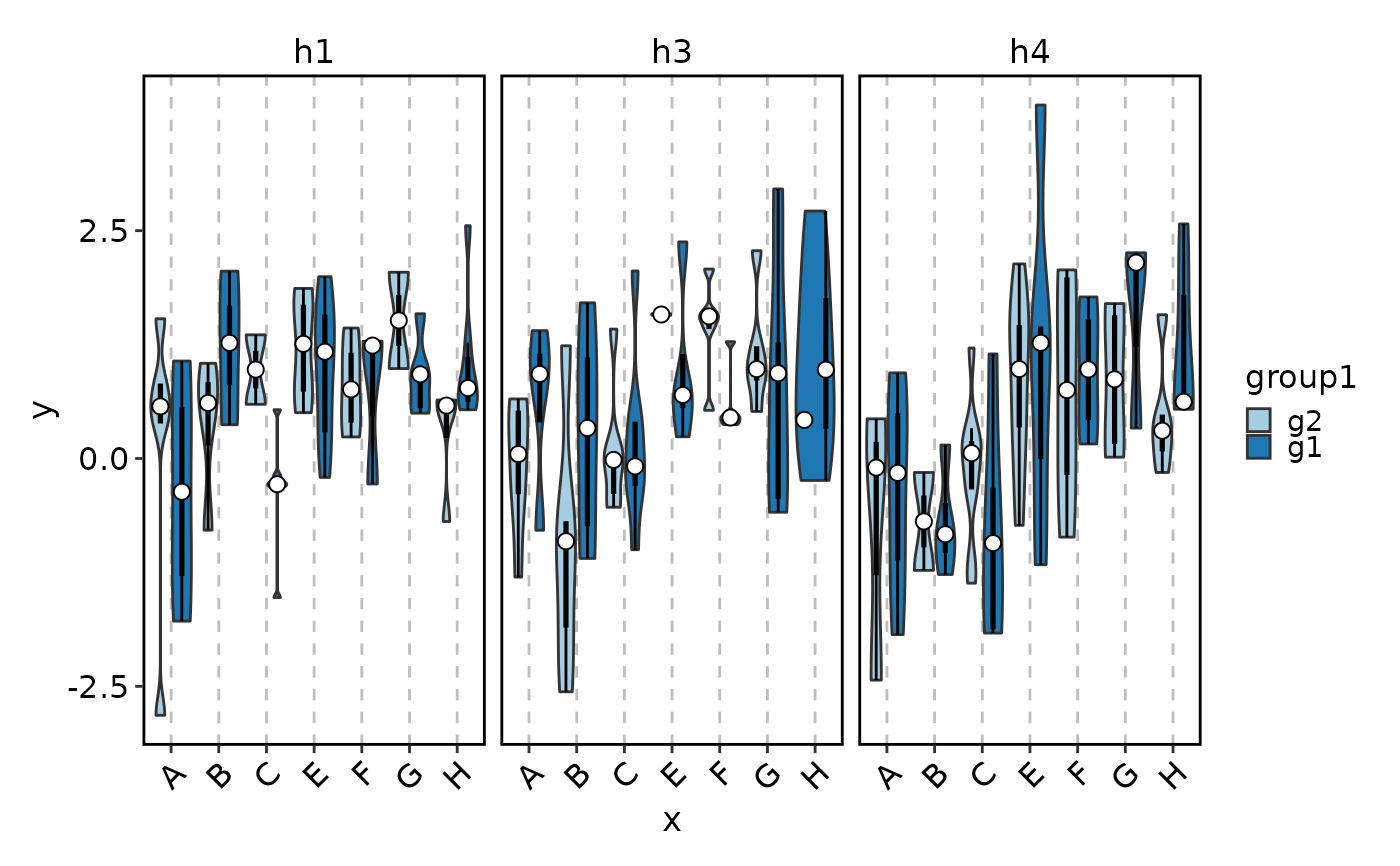
 ViolinPlot(data,
x = "x", y = "y", group_by = "group1",
facet_by = "group2", add_box = TRUE
)
#> Warning: Groups with fewer than two datapoints have been dropped.
#> ℹ Set `drop = FALSE` to consider such groups for position adjustment purposes.
#> Warning: Groups with fewer than two datapoints have been dropped.
#> ℹ Set `drop = FALSE` to consider such groups for position adjustment purposes.
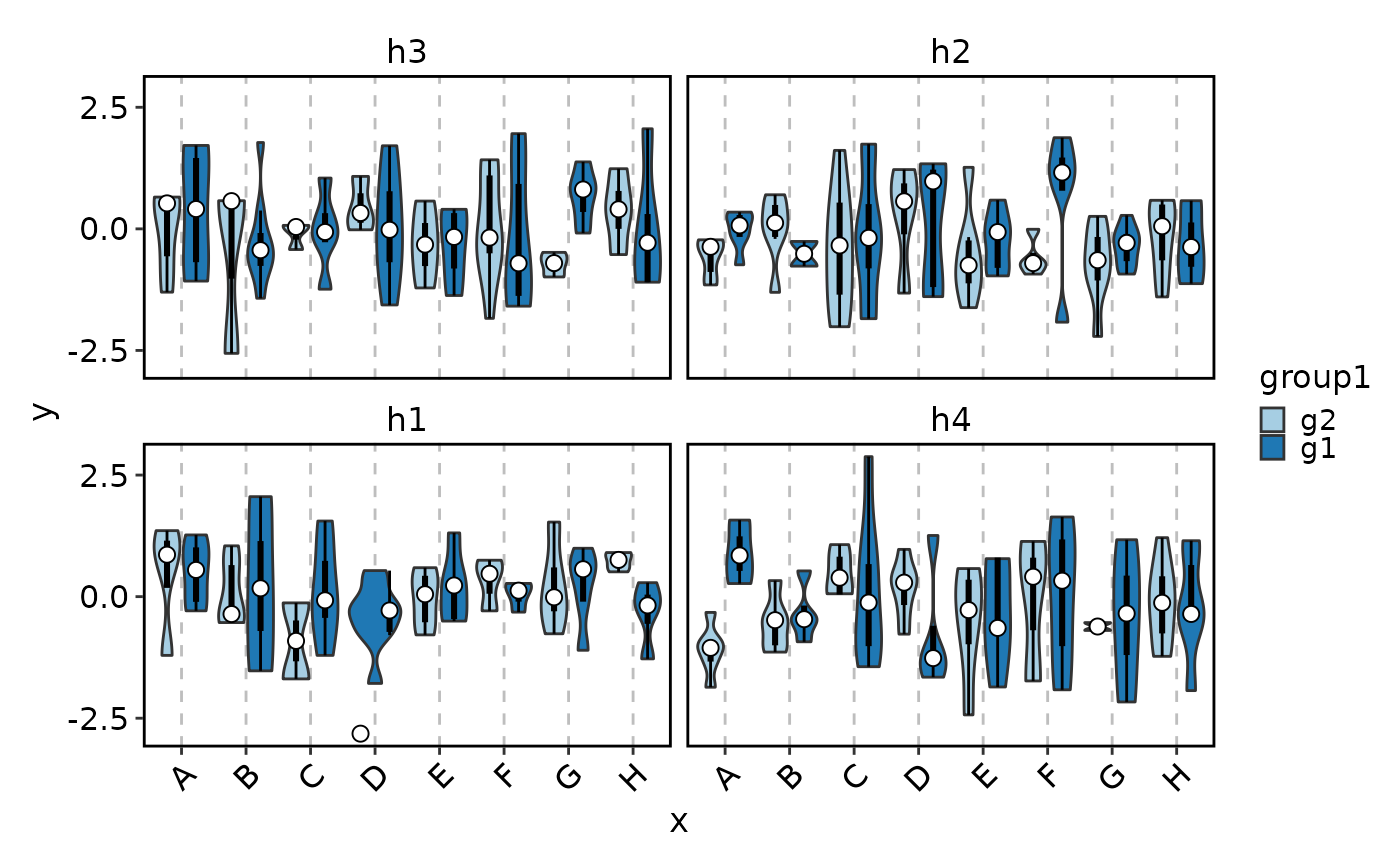
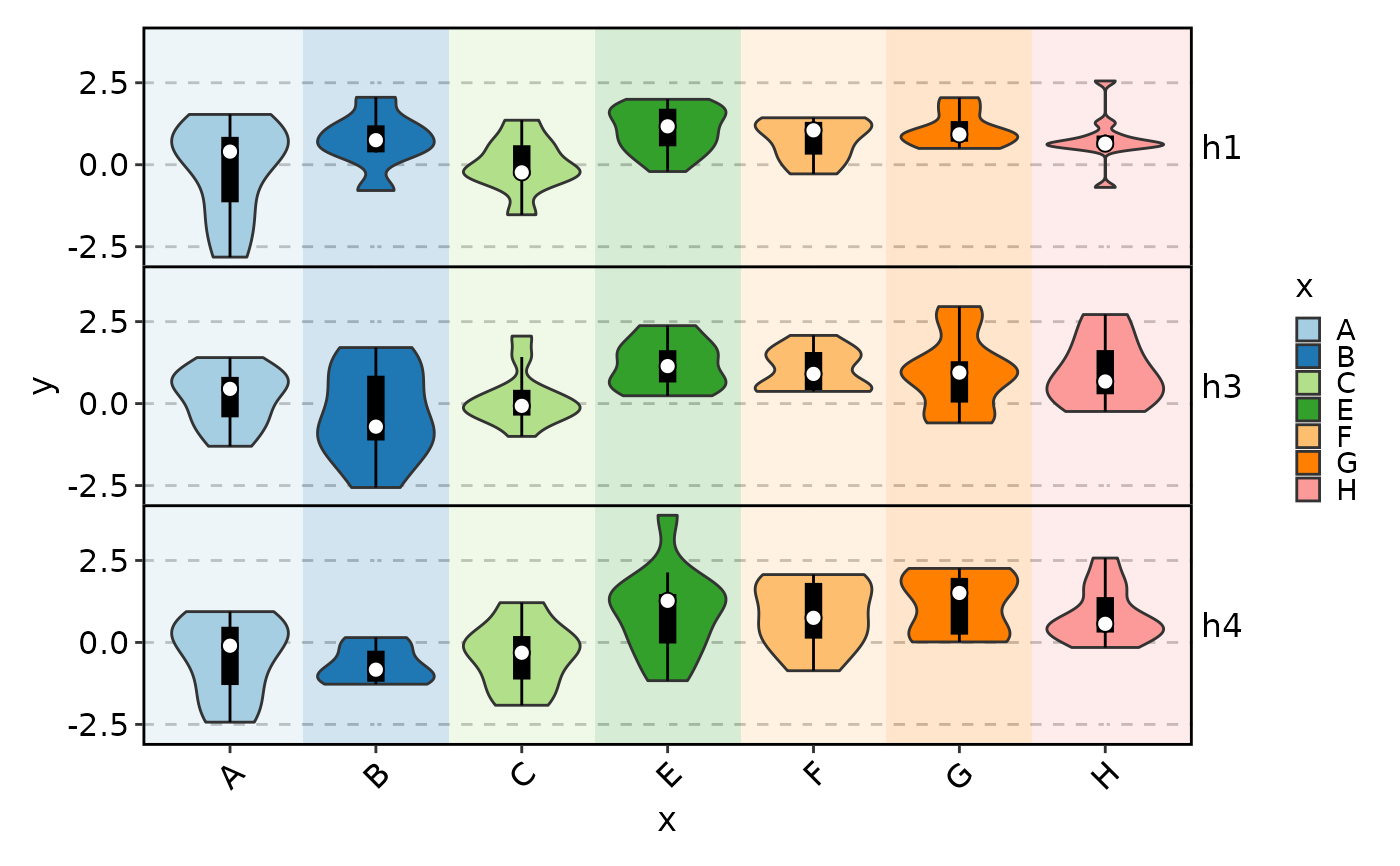
ViolinPlot(data,
x = "x", y = "y", group_by = "group1",
facet_by = "group2", add_box = TRUE
)
#> Warning: Groups with fewer than two datapoints have been dropped.
#> ℹ Set `drop = FALSE` to consider such groups for position adjustment purposes.
#> Warning: Groups with fewer than two datapoints have been dropped.
#> ℹ Set `drop = FALSE` to consider such groups for position adjustment purposes.
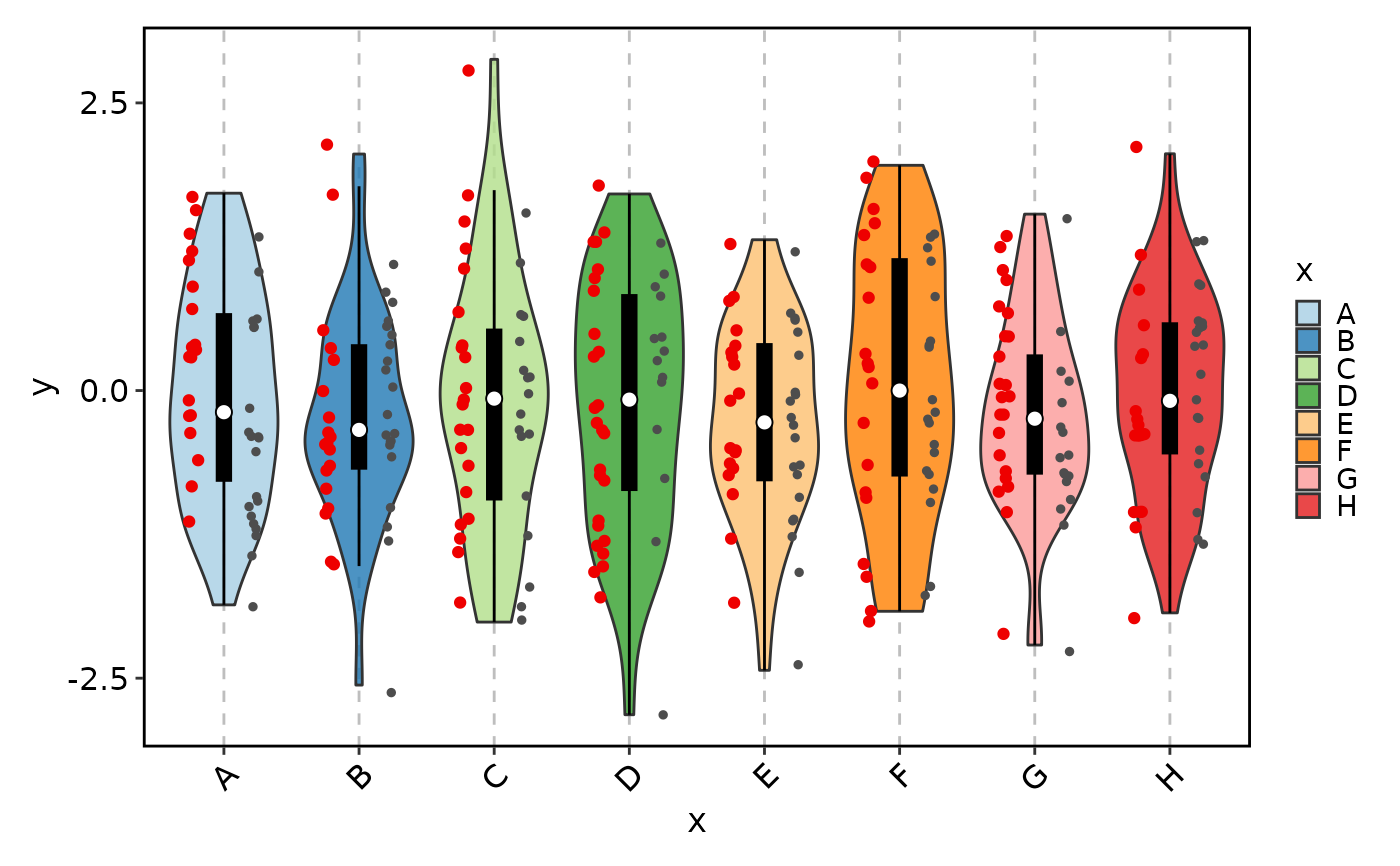
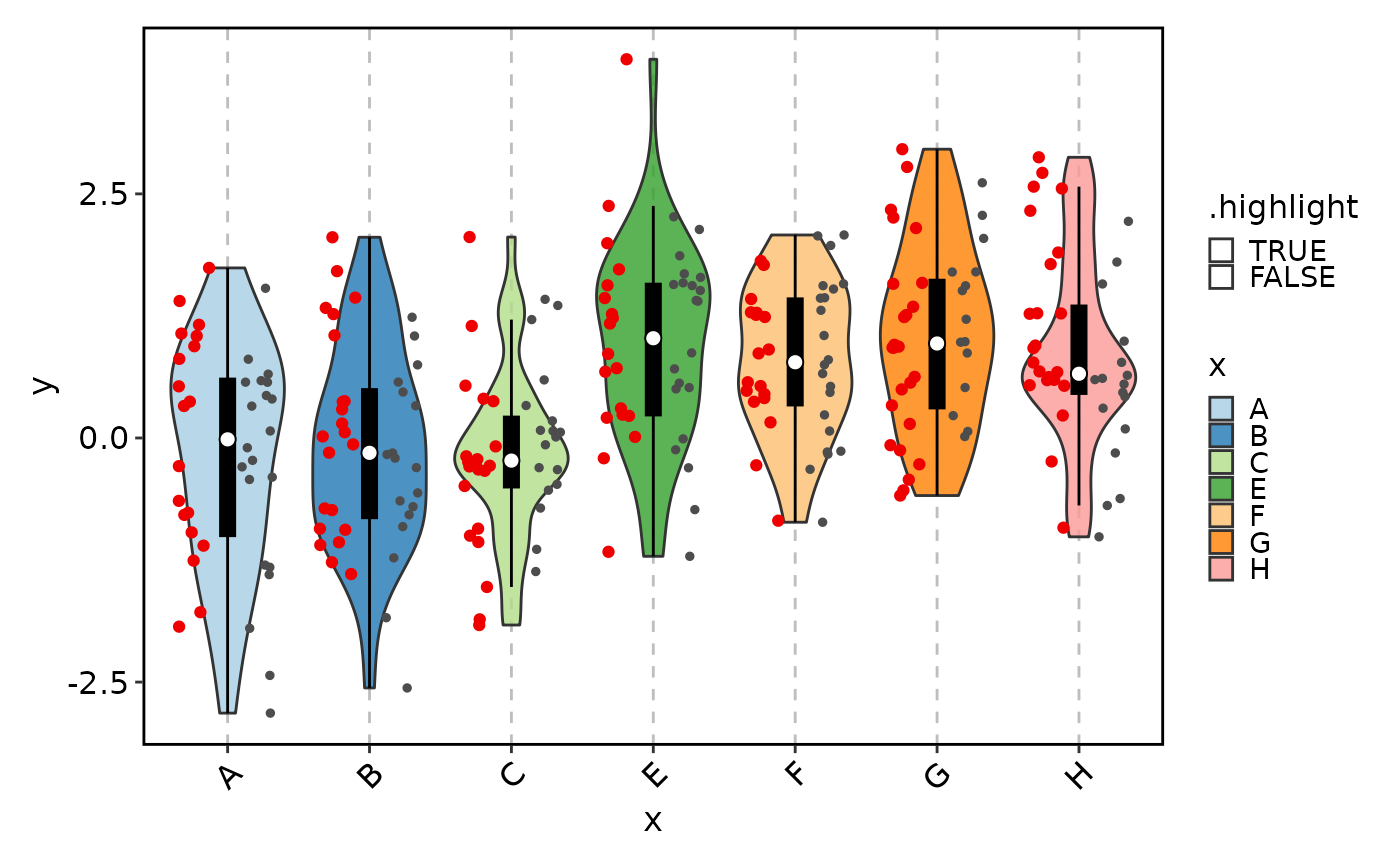
 ViolinPlot(data, x = "x", y = "y", add_point = TRUE, highlight = 'group1 == "g1"',
alpha = 0.8, highlight_size = 1.5, pt_size = 1, add_box = TRUE)
ViolinPlot(data, x = "x", y = "y", add_point = TRUE, highlight = 'group1 == "g1"',
alpha = 0.8, highlight_size = 1.5, pt_size = 1, add_box = TRUE)
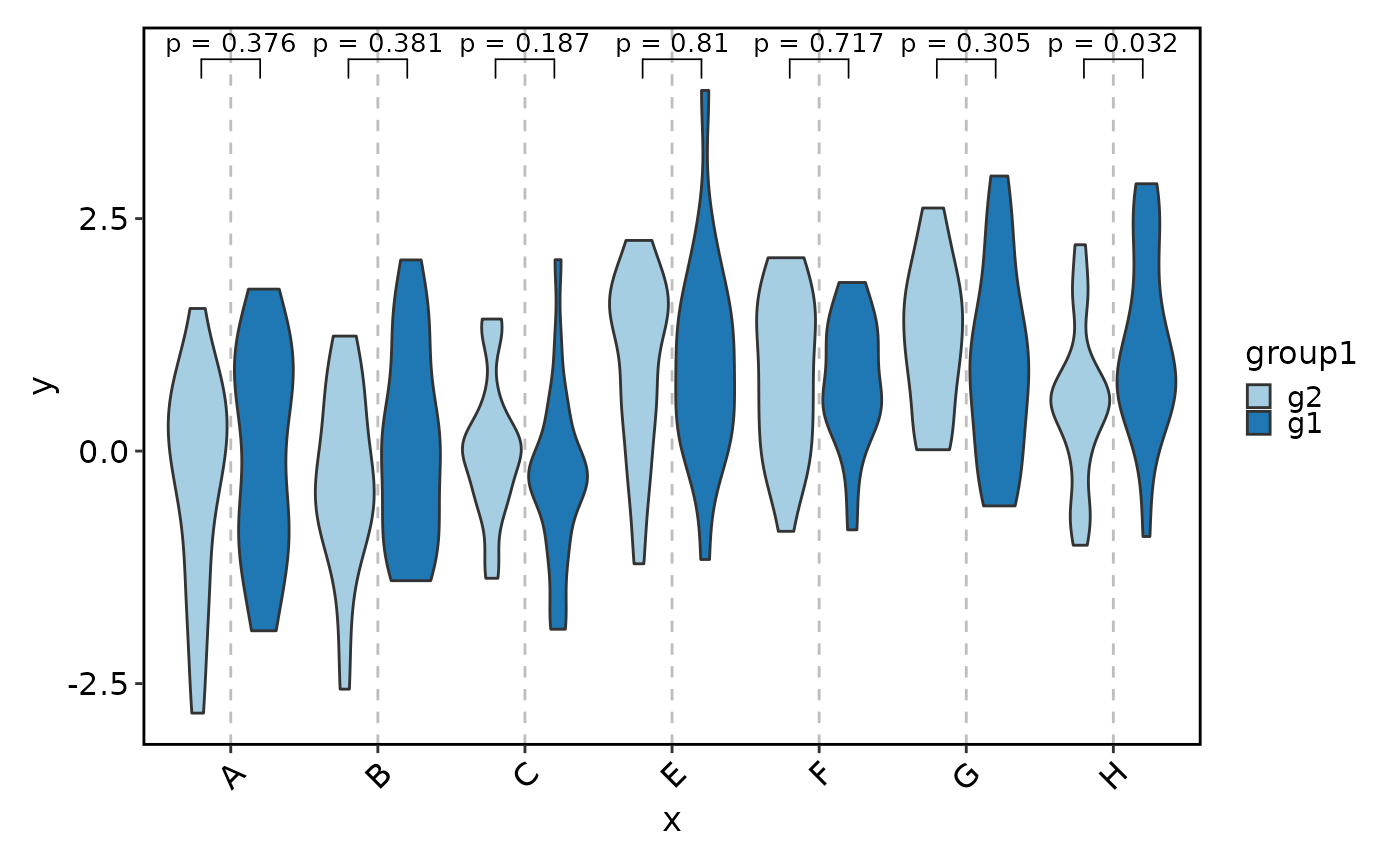
 ViolinPlot(data,
x = "x", y = "y", group_by = "group1",
comparisons = TRUE, sig_label = "p = {p}"
)
ViolinPlot(data,
x = "x", y = "y", group_by = "group1",
comparisons = TRUE, sig_label = "p = {p}"
)
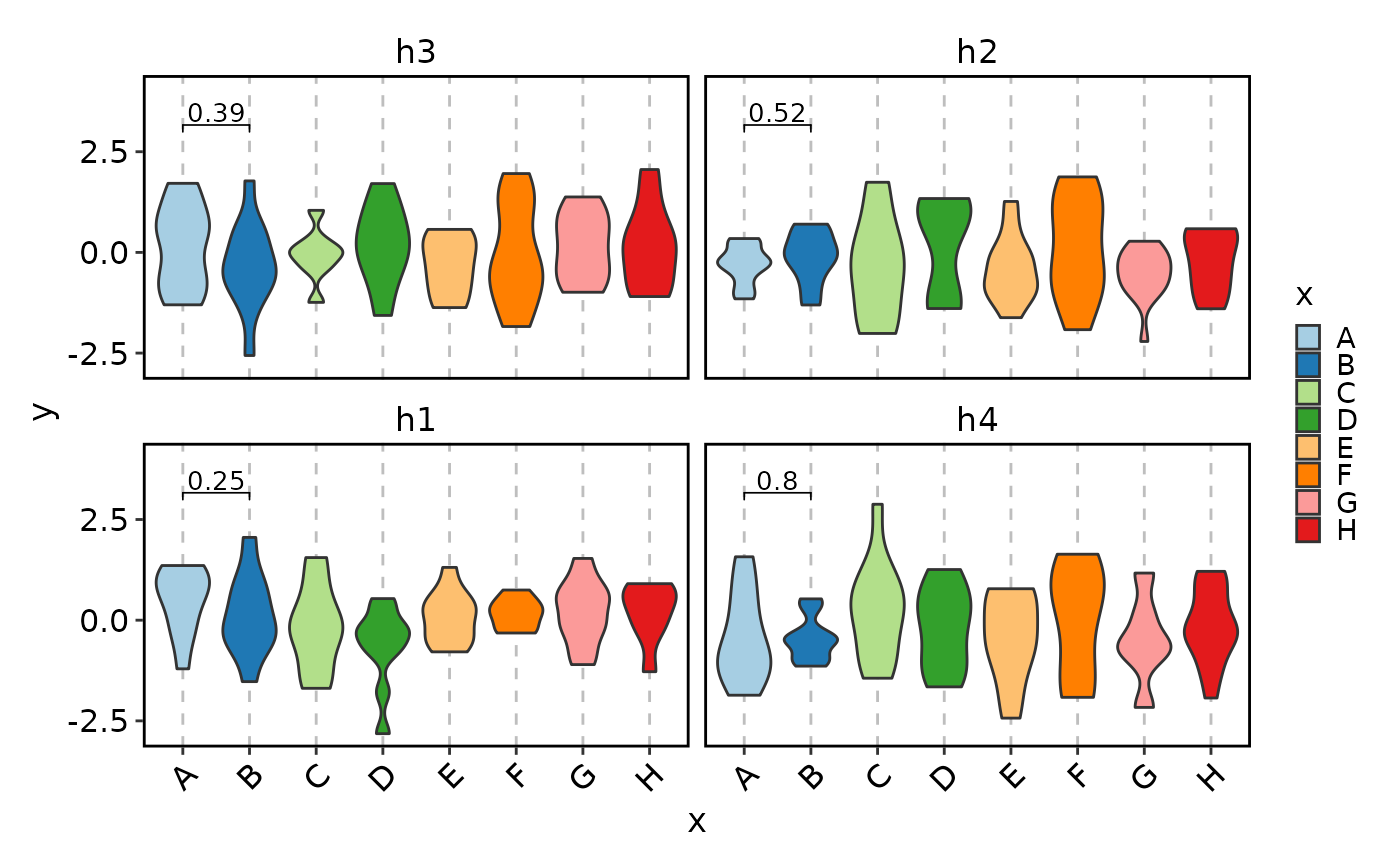
 ViolinPlot(data,
x = "x", y = "y", sig_label = "p.format", hide_ns = TRUE,
facet_by = "group2", comparisons = list(c("D", "E"))
)
#> Warning: Computation failed in `stat_pwc()`.
#> Caused by error in `map()`:
#> ℹ In index: 1.
#> Caused by error in `wilcox.test.default()`:
#> ! not enough 'y' observations
#> Warning: Computation failed in `stat_pwc()`.
#> Caused by error in `map()`:
#> ℹ In index: 1.
#> Caused by error in `wilcox.test.default()`:
#> ! not enough 'y' observations
#> Warning: Computation failed in `stat_pwc()`.
#> Caused by error in `map()`:
#> ℹ In index: 1.
#> Caused by error in `wilcox.test.default()`:
#> ! not enough 'y' observations
#> Warning: Computation failed in `stat_pwc()`.
#> Caused by error in `map()`:
#> ℹ In index: 1.
#> Caused by error in `wilcox.test.default()`:
#> ! not enough 'y' observations
#> Warning: Computation failed in `stat_pwc()`.
#> Caused by error in `map()`:
#> ℹ In index: 1.
#> Caused by error in `wilcox.test.default()`:
#> ! not enough 'y' observations
#> Warning: Computation failed in `stat_pwc()`.
#> Caused by error in `map()`:
#> ℹ In index: 1.
#> Caused by error in `wilcox.test.default()`:
#> ! not enough 'y' observations
#> Warning: Computation failed in `stat_pwc()`.
#> Caused by error in `map()`:
#> ℹ In index: 1.
#> Caused by error in `wilcox.test.default()`:
#> ! not enough 'y' observations
#> Warning: Computation failed in `stat_pwc()`.
#> Caused by error in `map()`:
#> ℹ In index: 1.
#> Caused by error in `wilcox.test.default()`:
#> ! not enough 'y' observations
#> Warning: Computation failed in `stat_pwc()`.
#> Caused by error in `map()`:
#> ℹ In index: 1.
#> Caused by error in `wilcox.test.default()`:
#> ! not enough 'y' observations
ViolinPlot(data,
x = "x", y = "y", sig_label = "p.format", hide_ns = TRUE,
facet_by = "group2", comparisons = list(c("D", "E"))
)
#> Warning: Computation failed in `stat_pwc()`.
#> Caused by error in `map()`:
#> ℹ In index: 1.
#> Caused by error in `wilcox.test.default()`:
#> ! not enough 'y' observations
#> Warning: Computation failed in `stat_pwc()`.
#> Caused by error in `map()`:
#> ℹ In index: 1.
#> Caused by error in `wilcox.test.default()`:
#> ! not enough 'y' observations
#> Warning: Computation failed in `stat_pwc()`.
#> Caused by error in `map()`:
#> ℹ In index: 1.
#> Caused by error in `wilcox.test.default()`:
#> ! not enough 'y' observations
#> Warning: Computation failed in `stat_pwc()`.
#> Caused by error in `map()`:
#> ℹ In index: 1.
#> Caused by error in `wilcox.test.default()`:
#> ! not enough 'y' observations
#> Warning: Computation failed in `stat_pwc()`.
#> Caused by error in `map()`:
#> ℹ In index: 1.
#> Caused by error in `wilcox.test.default()`:
#> ! not enough 'y' observations
#> Warning: Computation failed in `stat_pwc()`.
#> Caused by error in `map()`:
#> ℹ In index: 1.
#> Caused by error in `wilcox.test.default()`:
#> ! not enough 'y' observations
#> Warning: Computation failed in `stat_pwc()`.
#> Caused by error in `map()`:
#> ℹ In index: 1.
#> Caused by error in `wilcox.test.default()`:
#> ! not enough 'y' observations
#> Warning: Computation failed in `stat_pwc()`.
#> Caused by error in `map()`:
#> ℹ In index: 1.
#> Caused by error in `wilcox.test.default()`:
#> ! not enough 'y' observations
#> Warning: Computation failed in `stat_pwc()`.
#> Caused by error in `map()`:
#> ℹ In index: 1.
#> Caused by error in `wilcox.test.default()`:
#> ! not enough 'y' observations
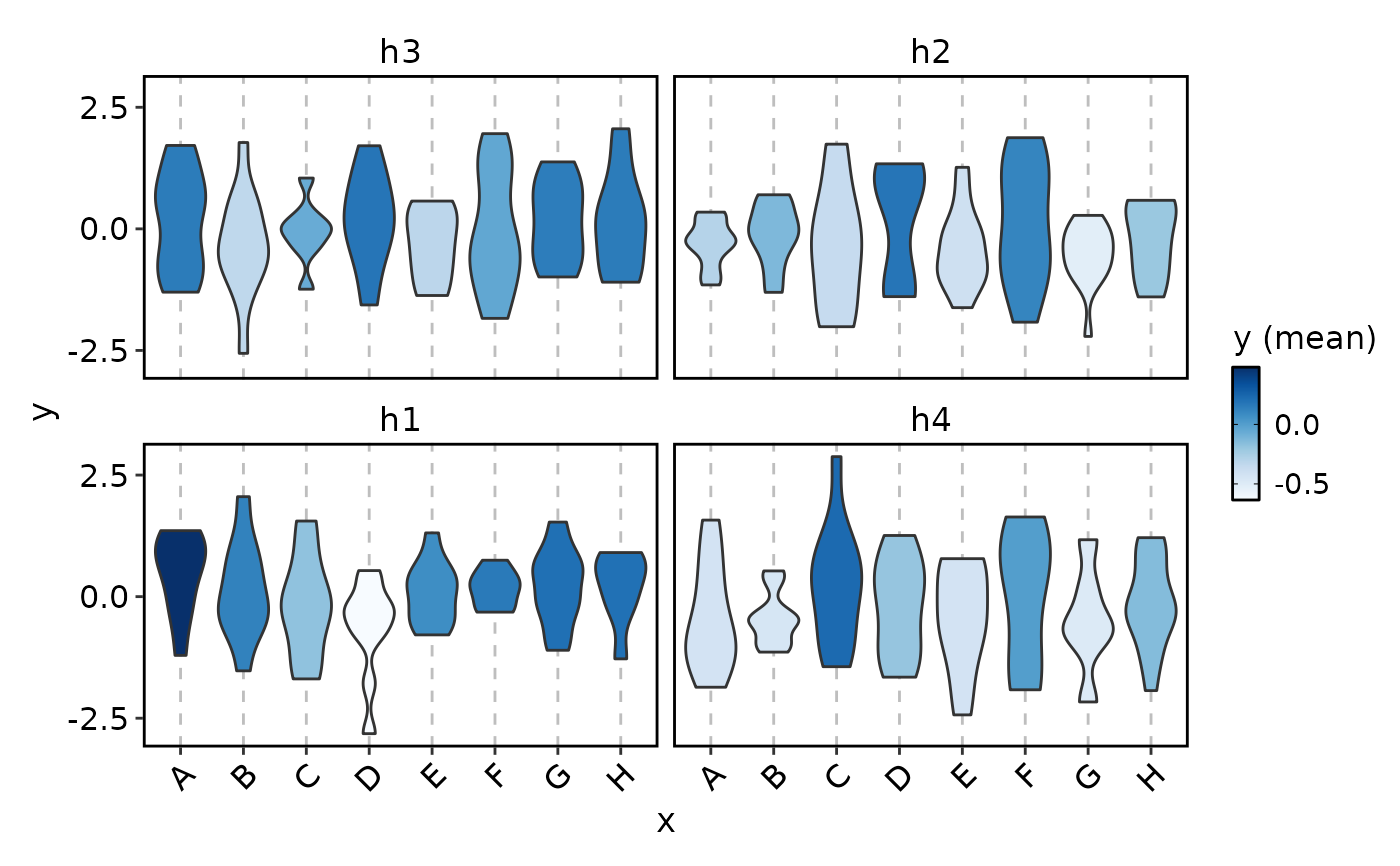
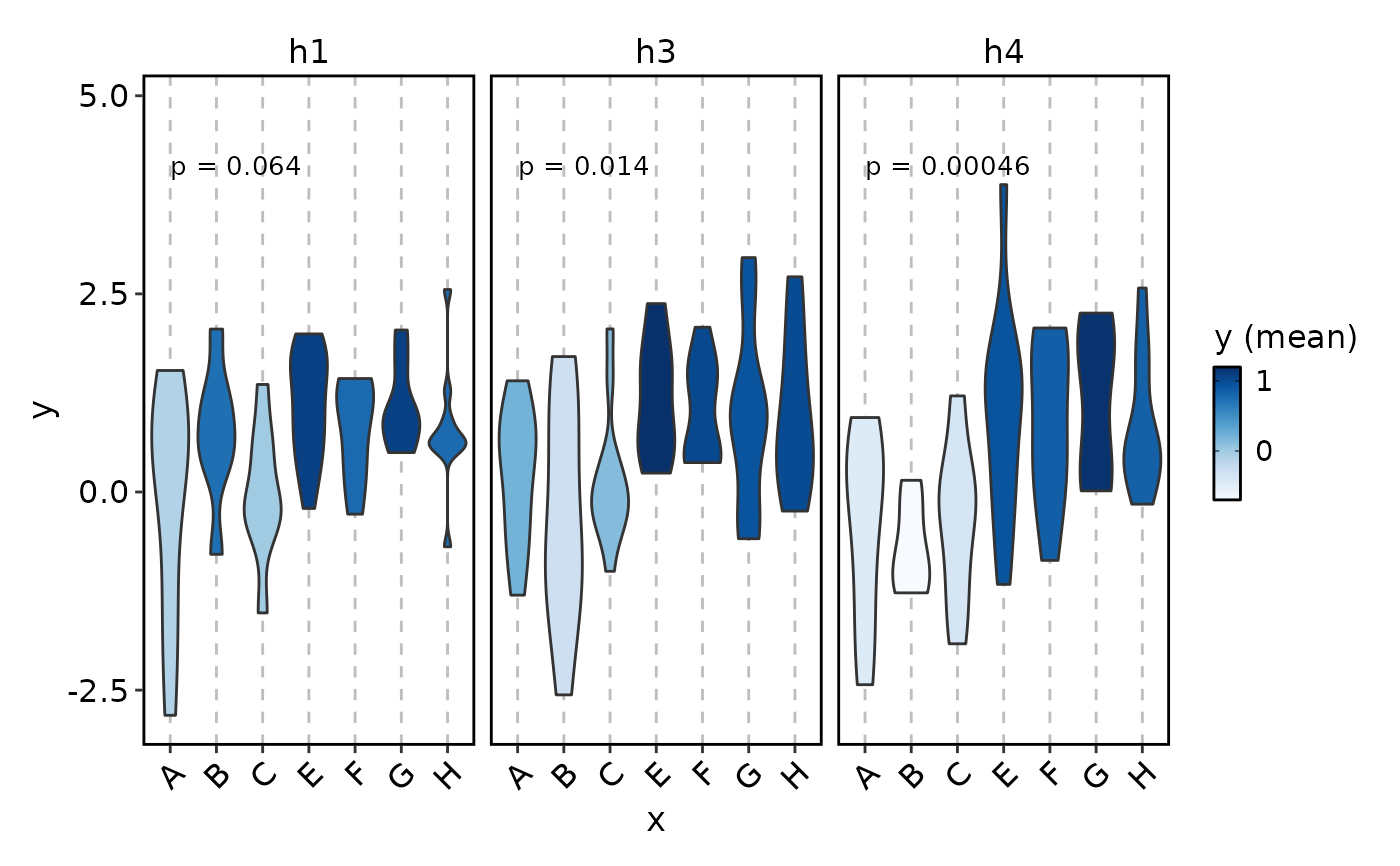
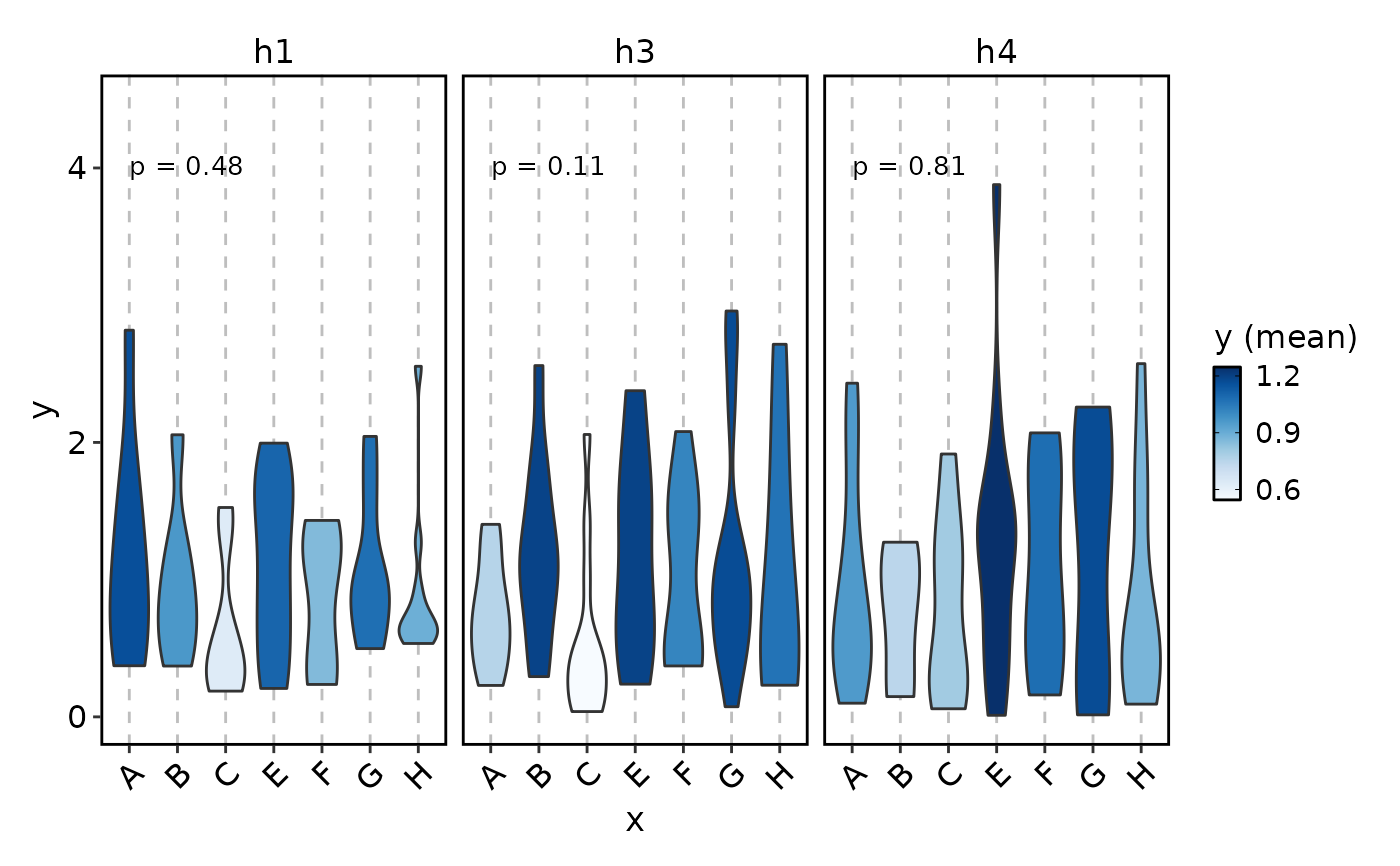
 ViolinPlot(data,
x = "x", y = "y", fill_mode = "mean",
facet_by = "group2", palette = "Blues", multiplegroup_comparisons = TRUE
)
#> Warning: The following aesthetics were dropped during statistical transformation: fill.
#> ℹ This can happen when ggplot fails to infer the correct grouping structure in
#> the data.
#> ℹ Did you forget to specify a `group` aesthetic or to convert a numerical
#> variable into a factor?
#> Warning: The following aesthetics were dropped during statistical transformation: fill.
#> ℹ This can happen when ggplot fails to infer the correct grouping structure in
#> the data.
#> ℹ Did you forget to specify a `group` aesthetic or to convert a numerical
#> variable into a factor?
#> Warning: The following aesthetics were dropped during statistical transformation: fill.
#> ℹ This can happen when ggplot fails to infer the correct grouping structure in
#> the data.
#> ℹ Did you forget to specify a `group` aesthetic or to convert a numerical
#> variable into a factor?
ViolinPlot(data,
x = "x", y = "y", fill_mode = "mean",
facet_by = "group2", palette = "Blues", multiplegroup_comparisons = TRUE
)
#> Warning: The following aesthetics were dropped during statistical transformation: fill.
#> ℹ This can happen when ggplot fails to infer the correct grouping structure in
#> the data.
#> ℹ Did you forget to specify a `group` aesthetic or to convert a numerical
#> variable into a factor?
#> Warning: The following aesthetics were dropped during statistical transformation: fill.
#> ℹ This can happen when ggplot fails to infer the correct grouping structure in
#> the data.
#> ℹ Did you forget to specify a `group` aesthetic or to convert a numerical
#> variable into a factor?
#> Warning: The following aesthetics were dropped during statistical transformation: fill.
#> ℹ This can happen when ggplot fails to infer the correct grouping structure in
#> the data.
#> ℹ Did you forget to specify a `group` aesthetic or to convert a numerical
#> variable into a factor?
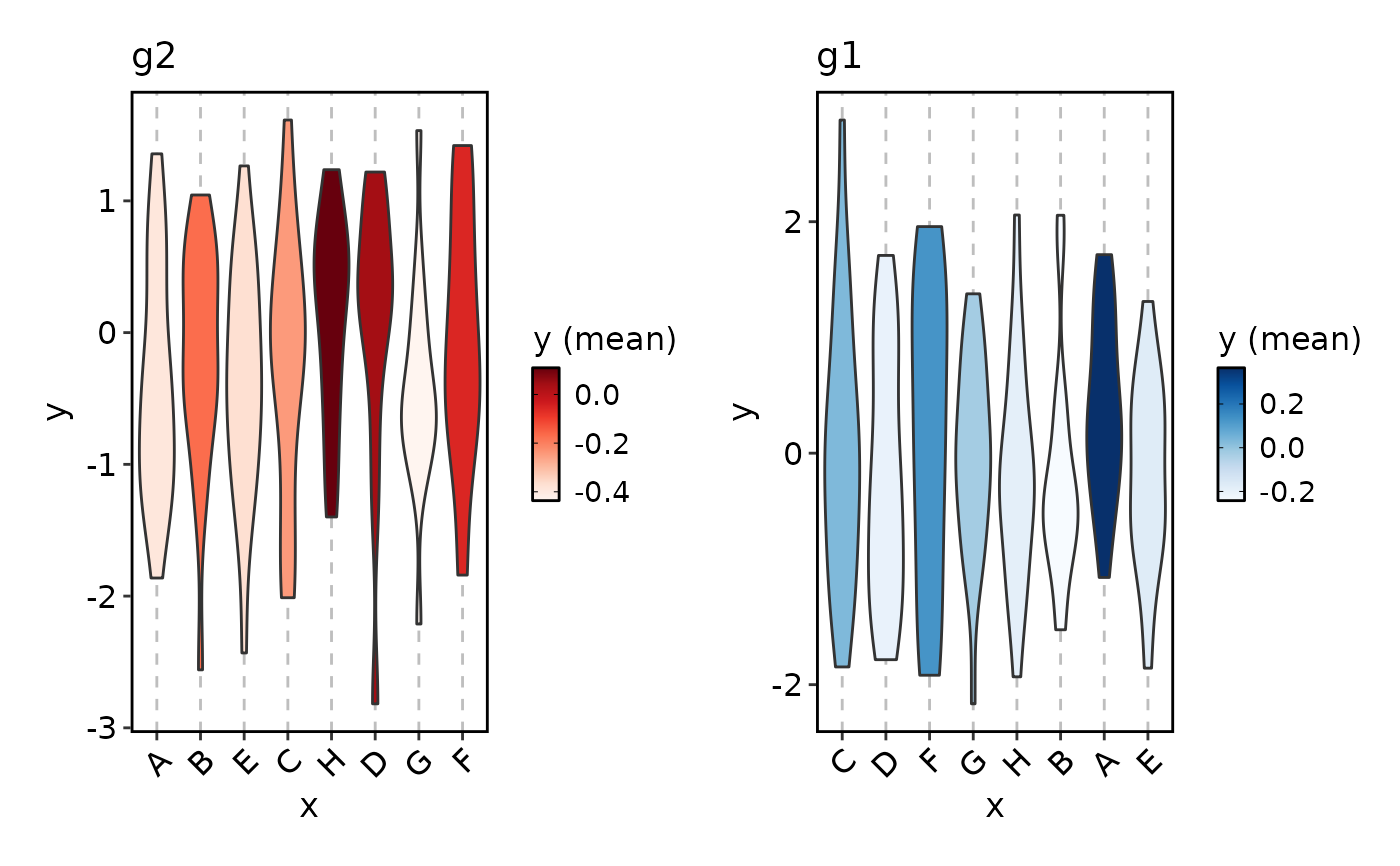
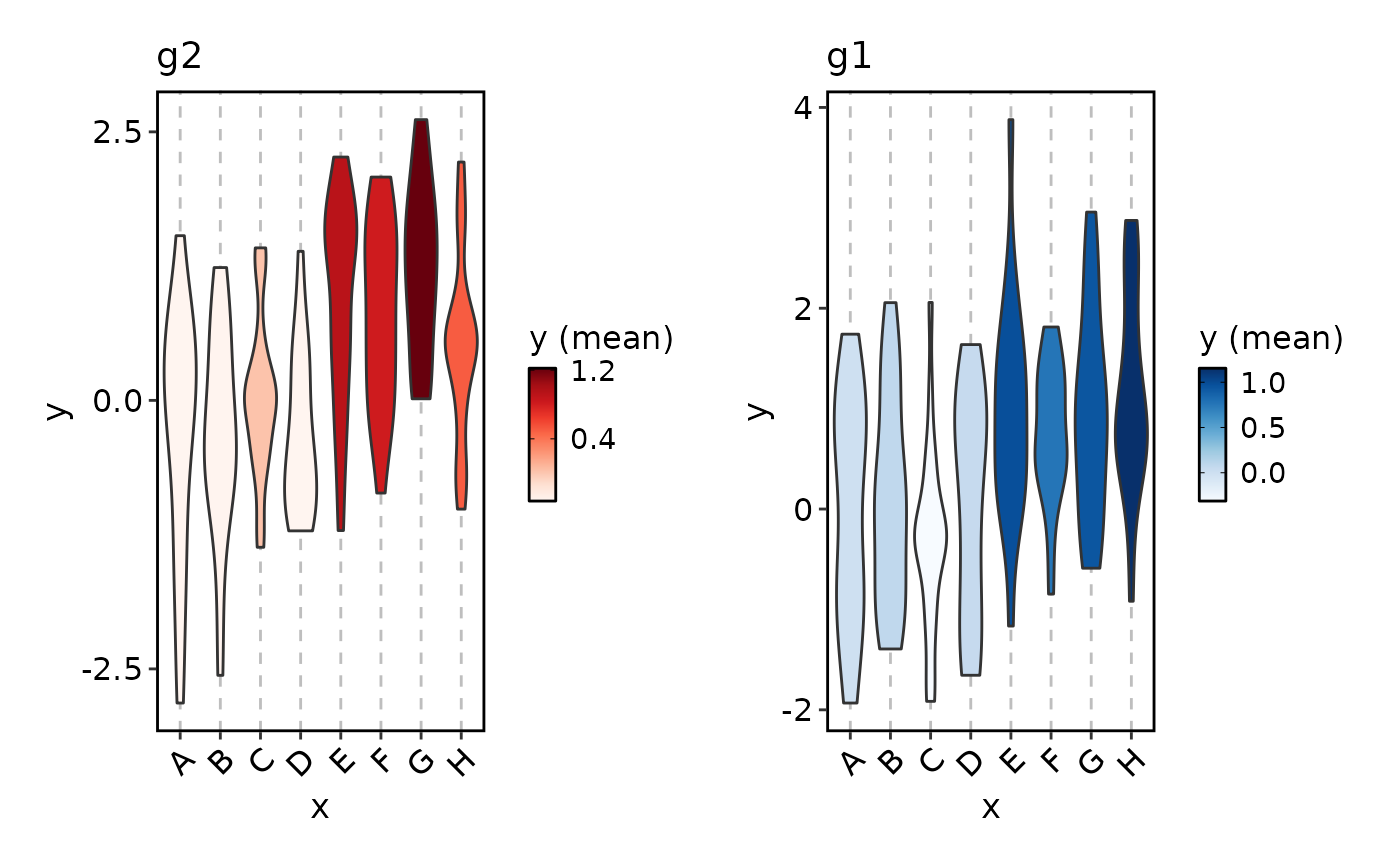
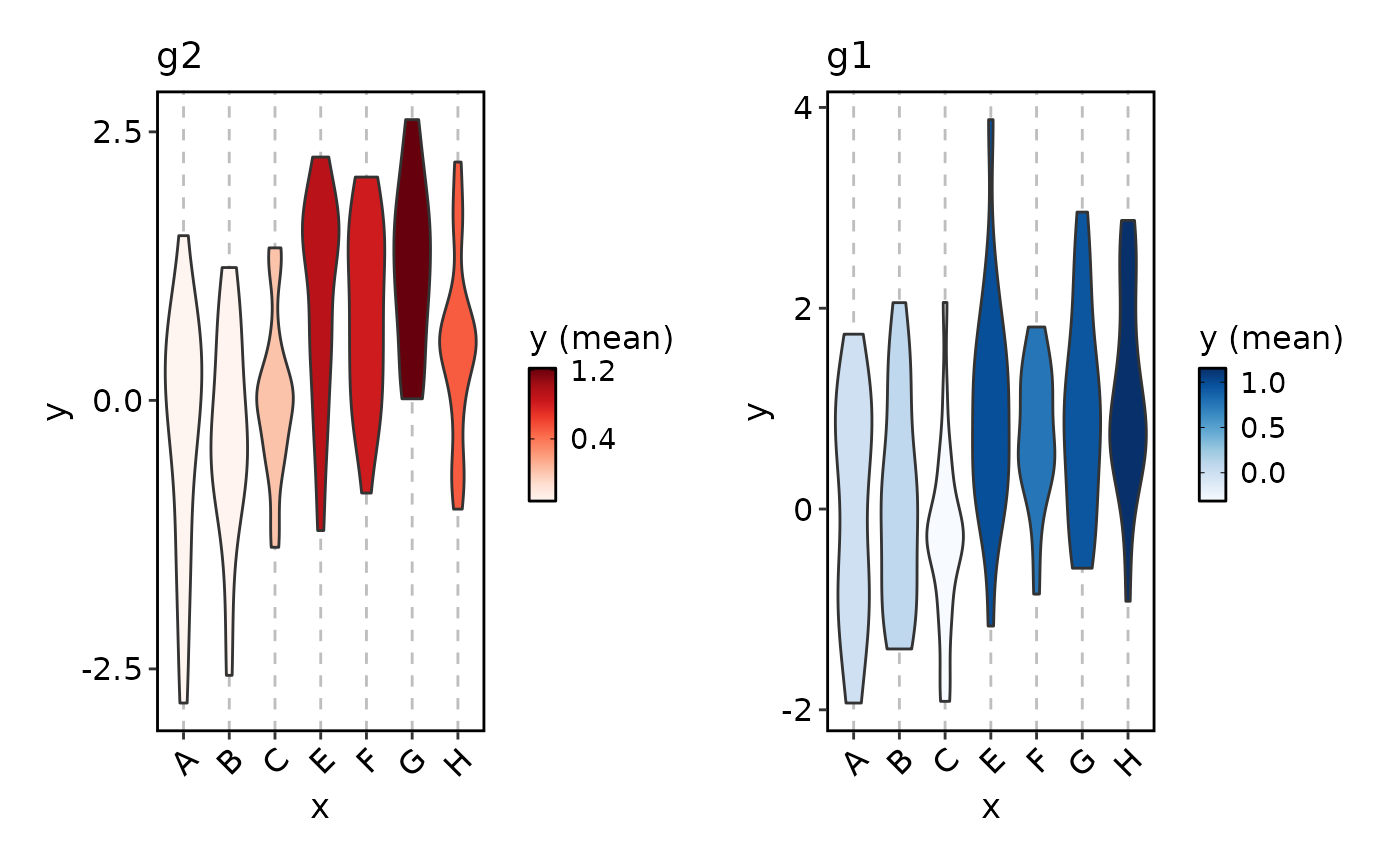
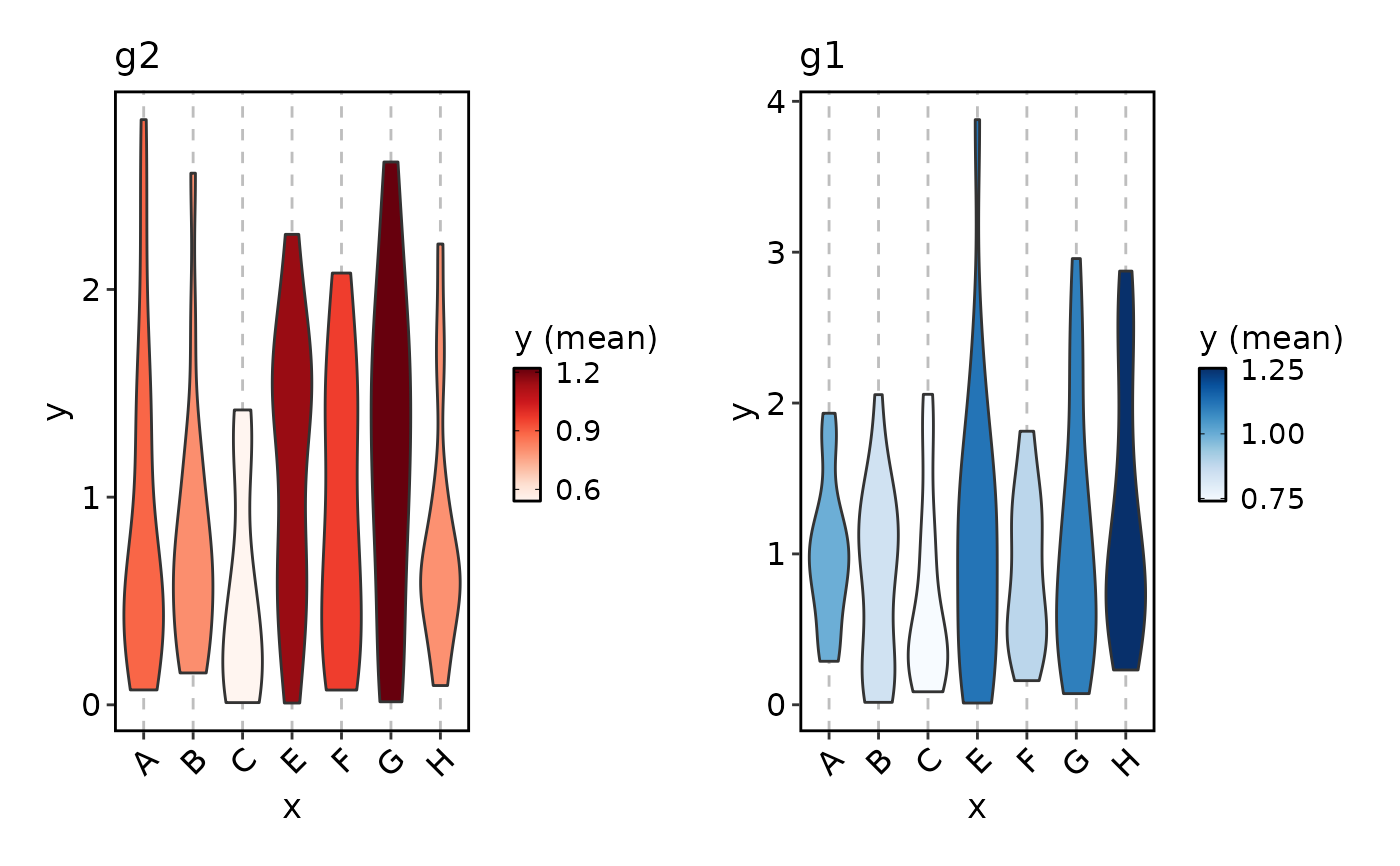
 ViolinPlot(data,
x = "x", y = "y", fill_mode = "mean",
split_by = "group1", palette = c(g1 = "Blues", g2 = "Reds")
)
ViolinPlot(data,
x = "x", y = "y", fill_mode = "mean",
split_by = "group1", palette = c(g1 = "Blues", g2 = "Reds")
)
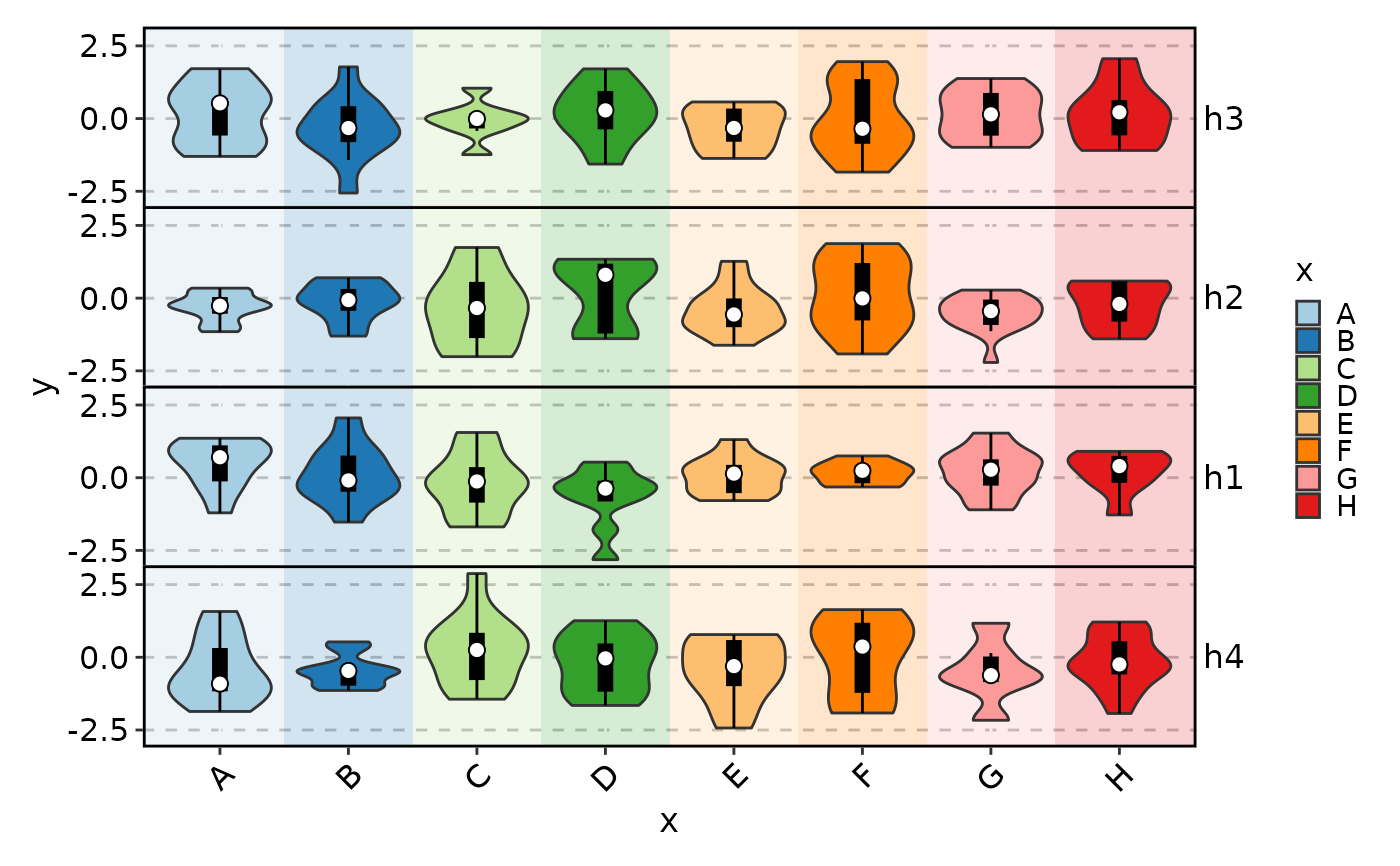
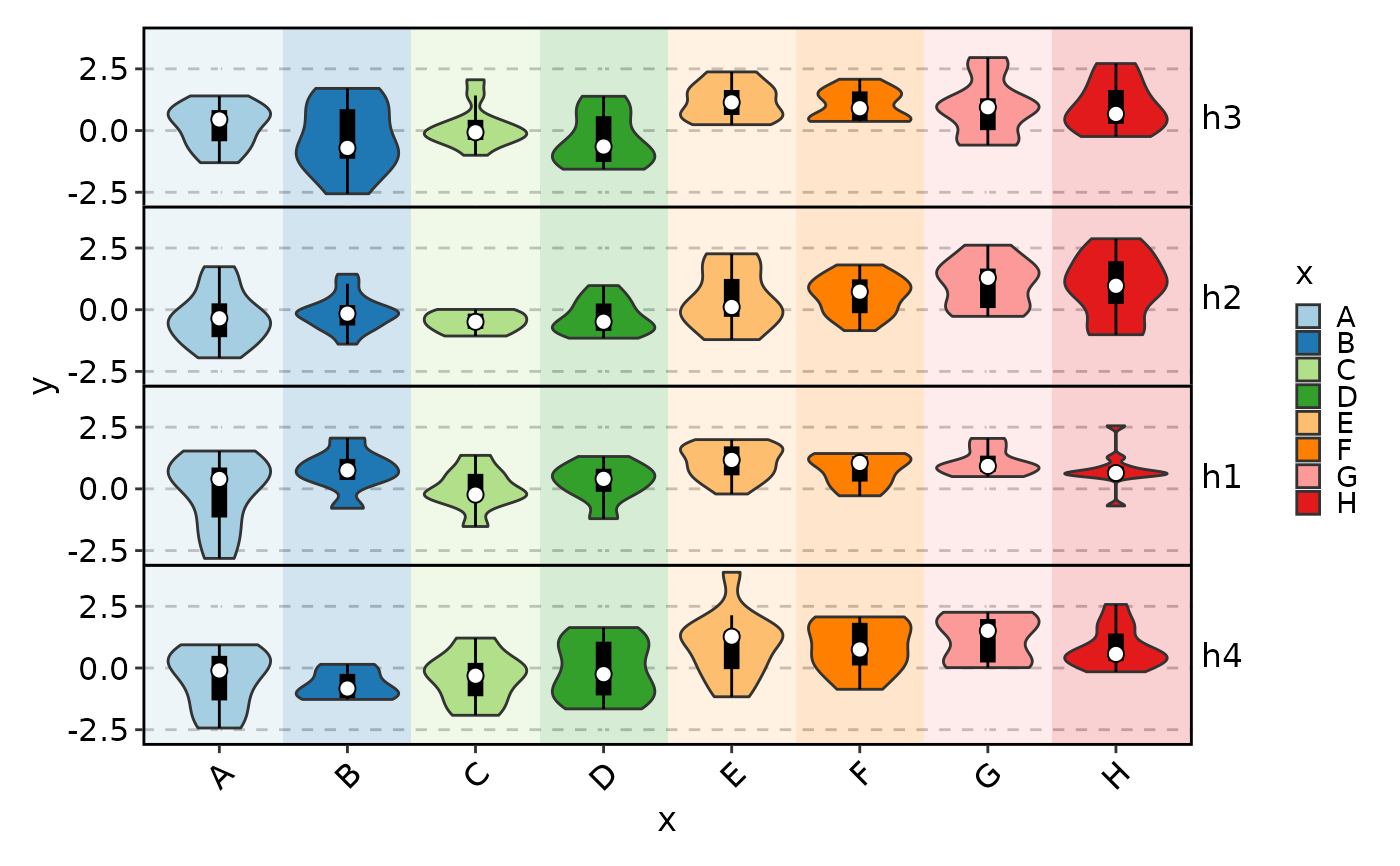
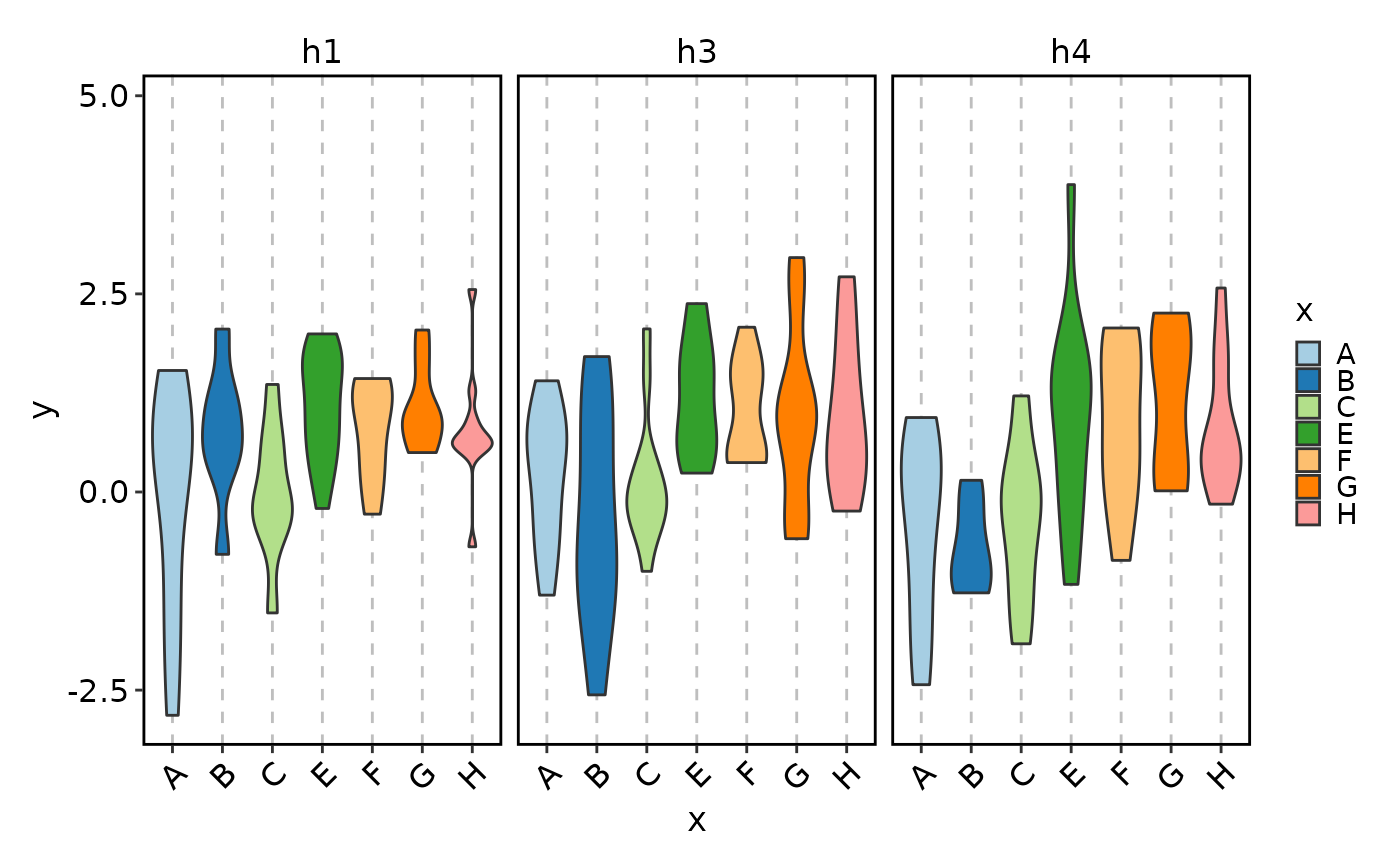
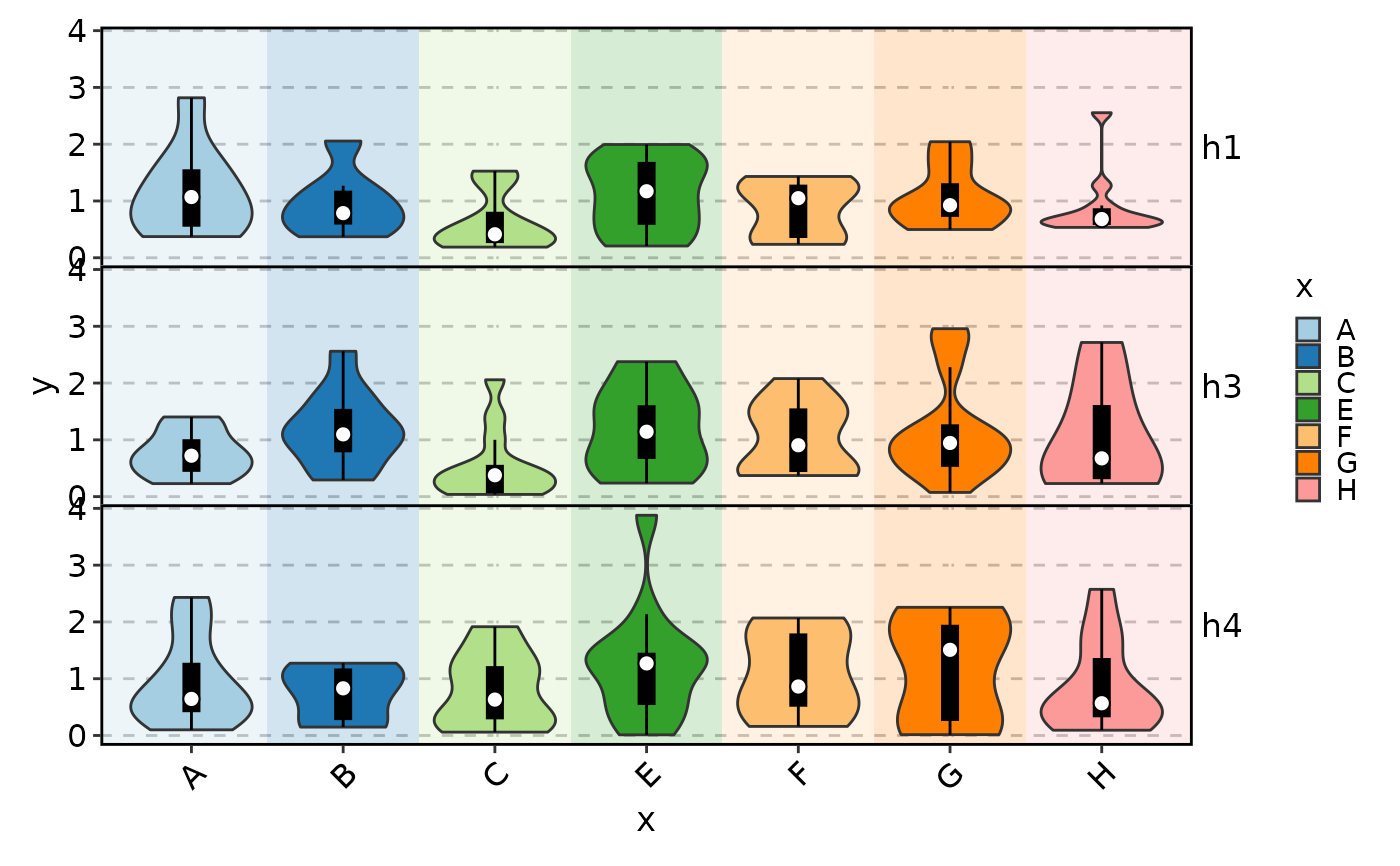
 ViolinPlot(data,
x = "x", y = "y", stack = TRUE,
facet_by = "group2", add_box = TRUE, add_bg = TRUE,
bg_palette = "Paired"
)
ViolinPlot(data,
x = "x", y = "y", stack = TRUE,
facet_by = "group2", add_box = TRUE, add_bg = TRUE,
bg_palette = "Paired"
)
 # }
# \donttest{
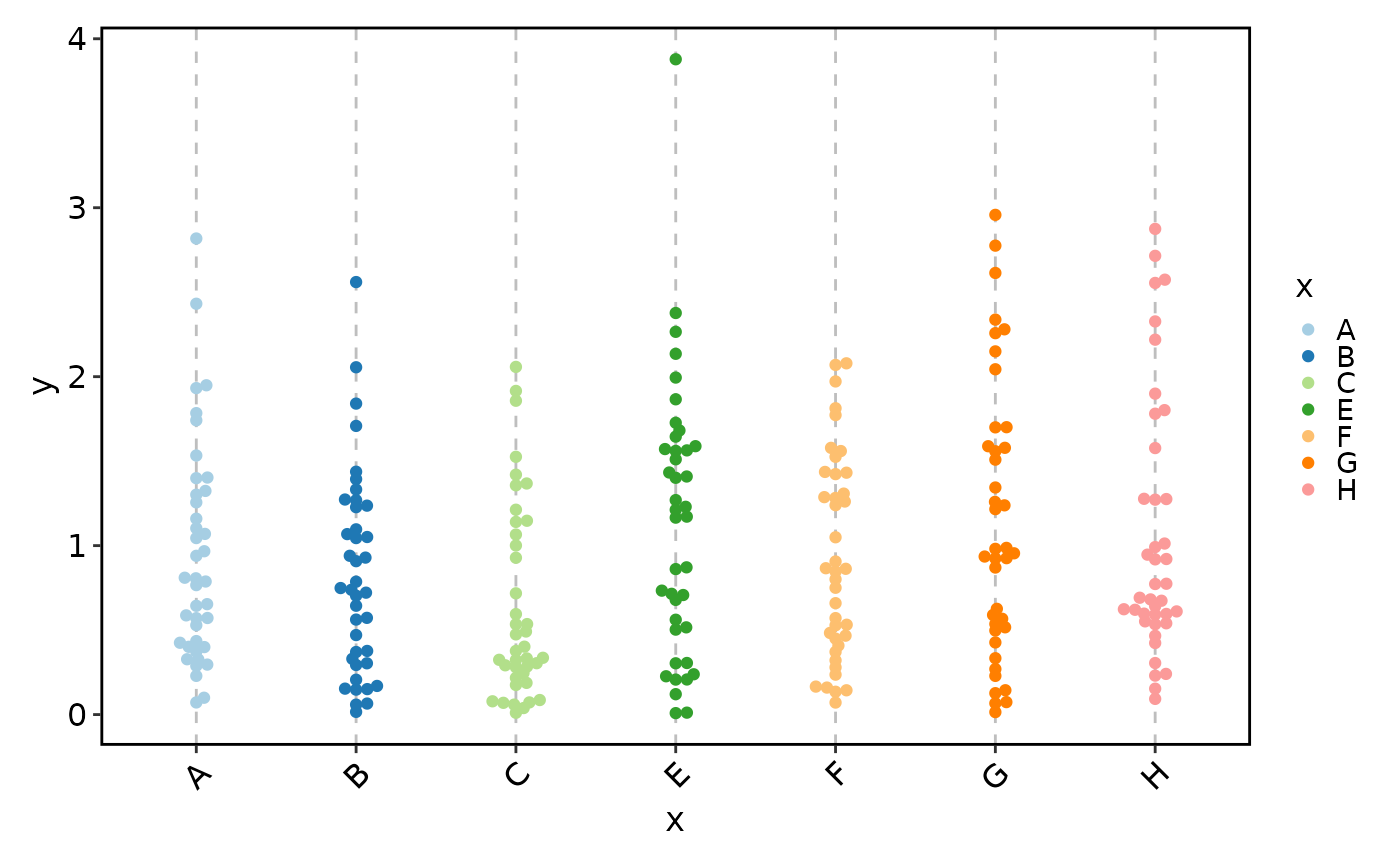
# Beeswarm plot examples
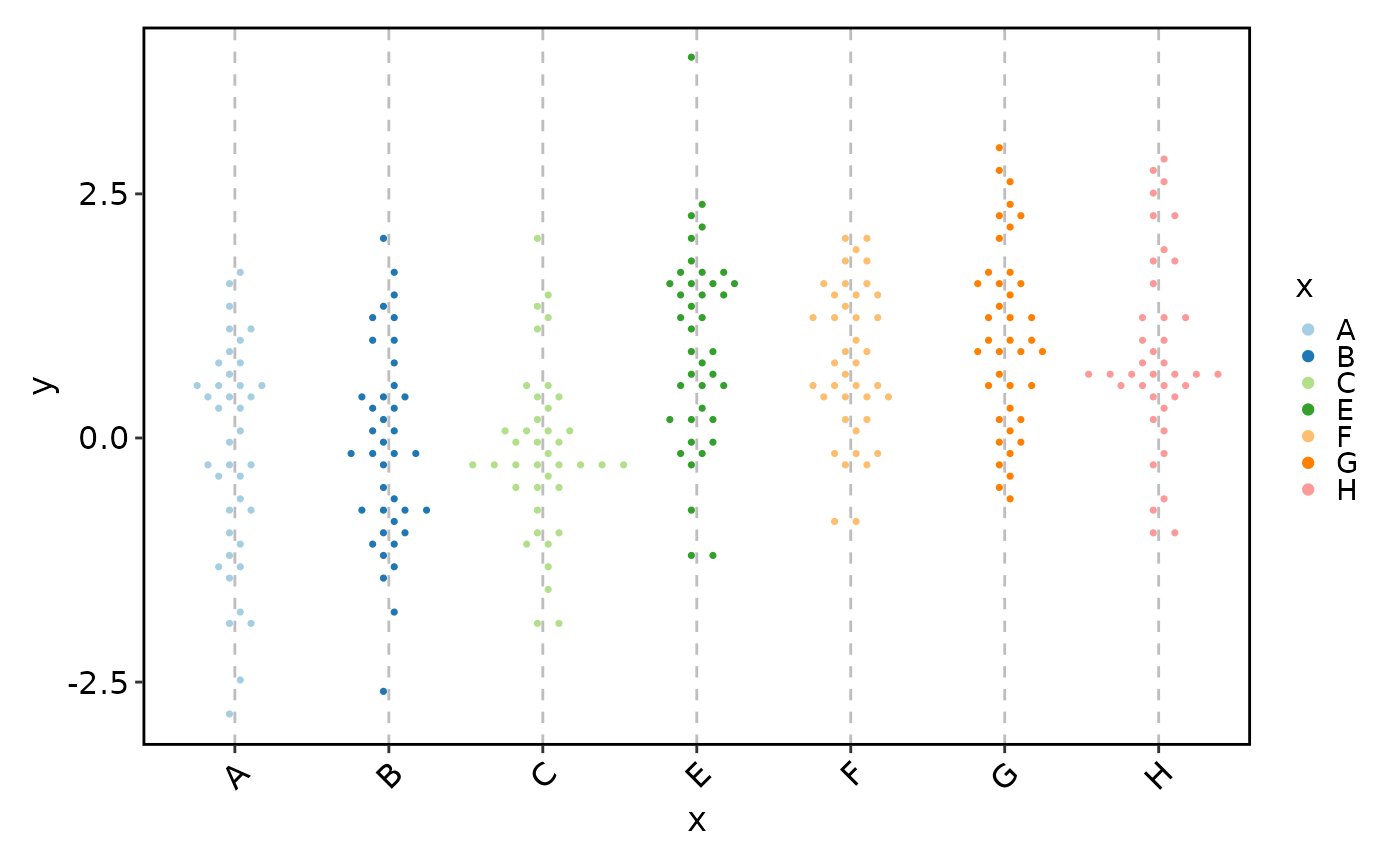
BeeswarmPlot(data, x = "x", y = "y")
# }
# \donttest{
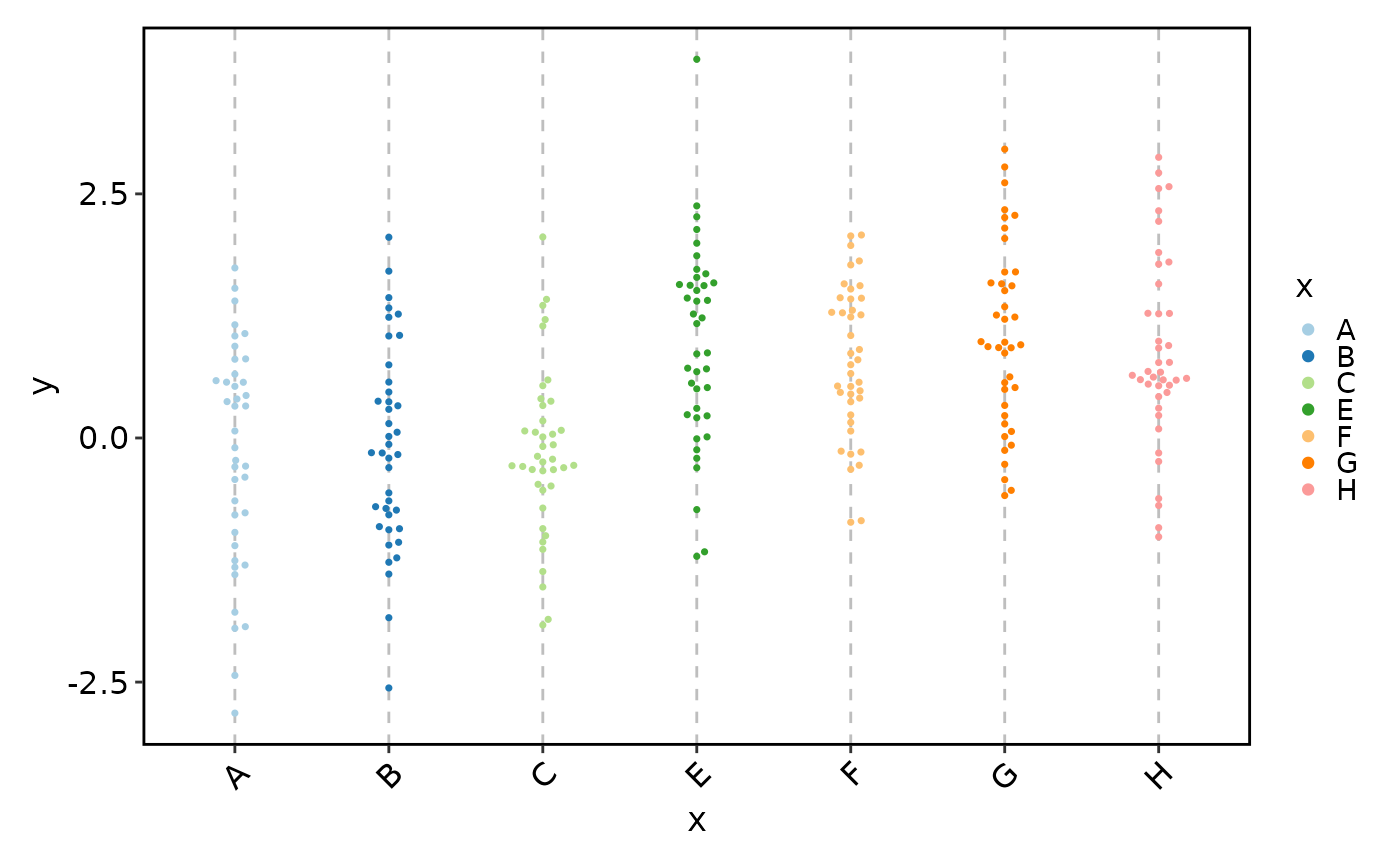
# Beeswarm plot examples
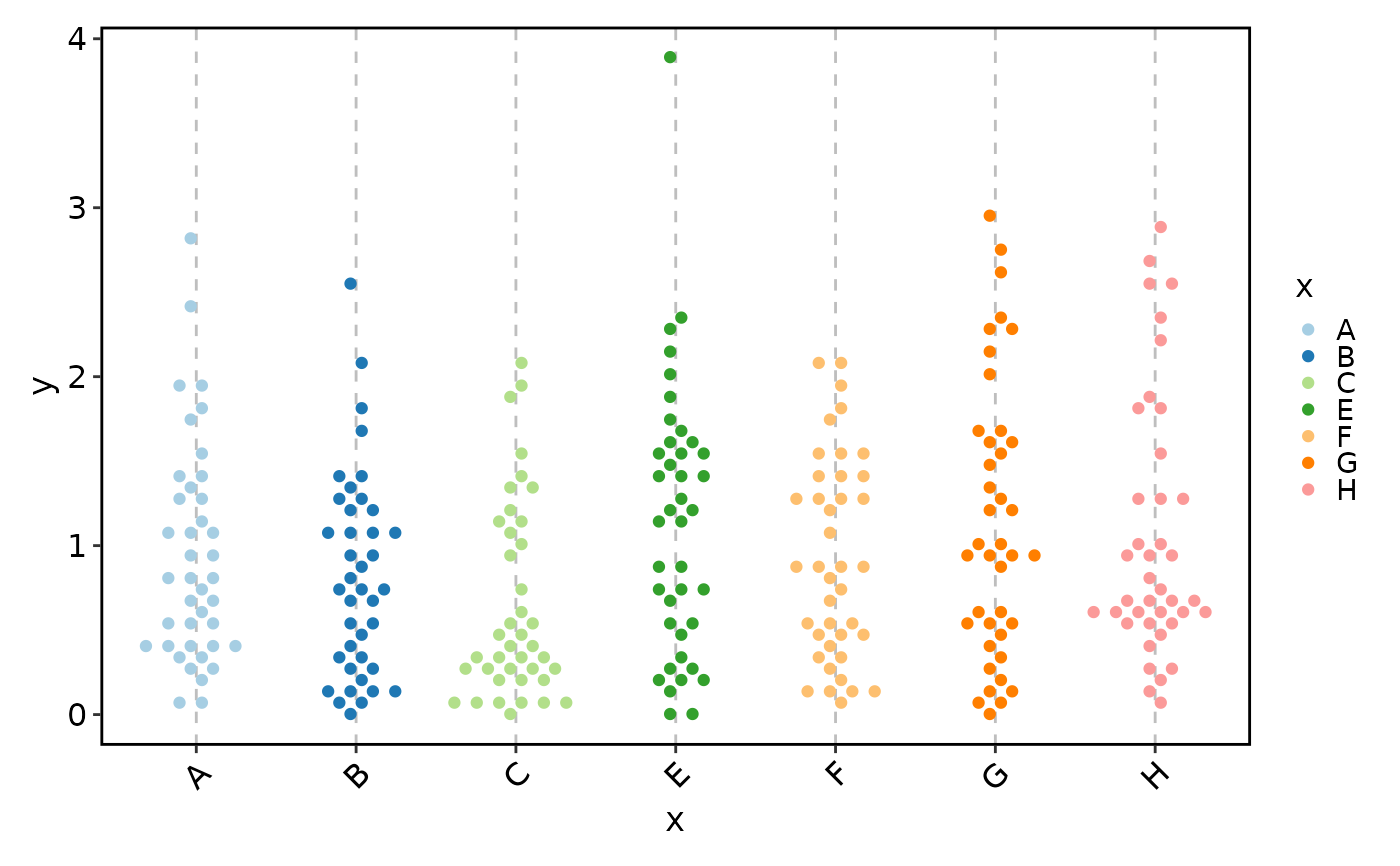
BeeswarmPlot(data, x = "x", y = "y")
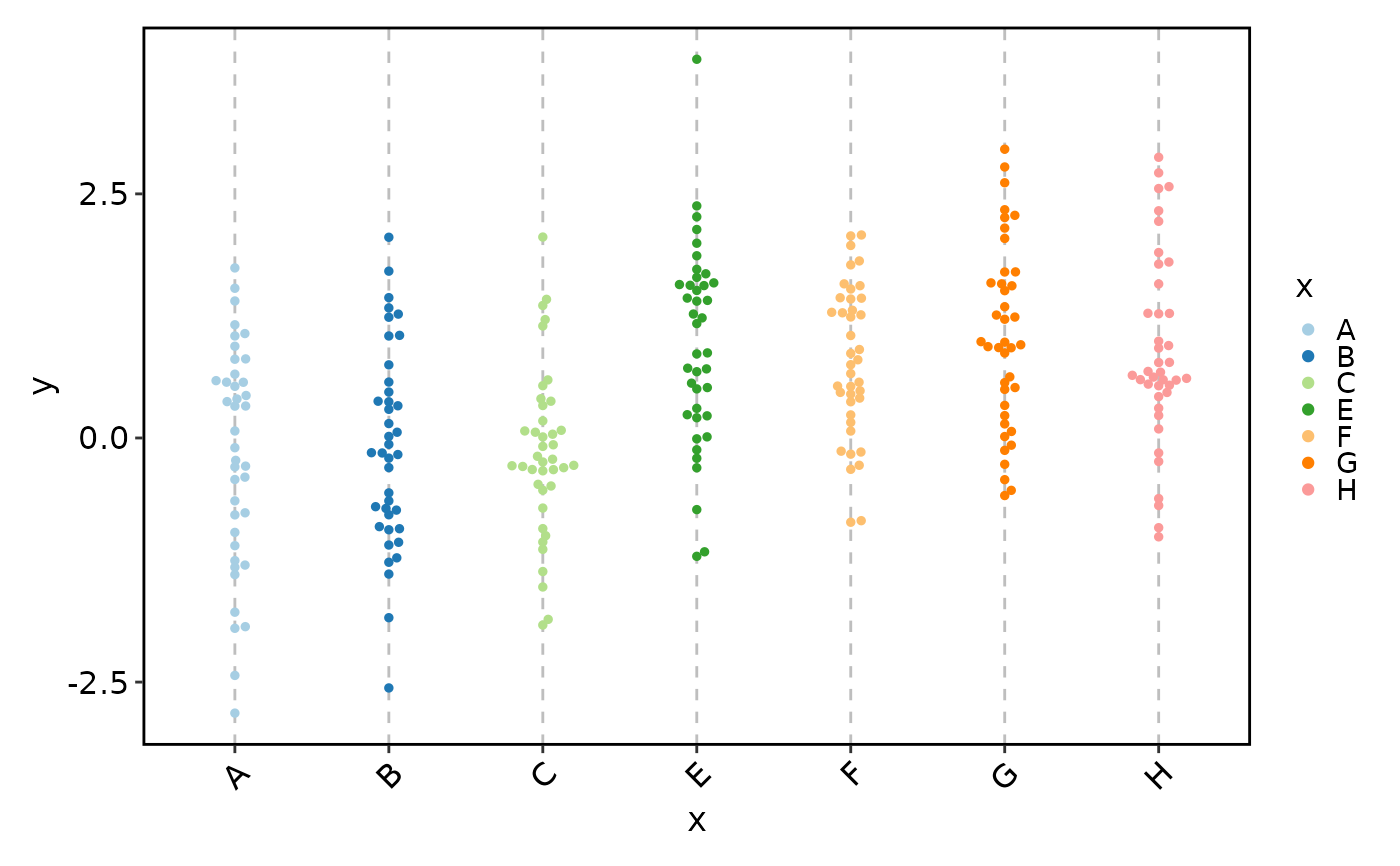
 BeeswarmPlot(data, x = "x", y = "y", pt_size = 1)
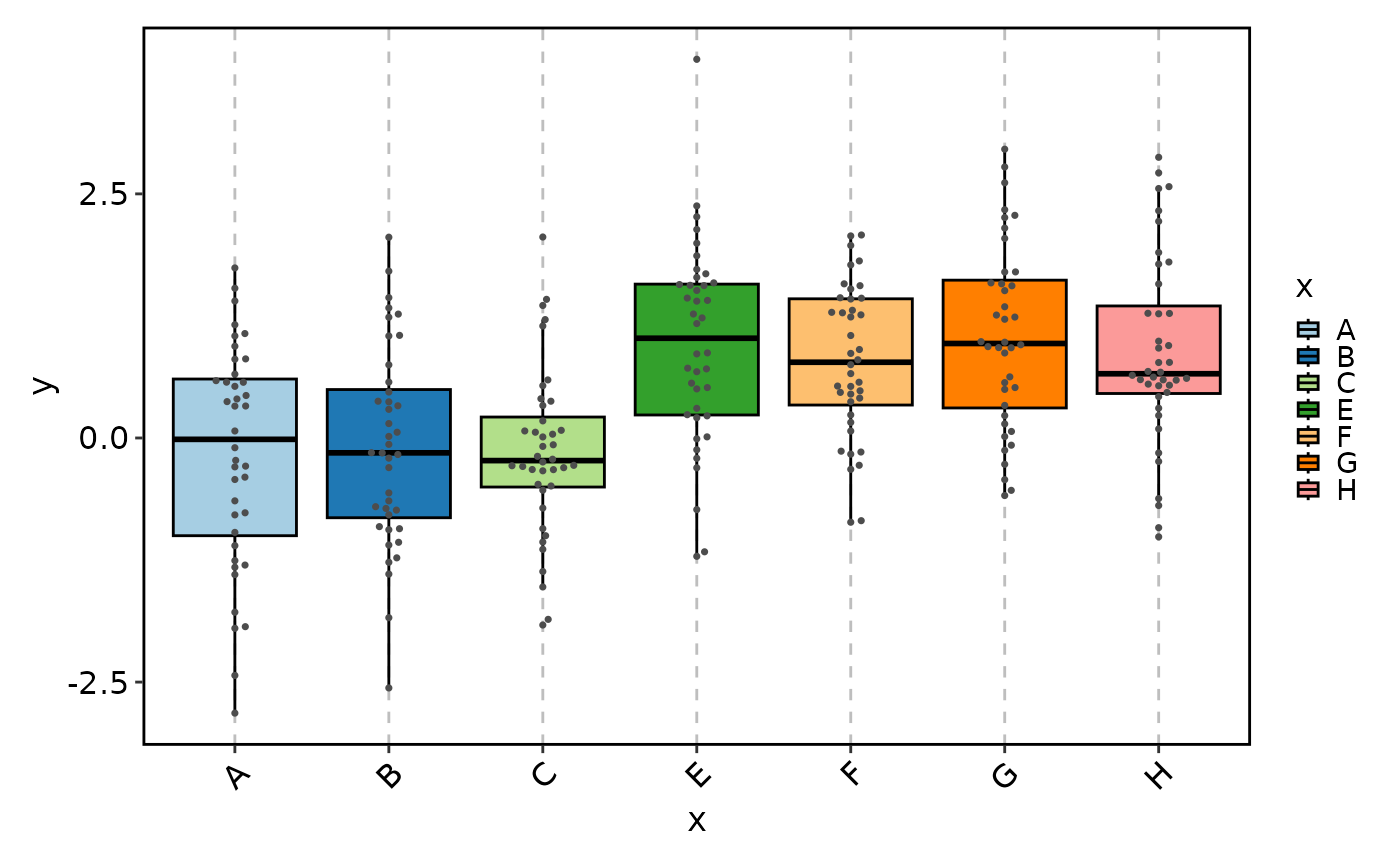
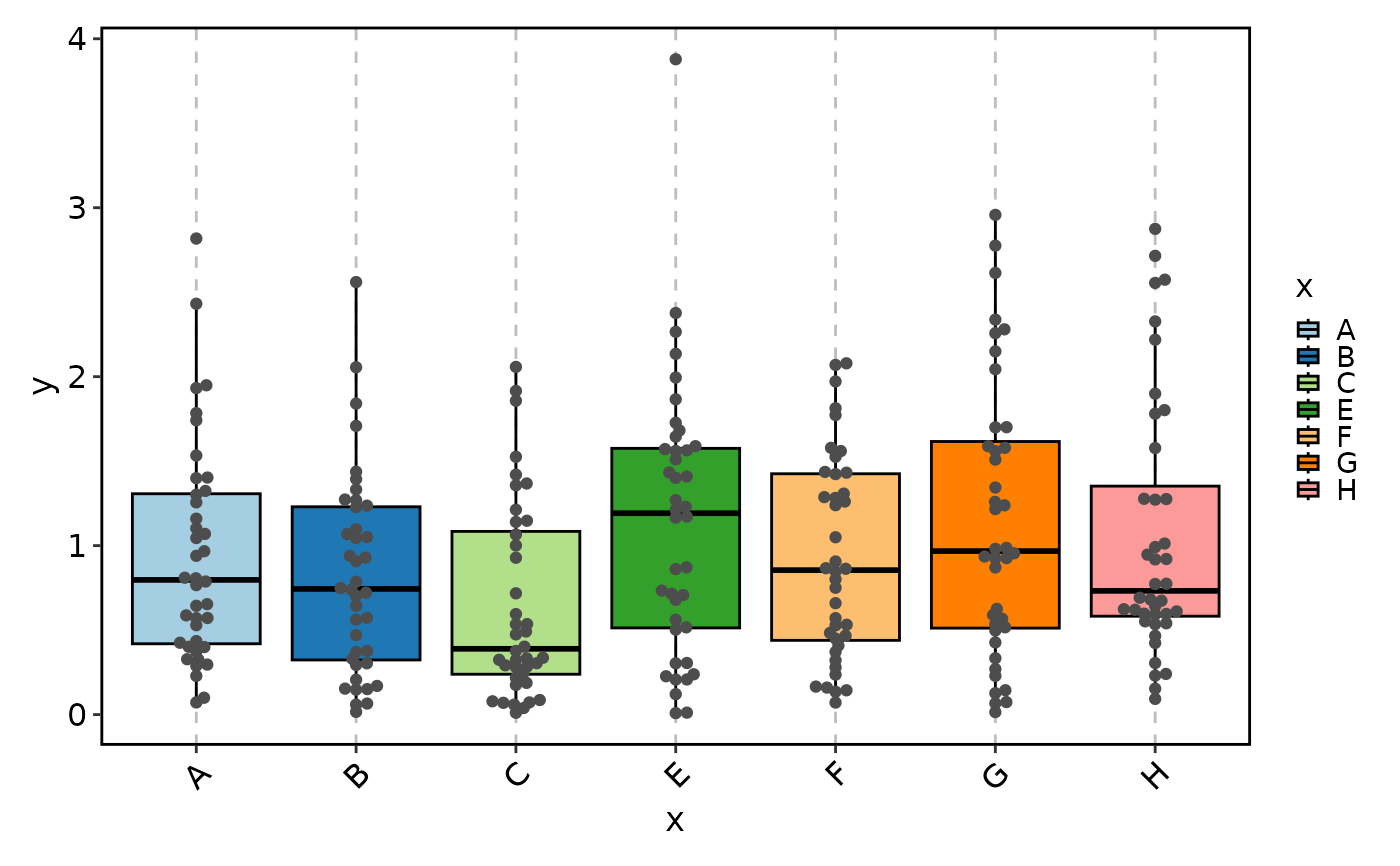
 BeeswarmPlot(data, x = "x", y = "y", add_box = TRUE, pt_color = "grey30")
 # Equivalent to:
# BoxPlot(data, x = "x", y = "y", add_beeswarm = TRUE, pt_color = "grey30")
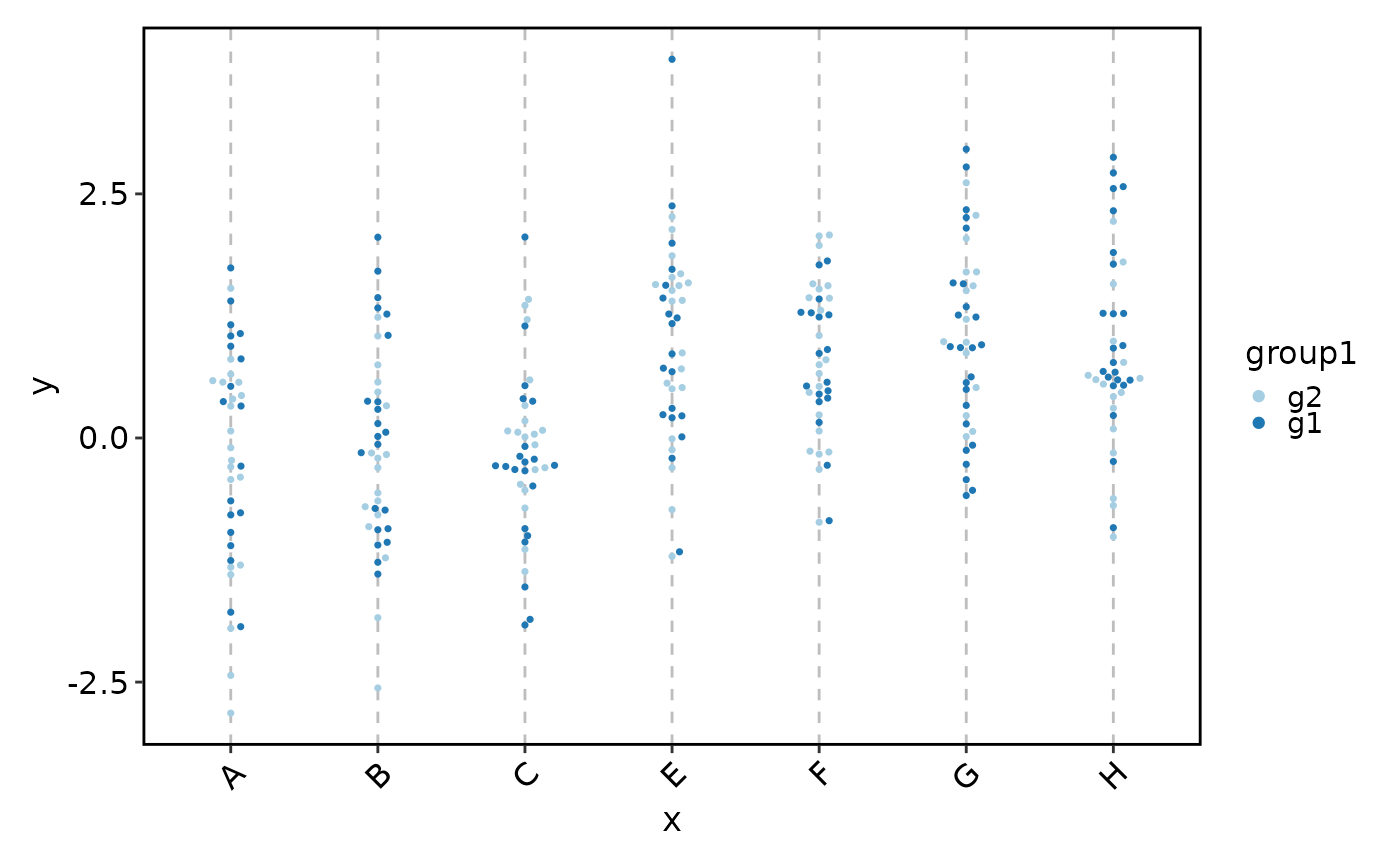
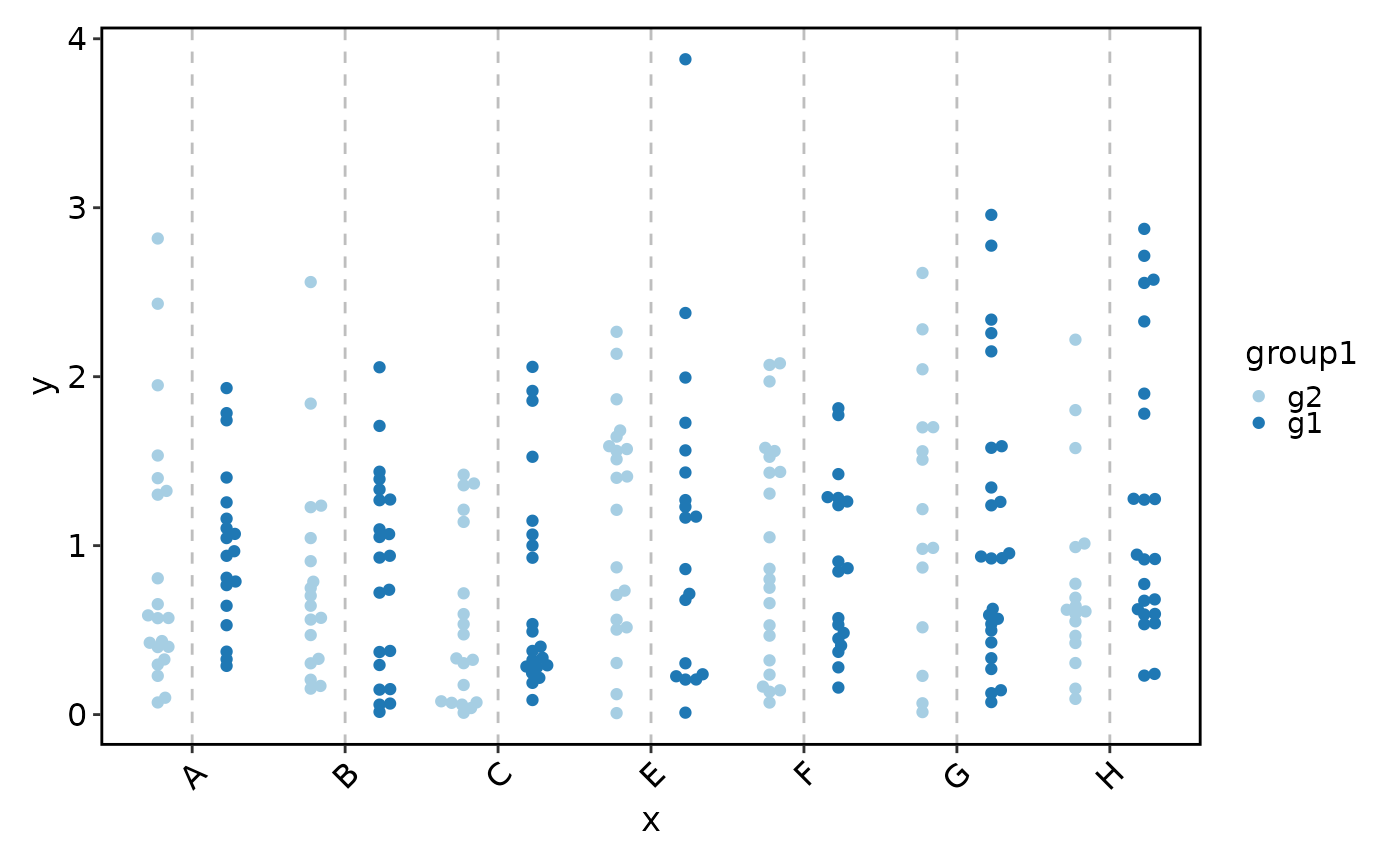
BeeswarmPlot(data, x = "x", y = "y", group_by = "group1")
# Equivalent to:
# BoxPlot(data, x = "x", y = "y", add_beeswarm = TRUE, pt_color = "grey30")
BeeswarmPlot(data, x = "x", y = "y", group_by = "group1")
 # no dodging
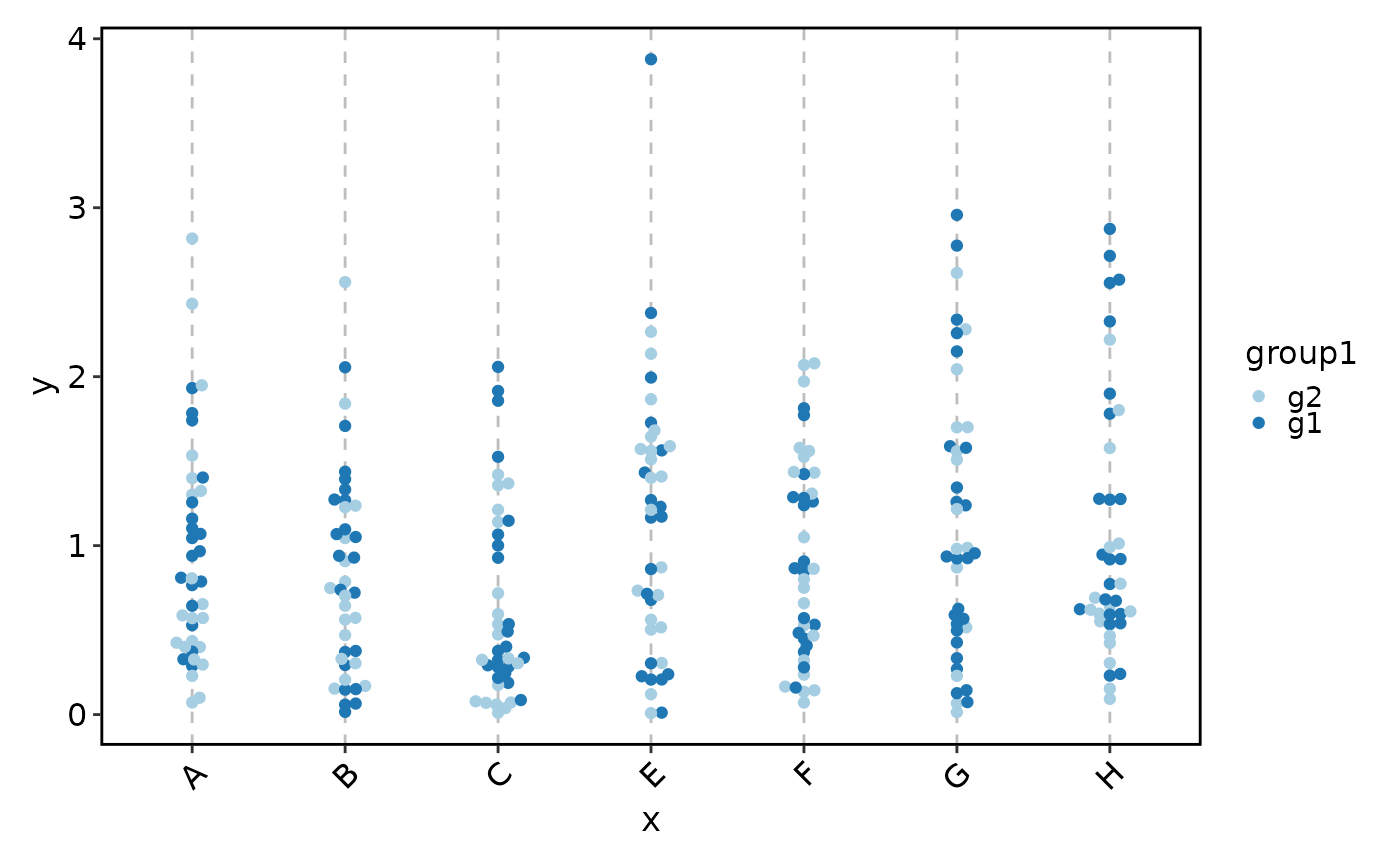
BeeswarmPlot(data, x = "x", y = "y", group_by = "group1", beeswarm_dodge = NULL)
# no dodging
BeeswarmPlot(data, x = "x", y = "y", group_by = "group1", beeswarm_dodge = NULL)
 BeeswarmPlot(data,
x = "x", y = "y", beeswarm_method = "hex",
beeswarm_cex = 2
)
#> Warning: In `position_beeswarm`, method `hex` discretizes the data axis (a.k.a the
#> continuous or non-grouped axis).
#> This may result in changes to the position of the points along that axis,
#> proportional to the value of `cex`.
#> To prevent this behavior, set `preserve.data.axis=TRUE`.
#> This warning is displayed once per session.
BeeswarmPlot(data,
x = "x", y = "y", beeswarm_method = "hex",
beeswarm_cex = 2
)
#> Warning: In `position_beeswarm`, method `hex` discretizes the data axis (a.k.a the
#> continuous or non-grouped axis).
#> This may result in changes to the position of the points along that axis,
#> proportional to the value of `cex`.
#> To prevent this behavior, set `preserve.data.axis=TRUE`.
#> This warning is displayed once per session.
 # }
# }