Visualizes clonal diversity metrics across samples or metadata groups. Clonal diversity quantifies the richness and evenness of the immune repertoire — how many distinct clonotypes are present and how evenly cells are distributed among them. High diversity indicates a broad, well-distributed repertoire; low diversity may indicate clonal expansion (oligoclonality) in response to antigen stimulation or disease.
ClonalDiversityPlot computes diversity scores using a custom
implementation that wraps several scRepertoire methods and adds
three scplotter-specific metrics (Gini coefficient, D50, DXX).
Results are visualized as bar, box, or violin plots.
Usage
ClonalDiversityPlot(
  data,
  clone_call = "gene",
  chain = "both",
  method = c("shannon", "gini.coeff", "inv.simpson", "norm.entropy", "gini.simpson",
    "chao1", "ACE", "d50", "dXX"),
  d = 50,
  plot_type = c("bar", "box", "violin"),
  position = "dodge",
  order = NULL,
  group_by = NULL,
  facet_by = NULL,
  split_by = NULL,
  xlab = NULL,
  ylab = NULL,
  ...
)
Arguments
- data
The product of
scRepertoire::combineTCR(),scRepertoire::combineBCR(), orscRepertoire::combineExpression().- clone_call
How to define a clone. One of
"gene"(default),"nt","aa","strict", or a custom variable name in the data.- chain
Which chain(s) to use:
"both"(default),"TRA","TRB","TRD","TRG","IGH", or"IGL".- method
The diversity metric to compute. One of
"shannon"(default),"inv.simpson","norm.entropy","gini.simpson","chao1","ACE","gini.coeff","d50", or"dXX". See the Diversity metrics section for details on each metric.- d
The percentage threshold for the
"dXX"method. For example,d = 90computes the number of clones accounting for 90% of the repertoire. Default is50.- plot_type
The visualization type. One of
"bar"(default),"box", or"violin". For"box"and"violin",group_byis required to provide the x-axis grouping.- position
Bar position adjustment for
"bar"plot type. One of"dodge"(default),"stack", or"fill".- order
A named list controlling the order of factor levels. List names are column names; list values are the desired order. Default is
NULL.- group_by
Metadata column used to group (color) the data. Default is
NULL. Required for"box"and"violin"plot types.- facet_by
Metadata column used to facet the plot into separate panels. Default is
NULL.- split_by
Metadata column used to split the data into separate plots. Default is
NULL.- xlab
X-axis label. Default is
NULL, which uses thegroup_bycolumn name or"Sample".- ylab
Y-axis label. Default is
NULL, which auto-generates the full metric name (e.g.,"Shannon Index","Gini Coefficient").- ...
Additional arguments passed to the underlying plotthis function:
"bar"—plotthis::BarPlot()(palette,alpha,fill_by, ...)"box"—plotthis::BoxPlot()(comparisons,alpha,palette, ...)"violin"—plotthis::ViolinPlot()(add_box,comparisons,palette, ...)
Note
Bootstrap support: The underlying ClonalDiversity() function
supports bootstrap resampling (n_boots). This is not exposed in
ClonalDiversityPlot directly but is used internally.
group_by required for box/violin: The group_by parameter is
required when plot_type is "box" or "violin". These types show
per-sample distributions grouped by the group_by variable.
Diversity metrics
The method parameter selects the diversity metric:
Richness and evenness metrics:
"shannon"(default) — Shannon entropy index. Higher values indicate greater diversity. Sensitive to both richness and evenness."inv.simpson"— Inverse Simpson index. The effective number of equally abundant clones. Less sensitive to rare clones than Shannon."norm.entropy"— Normalized entropy (Pielou's evenness). Shannon entropy divided by the log of richness; ranges from 0 to 1."gini.simpson"— Gini-Simpson index. The probability that two randomly selected cells belong to different clones.
Richness estimators (account for unobserved clones):
"chao1"— Chao1 richness estimator. Estimates the total number of clones including those not yet observed, based on the number of singletons and doubletons."ACE"— Abundance-based Coverage Estimator. Estimates richness with a correction for sample coverage.
scplotter-specific metrics:
"gini.coeff"— Gini coefficient. Measures inequality in clone size distribution.0indicates perfect equality (all clones the same size);1indicates perfect inequality (one clone dominates)."d50"— The number of top clones that together account for 50% of the total repertoire."dXX"— The number of top clones that together account forXX% of the total repertoire. Use thedparameter to set the percentage.
Examples
set.seed(8525)
data(contig_list, package = "scRepertoire")
data <- scRepertoire::combineTCR(contig_list,
samples = c("P17B", "P17L", "P18B", "P18L", "P19B","P19L", "P20B", "P20L"))
data <- scRepertoire::addVariable(data,
variable.name = "Type",
variables = factor(rep(c("B", "L"), 4), levels = c("L", "B"))
)
data <- scRepertoire::addVariable(data,
variable.name = "Subject",
variables = rep(c("P17", "P18", "P19", "P20"), each = 2)
)
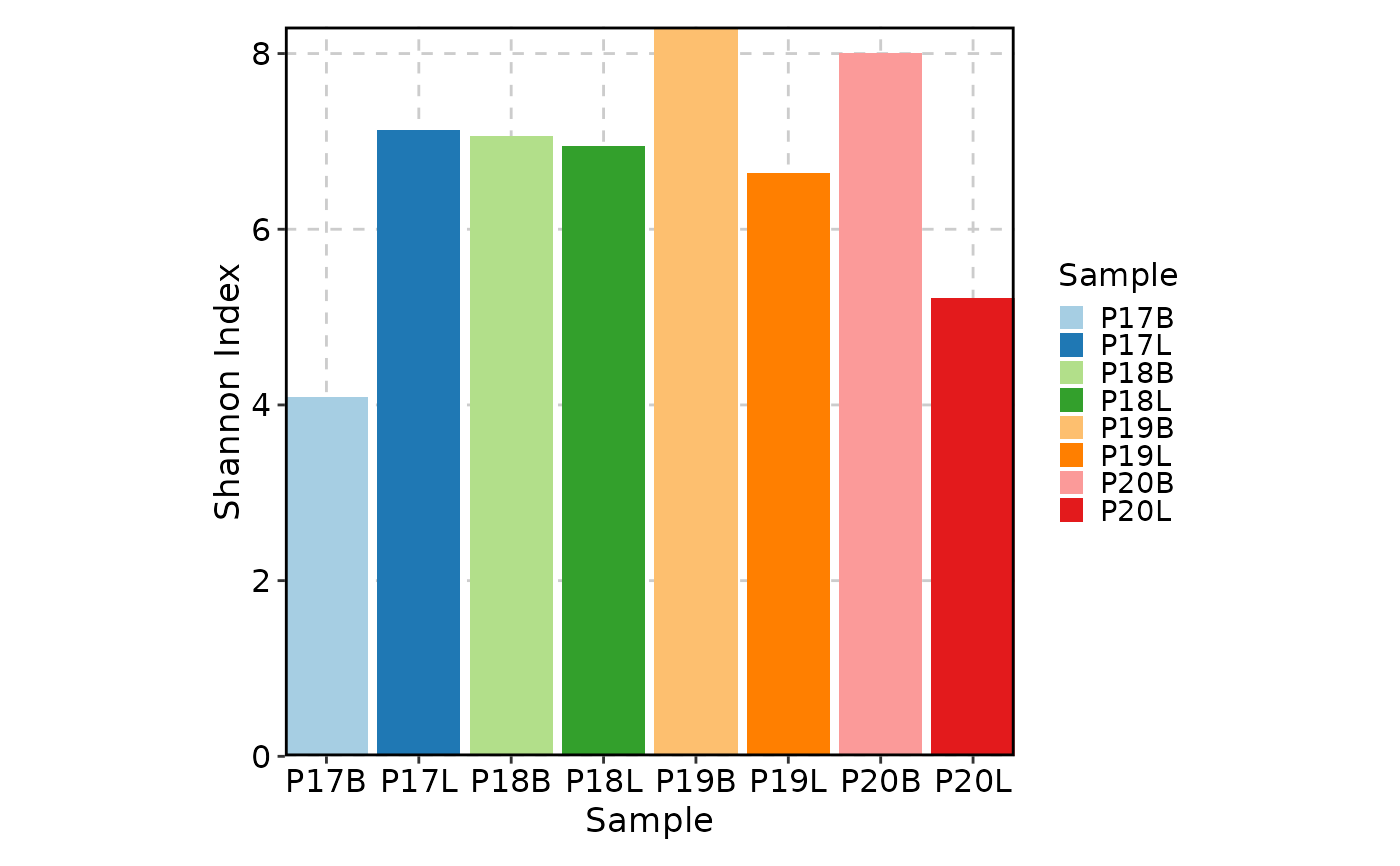
ClonalDiversityPlot(data)
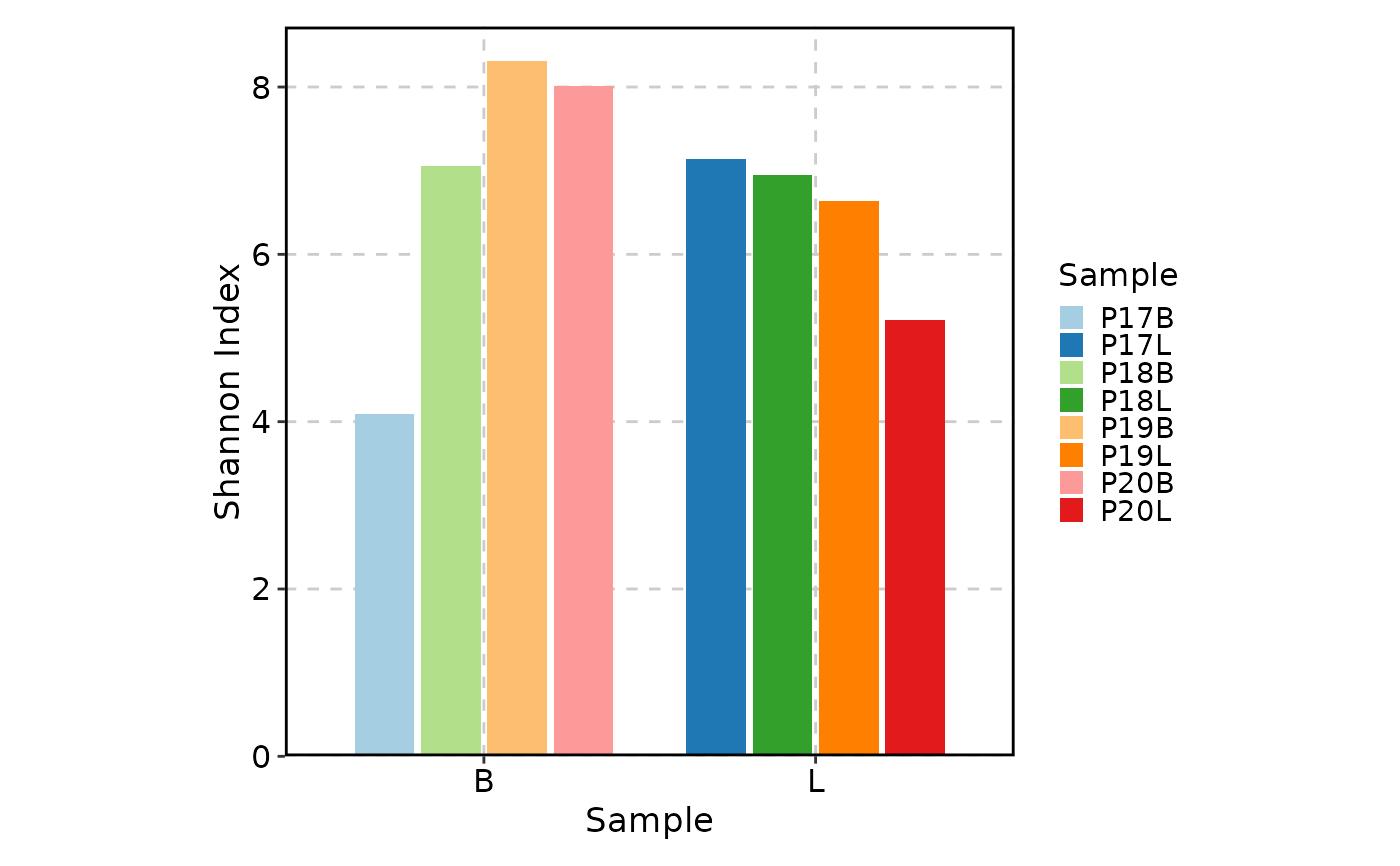
 ClonalDiversityPlot(data, group_by = "Type")
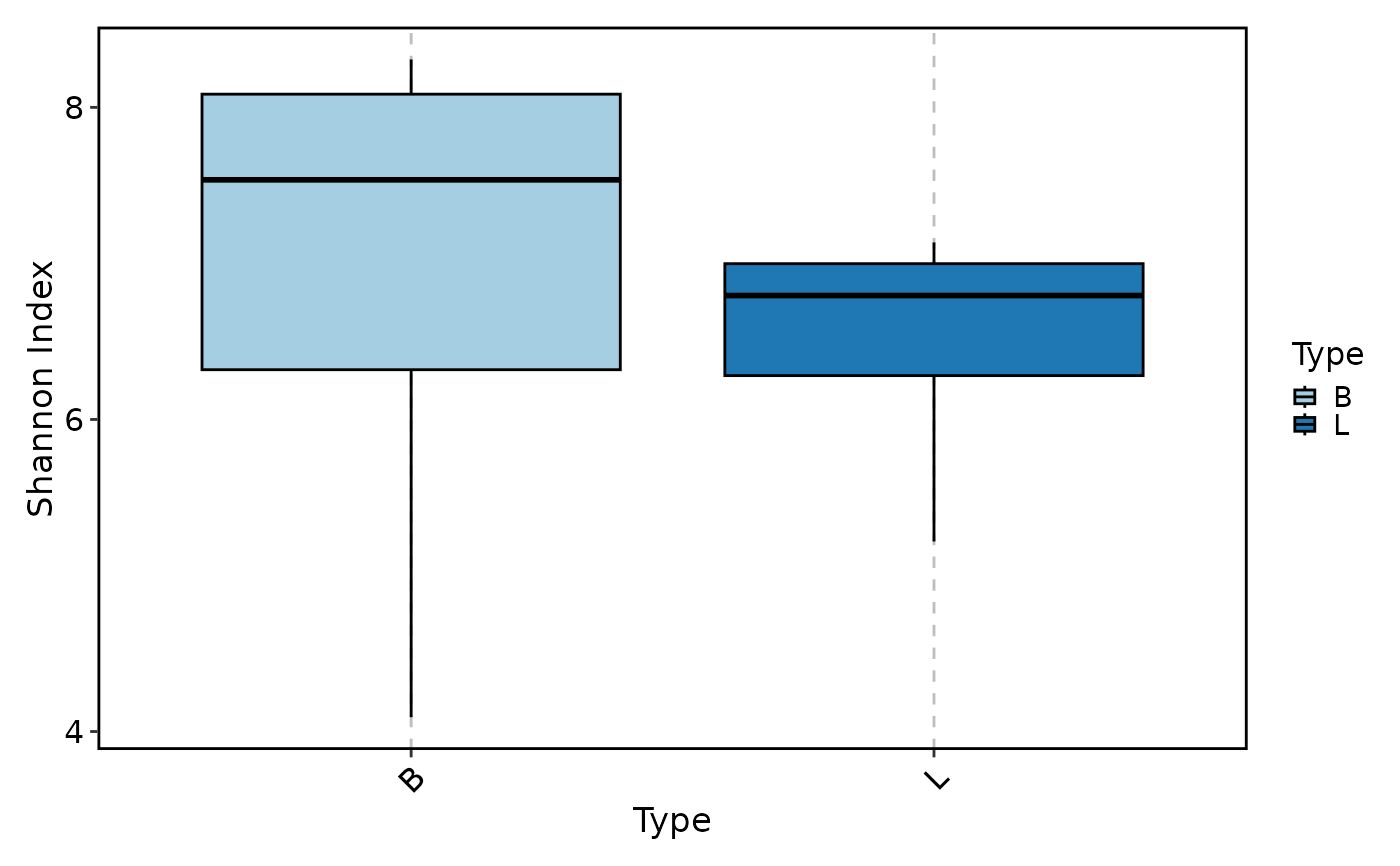
 ClonalDiversityPlot(data, group_by = "Type", plot_type = "box")
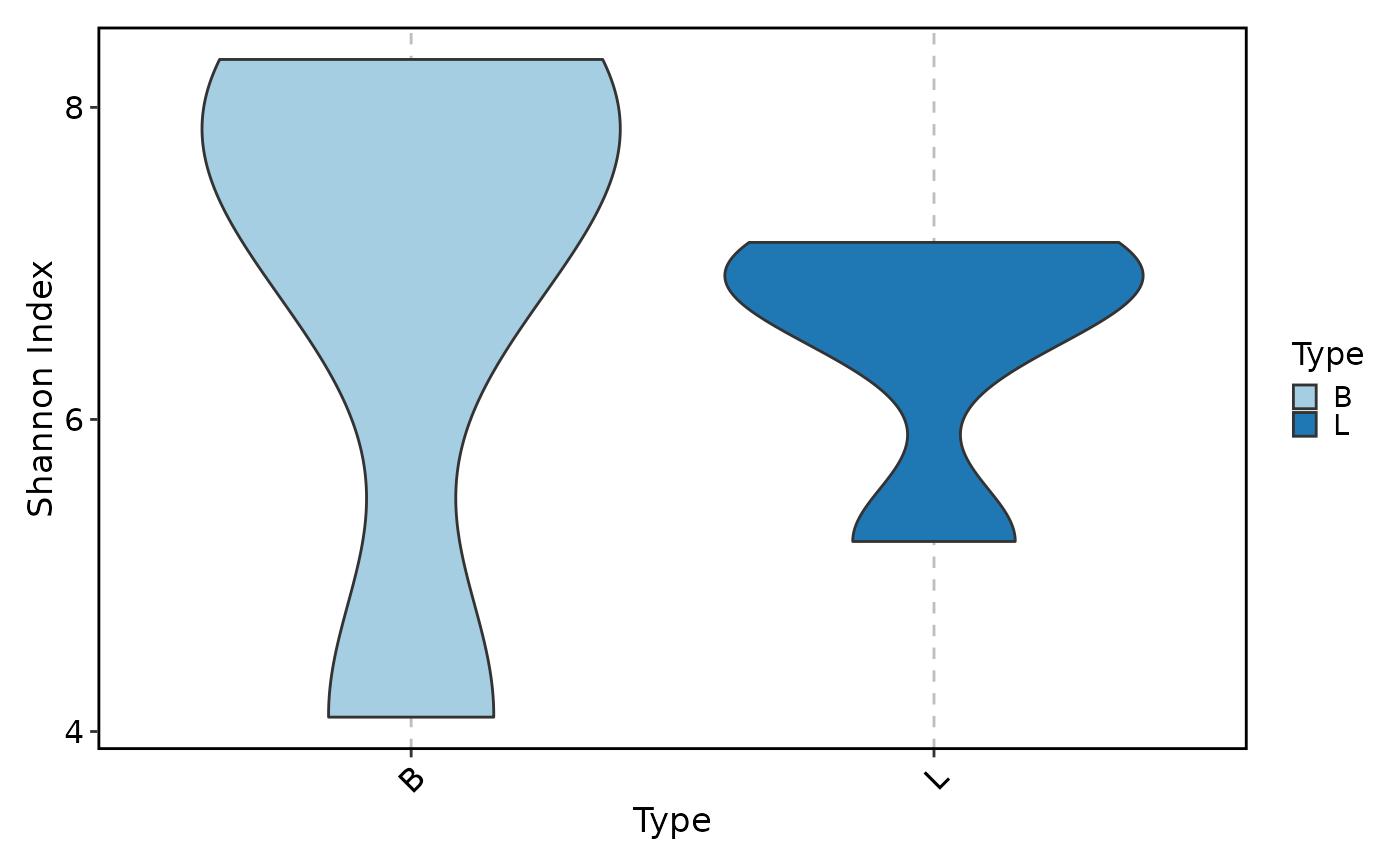
 ClonalDiversityPlot(data, group_by = "Type", plot_type = "violin")
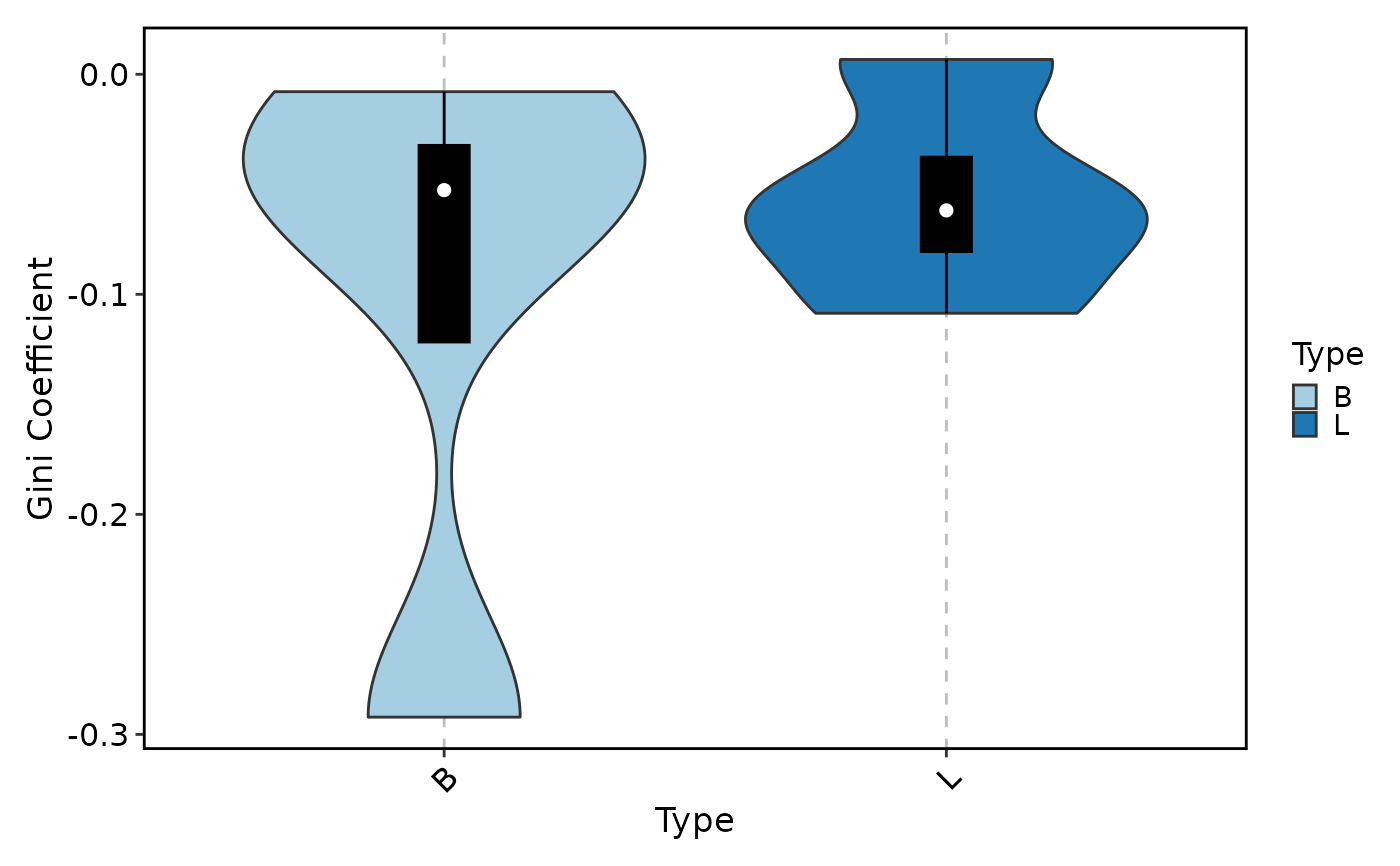
 ClonalDiversityPlot(data, group_by = "Type", plot_type = "violin",
method = "gini.coeff", add_box = TRUE)
ClonalDiversityPlot(data, group_by = "Type", plot_type = "violin",
method = "gini.coeff", add_box = TRUE)
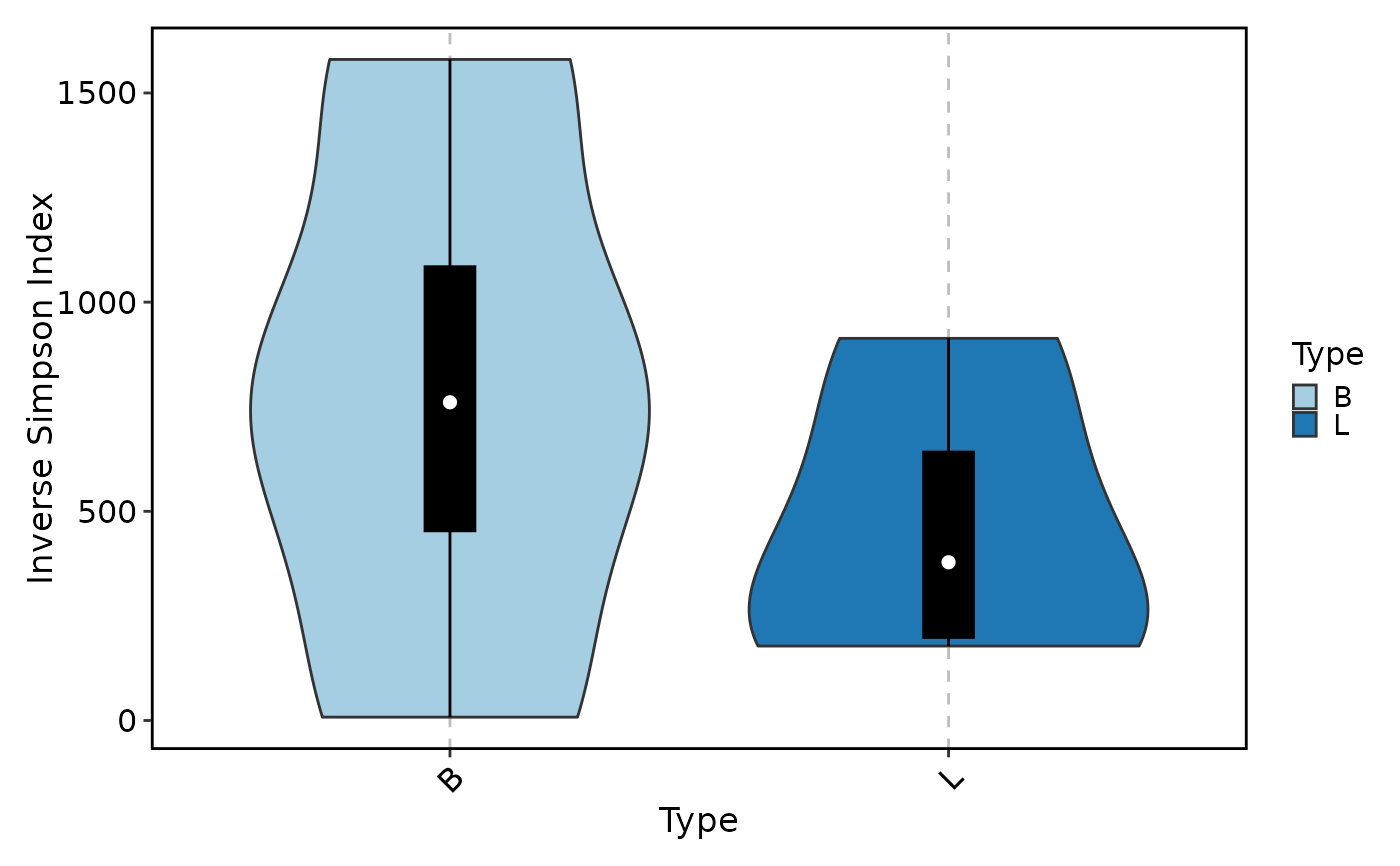
 ClonalDiversityPlot(data, group_by = "Type", plot_type = "violin",
method = "inv.simpson", add_box = TRUE)
ClonalDiversityPlot(data, group_by = "Type", plot_type = "violin",
method = "inv.simpson", add_box = TRUE)
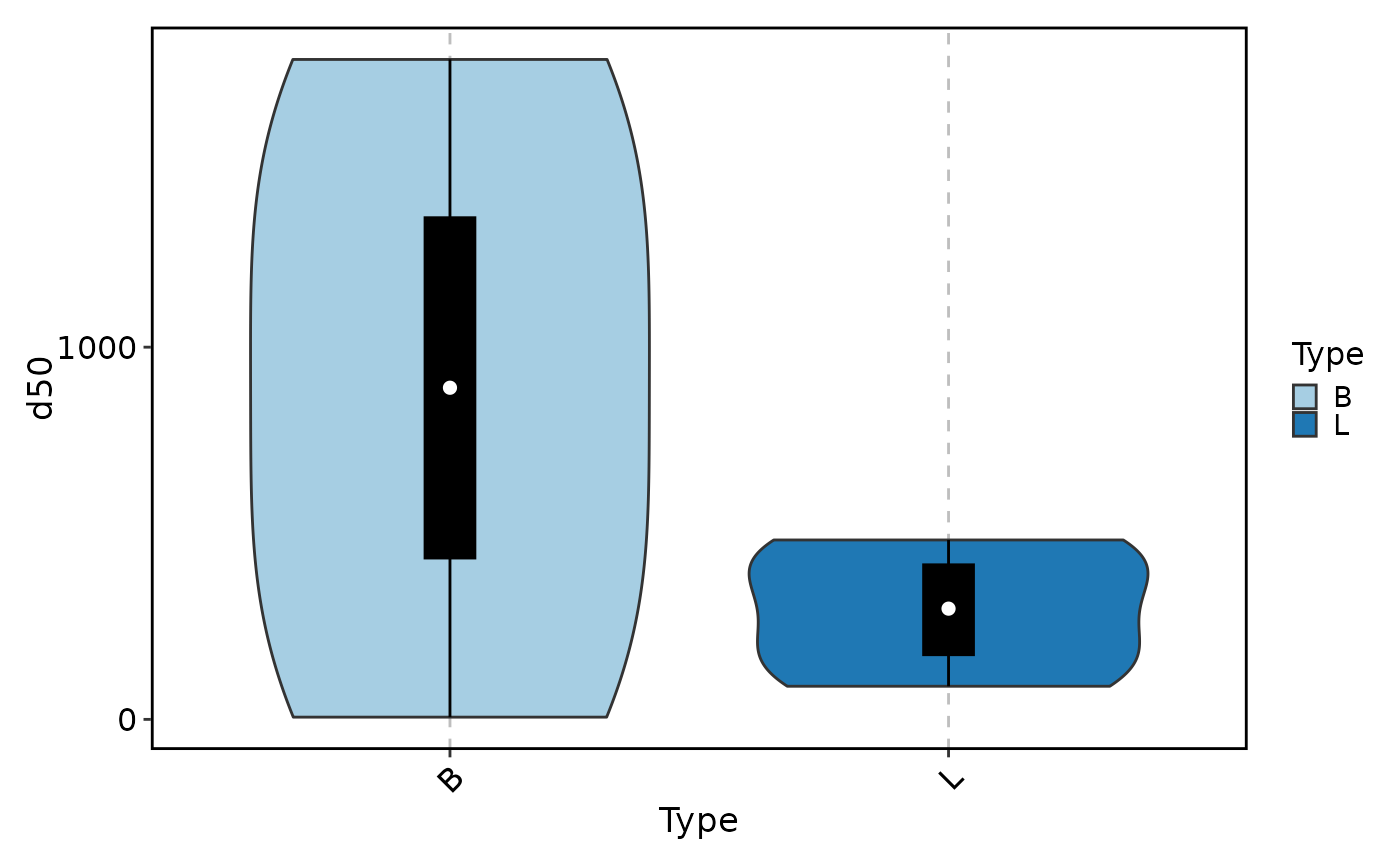
 ClonalDiversityPlot(data, group_by = "Type", plot_type = "violin",
method = "d50", add_box = TRUE)
ClonalDiversityPlot(data, group_by = "Type", plot_type = "violin",
method = "d50", add_box = TRUE)