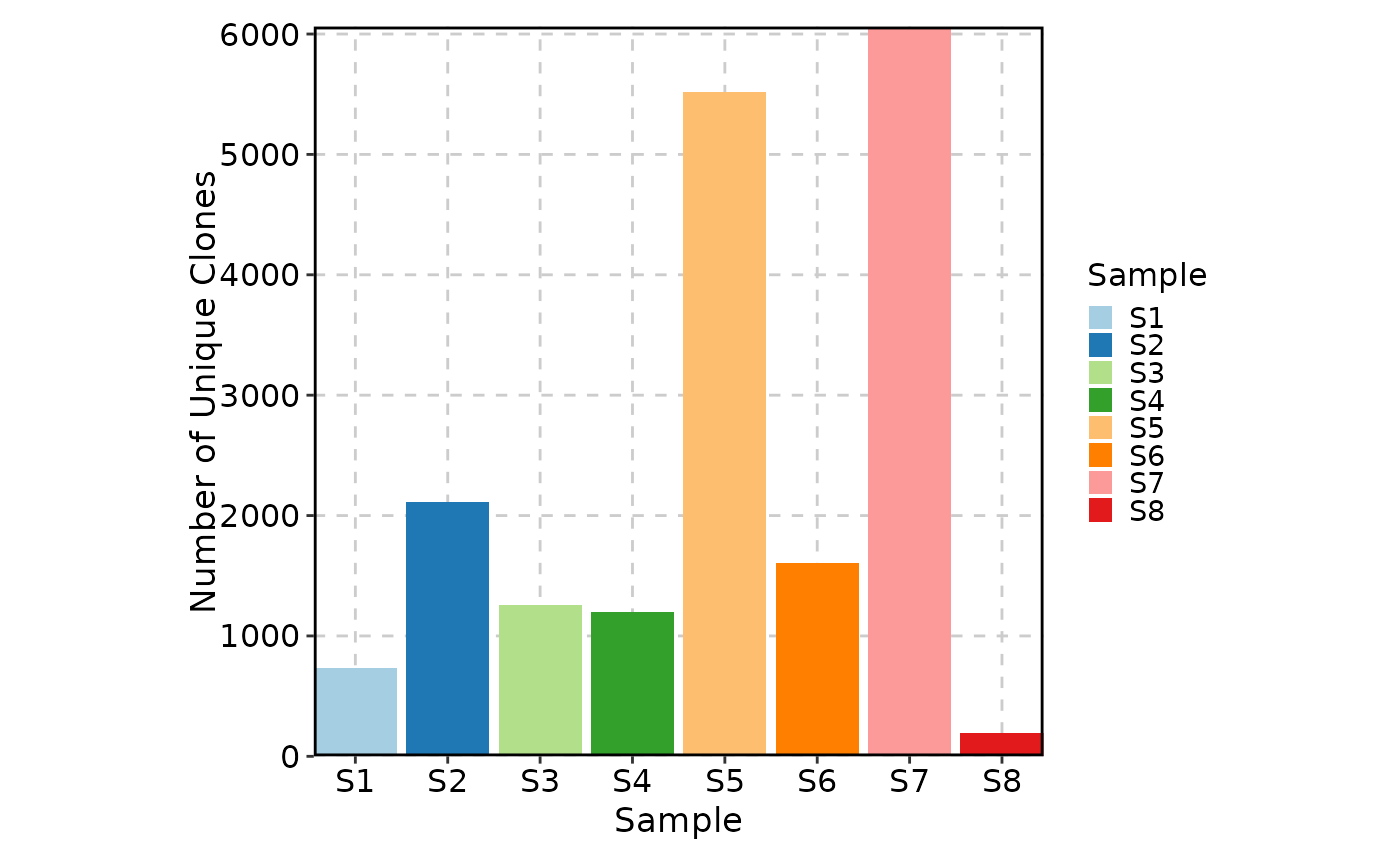
Visualizes the number (or fraction) of unique T-cell or B-cell clones across samples and metadata groups. Clonal volume — the count of distinct clonotypes detected in a sample — is a fundamental measure of immune repertoire diversity. Higher clonal volume indicates a more diverse repertoire, while lower volume may reflect clonal expansion in response to antigen stimulation.
ClonalVolumePlot computes clonal counts via
scRepertoire::clonalQuant() and
visualizes them as bar, box, or violin plots. It accepts both
scRepertoire combined TCR/BCR data and Seurat objects with clonal
information integrated via scRepertoire::combineExpression().
Usage
ClonalVolumePlot(
  data,
  clone_call = "aa",
  chain = "both",
  scale = FALSE,
  plot_type = c("bar", "box", "violin"),
  x = "Sample",
  group_by = NULL,
  facet_by = NULL,
  split_by = NULL,
  order = NULL,
  ylab = NULL,
  ...
)
Arguments
- data
The product of
scRepertoire::combineTCR(),scRepertoire::combineBCR(), orscRepertoire::combineExpression().- clone_call
How to define a clone. One of:
"gene"— V(D)JC gene combination"nt"— CDR3 nucleotide sequence"aa"— CDR3 amino acid sequence (default)"strict"— V(D)JC gene + CDR3 nucleotide
Or a custom variable name in the data.
- chain
Which chain(s) to use:
"both"(default),"TRA","TRB","TRD","TRG","IGH", or"IGL".- scale
Logical; if
TRUE, values are scaled to clone proportion (fraction of unique clones) instead of absolute clone counts. Default isFALSE.- plot_type
The visualization type. One of
"bar"(default),"box", or"violin". For"box"and"violin", the data is broken down by Sample and grouped bygroup_byto show per-sample distributions.- x
The metadata column used as the x-axis. Default is
"Sample".- group_by
Metadata column used to group (color) the data. Default is
NULL.- facet_by
Metadata column used to facet the plot into separate panels. Default is
NULL.- split_by
Metadata column used to split the data into separate plots. Default is
NULL.- order
A named list controlling the order of factor levels. List names are column names; list values are the desired order. Default is
NULL(use existing factor levels or alphabetical order).- ylab
Y-axis label. Default is
NULL, which auto-generates"Number of Unique Clones"or"Fraction of Unique Clones"depending onscale.- ...
Additional arguments passed to the underlying plotthis function:
"bar"—plotthis::BarPlot()(position,palette,fill_by, ...)"box"—plotthis::BoxPlot()(comparisons,alpha,palette, ...)"violin"—plotthis::ViolinPlot()(add_box,comparisons,palette, ...)
Examples
# \donttest{
set.seed(8525)
data(contig_list, package = "scRepertoire")
data <- scRepertoire::combineTCR(contig_list)
data <- scRepertoire::addVariable(data,
variable.name = "Type",
variables = factor(sample(c("B", "L"), 8, replace = TRUE), levels = c("B", "L"))
)
data <- scRepertoire::addVariable(data,
variable.name = "Sex",
variables = factor(sample(c("M", "F"), 8, replace = TRUE), levels = c("M", "F"))
)
ClonalVolumePlot(data)
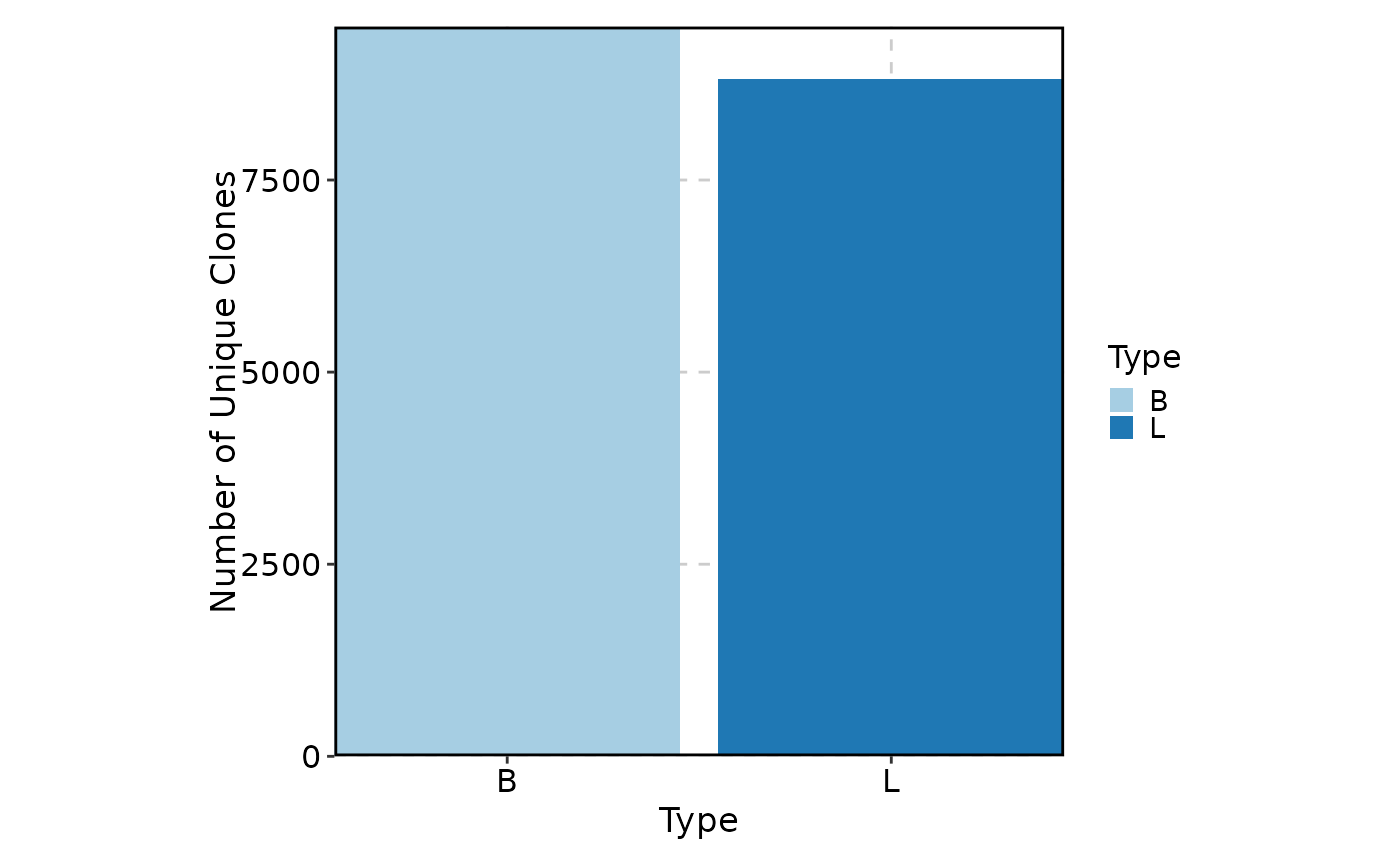
 ClonalVolumePlot(data, x = "Type")
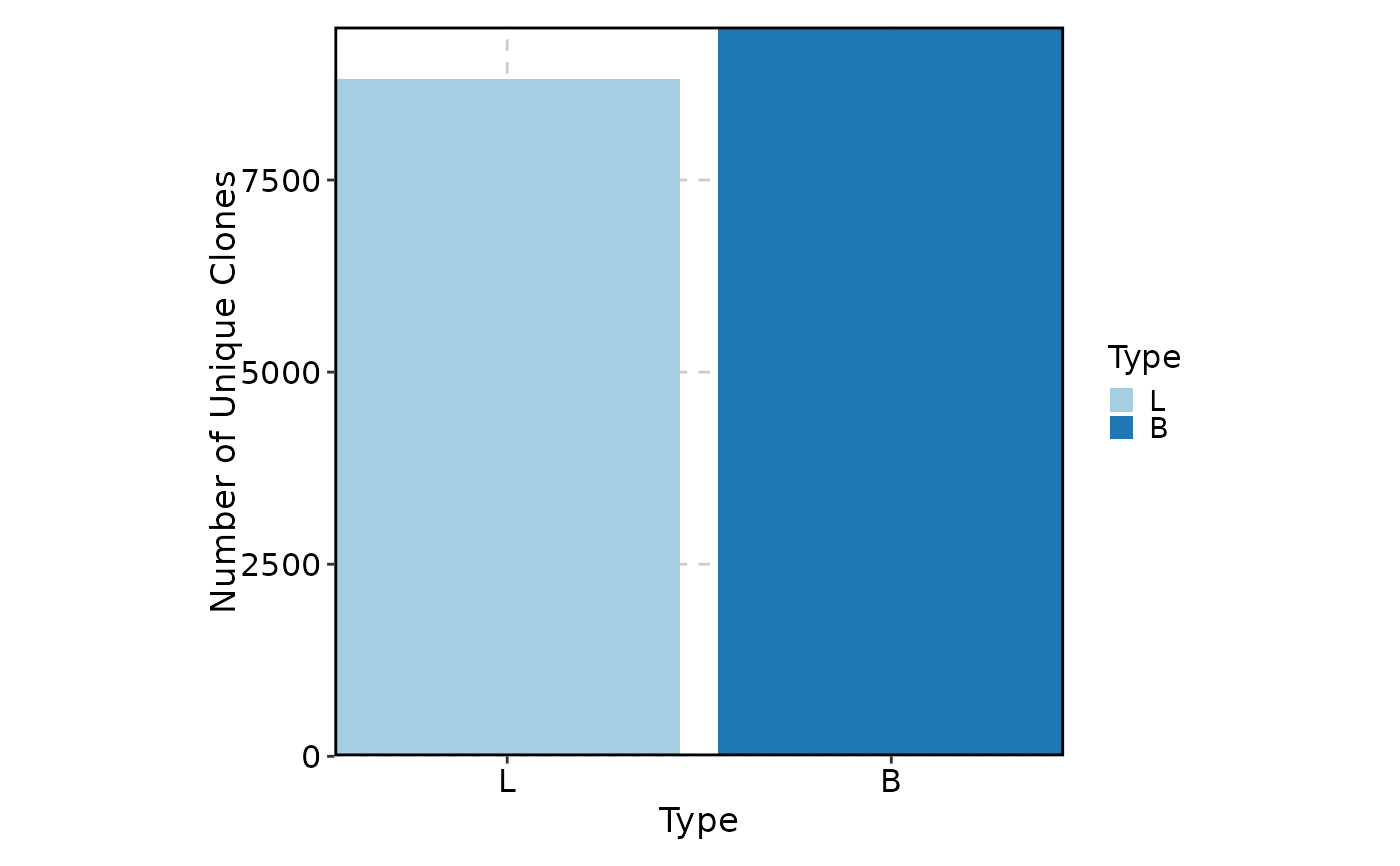
 ClonalVolumePlot(data, x = "Type", order = list(Type = c("L", "B")))
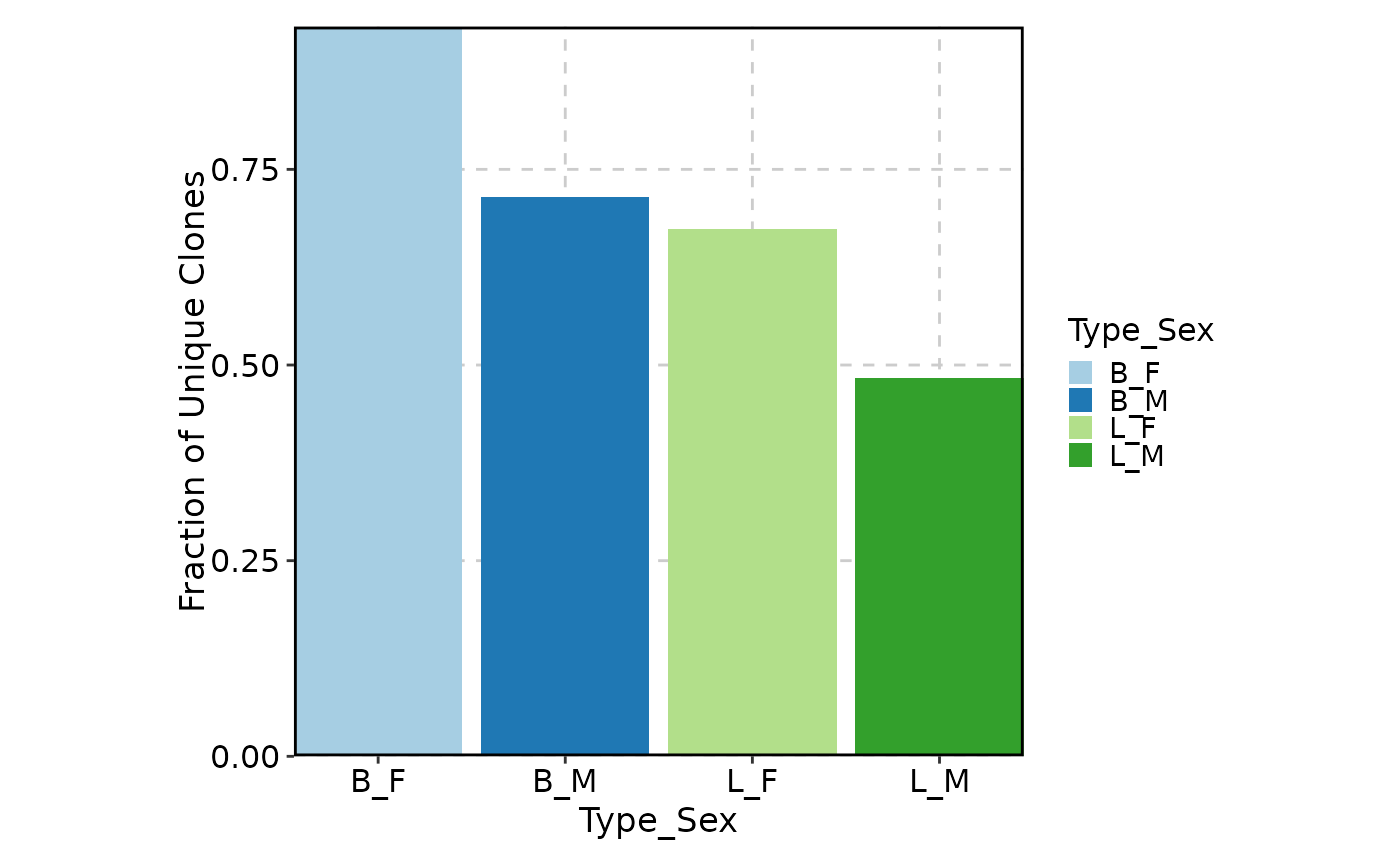
 ClonalVolumePlot(data, x = c("Type", "Sex"), scale = TRUE, fill_by = "Type")
#> Multiple columns are provided in 'x'. They will be concatenated into one column.
ClonalVolumePlot(data, x = c("Type", "Sex"), scale = TRUE, fill_by = "Type")
#> Multiple columns are provided in 'x'. They will be concatenated into one column.
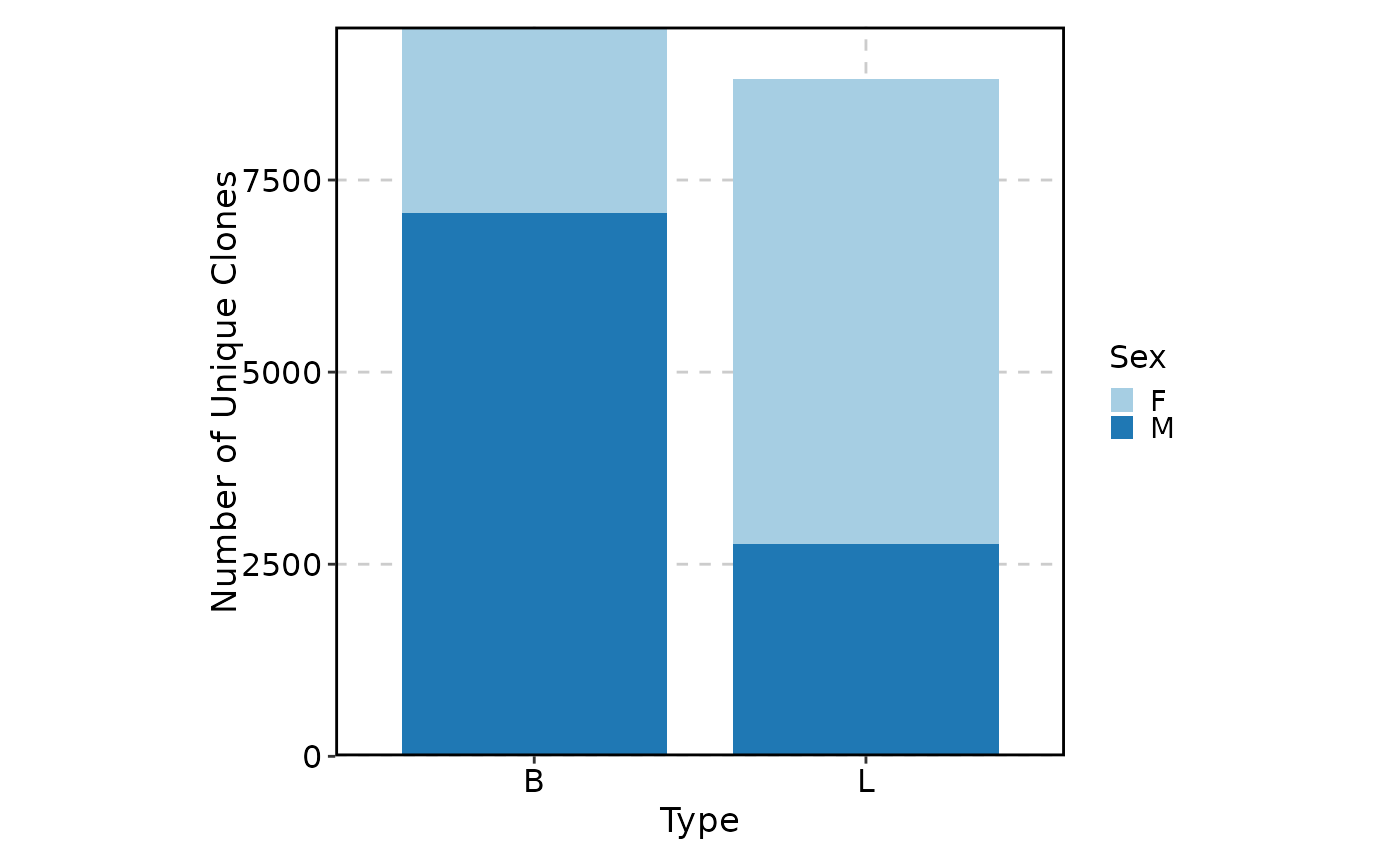
 ClonalVolumePlot(data, x = "Type", group_by = "Sex", position = "stack")
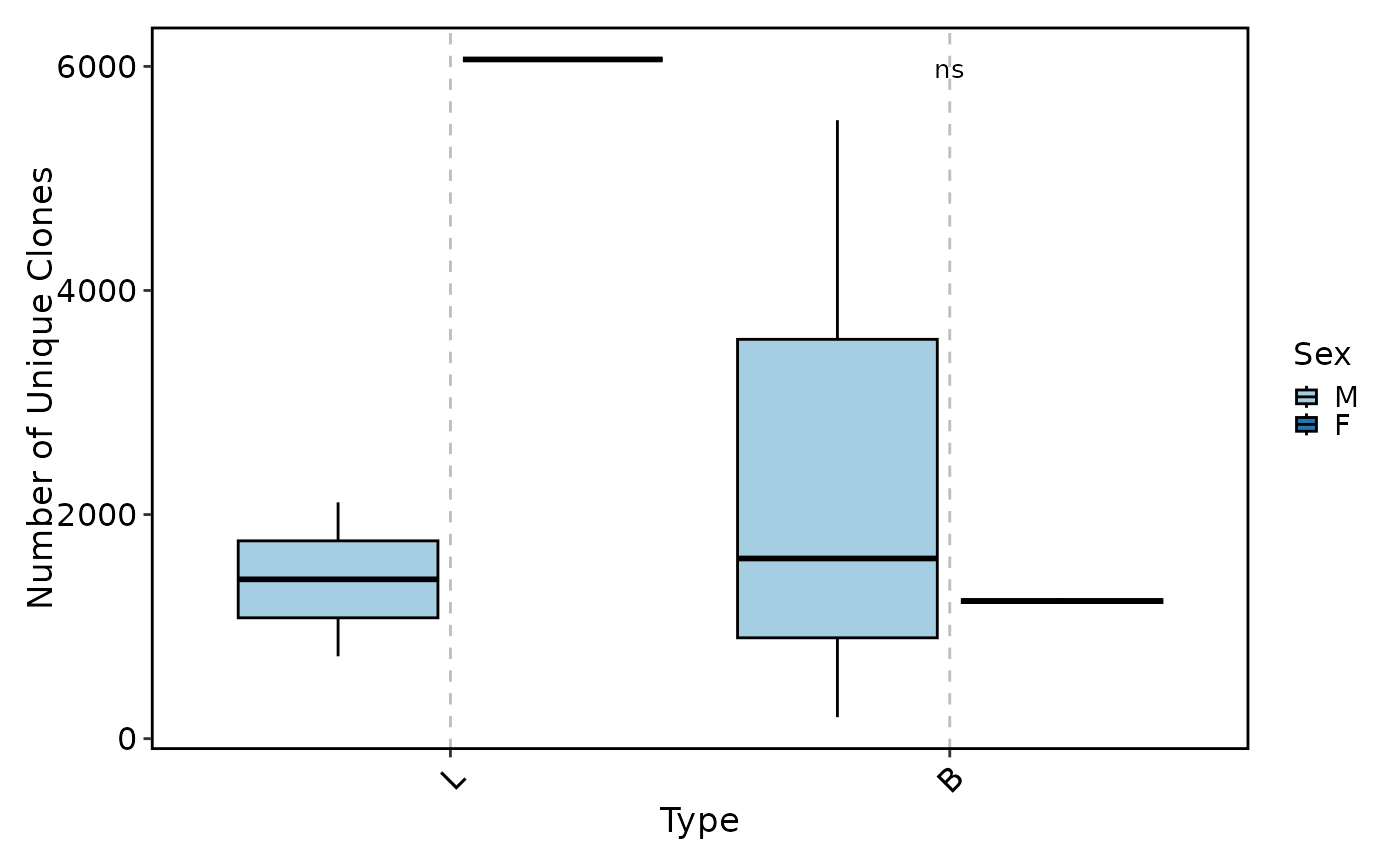
 ClonalVolumePlot(data,
plot_type = "box", x = "Type", comparisons = TRUE,
group_by = "Sex"
)
#> Warning: [Box/Violin/BeeswarmPlot] Some pairwise comparisons may fail due to insufficient data points or variability. Adjusting data to ensure valid comparisons.
ClonalVolumePlot(data,
plot_type = "box", x = "Type", comparisons = TRUE,
group_by = "Sex"
)
#> Warning: [Box/Violin/BeeswarmPlot] Some pairwise comparisons may fail due to insufficient data points or variability. Adjusting data to ensure valid comparisons.
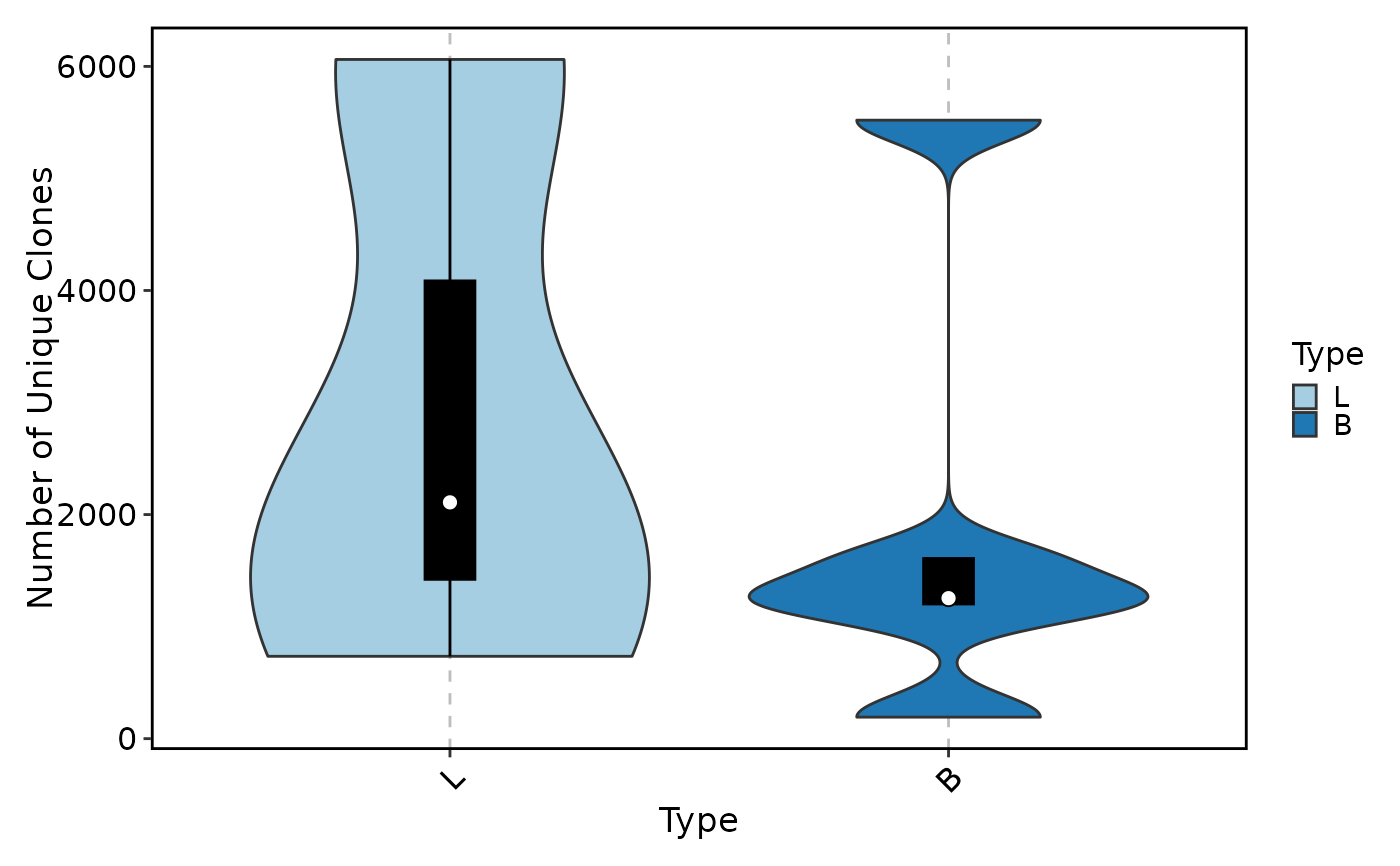
 ClonalVolumePlot(data, plot_type = "violin", x = "Type", add_box = TRUE)
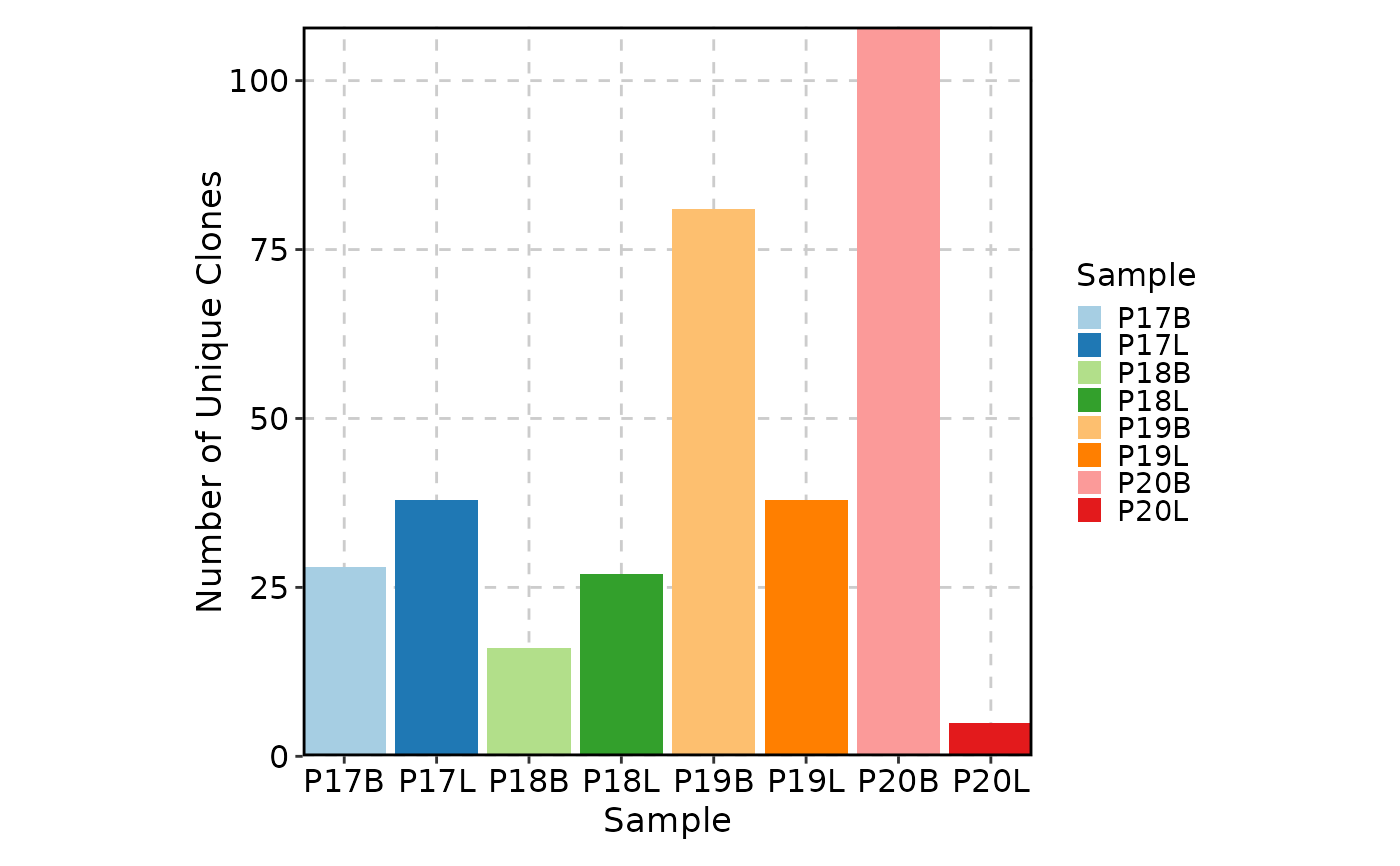
 # on a Seurat object
data(scRep_example, package = "scRepertoire")
data(contig_list, package = "scRepertoire")
combined <- scRepertoire::combineTCR(contig_list,
samples = c("P17B", "P17L", "P18B", "P18L", "P19B", "P19L", "P20B", "P20L")
)
sobj <- scRepertoire::combineExpression(combined, scRep_example)
ClonalVolumePlot(sobj)
#> Warning: The 'Sample' column is not found in the meta data, 'orig.indent' will be used instead.
# on a Seurat object
data(scRep_example, package = "scRepertoire")
data(contig_list, package = "scRepertoire")
combined <- scRepertoire::combineTCR(contig_list,
samples = c("P17B", "P17L", "P18B", "P18L", "P19B", "P19L", "P20B", "P20L")
)
sobj <- scRepertoire::combineExpression(combined, scRep_example)
ClonalVolumePlot(sobj)
#> Warning: The 'Sample' column is not found in the meta data, 'orig.indent' will be used instead.
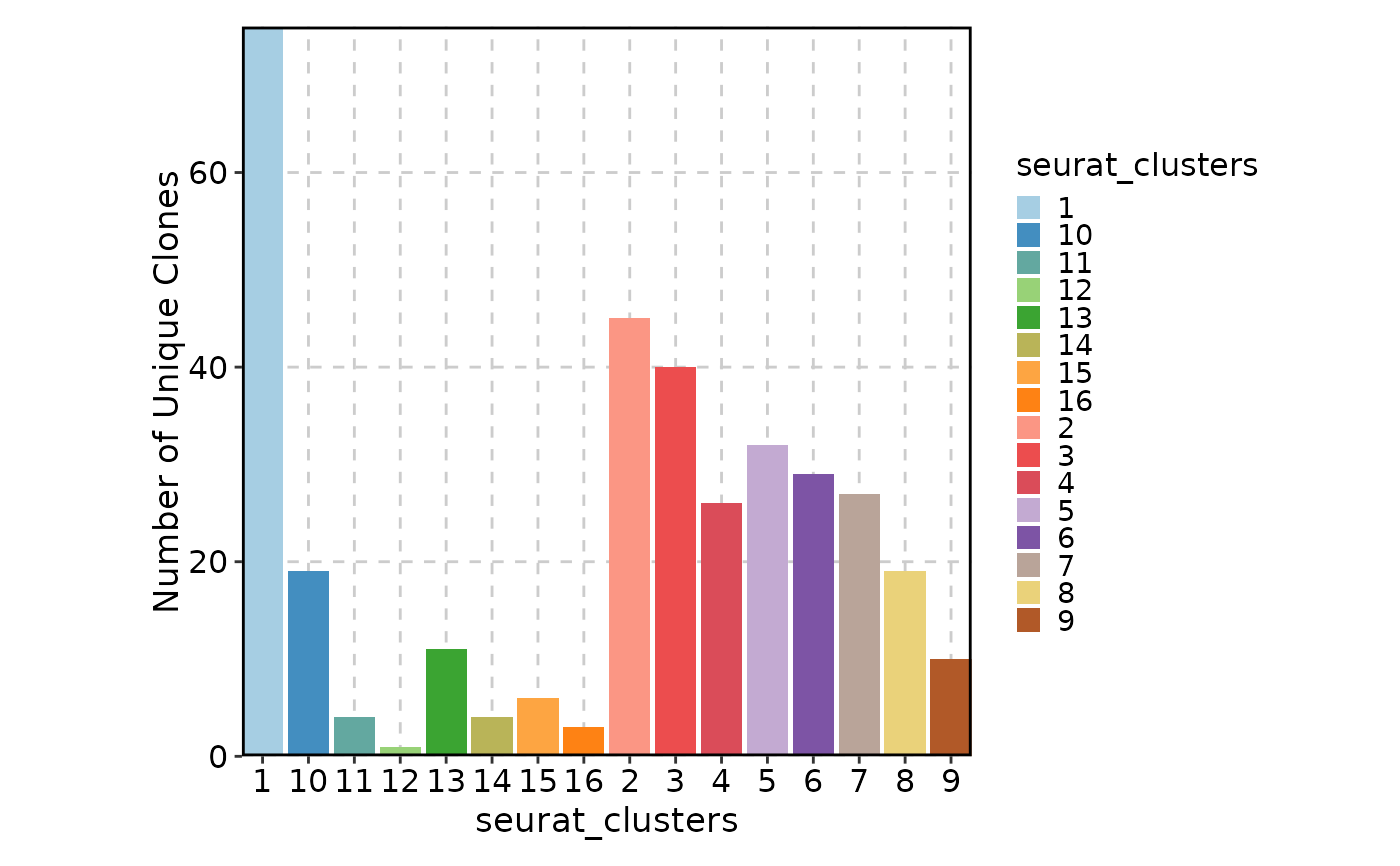
 ClonalVolumePlot(sobj, x = "seurat_clusters")
#> Warning: The 'Sample' column is not found in the meta data, 'orig.indent' will be used instead.
ClonalVolumePlot(sobj, x = "seurat_clusters")
#> Warning: The 'Sample' column is not found in the meta data, 'orig.indent' will be used instead.
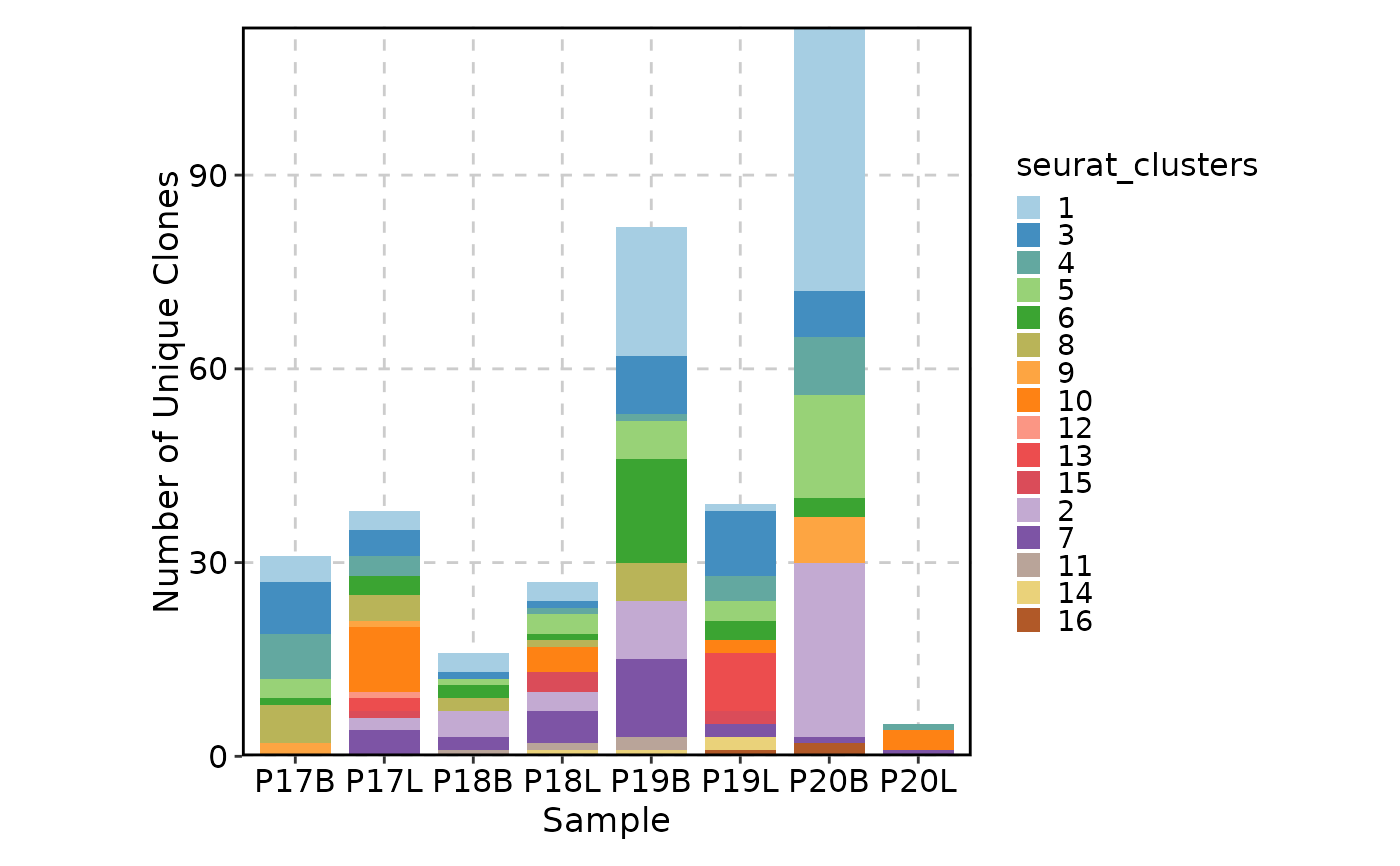
 ClonalVolumePlot(sobj, group_by = "seurat_clusters")
#> Warning: The 'Sample' column is not found in the meta data, 'orig.indent' will be used instead.
ClonalVolumePlot(sobj, group_by = "seurat_clusters")
#> Warning: The 'Sample' column is not found in the meta data, 'orig.indent' will be used instead.
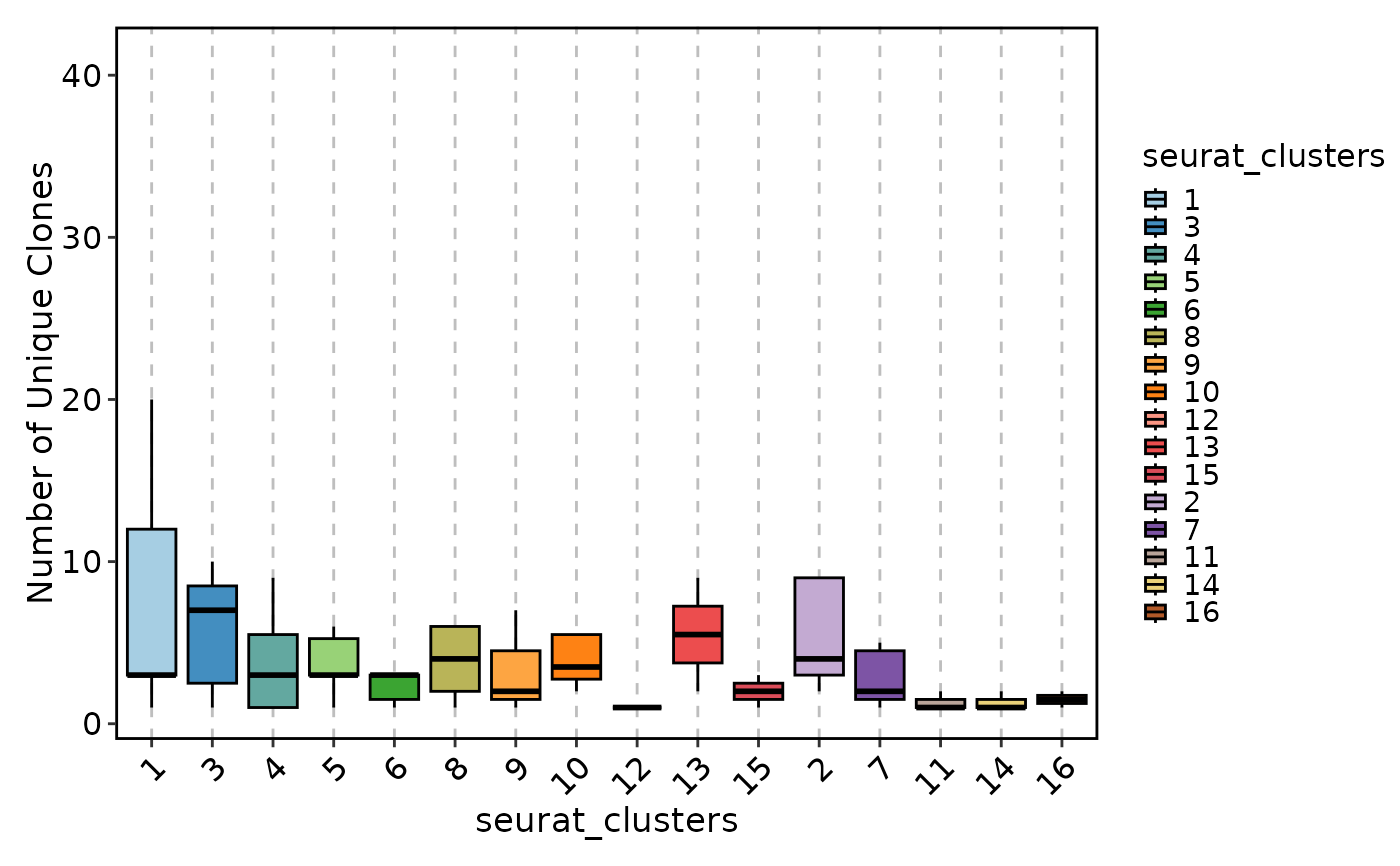
 ClonalVolumePlot(sobj, x = "seurat_clusters", plot_type = "box")
#> Warning: The 'Sample' column is not found in the meta data, 'orig.indent' will be used instead.
ClonalVolumePlot(sobj, x = "seurat_clusters", plot_type = "box")
#> Warning: The 'Sample' column is not found in the meta data, 'orig.indent' will be used instead.
 # }
# }