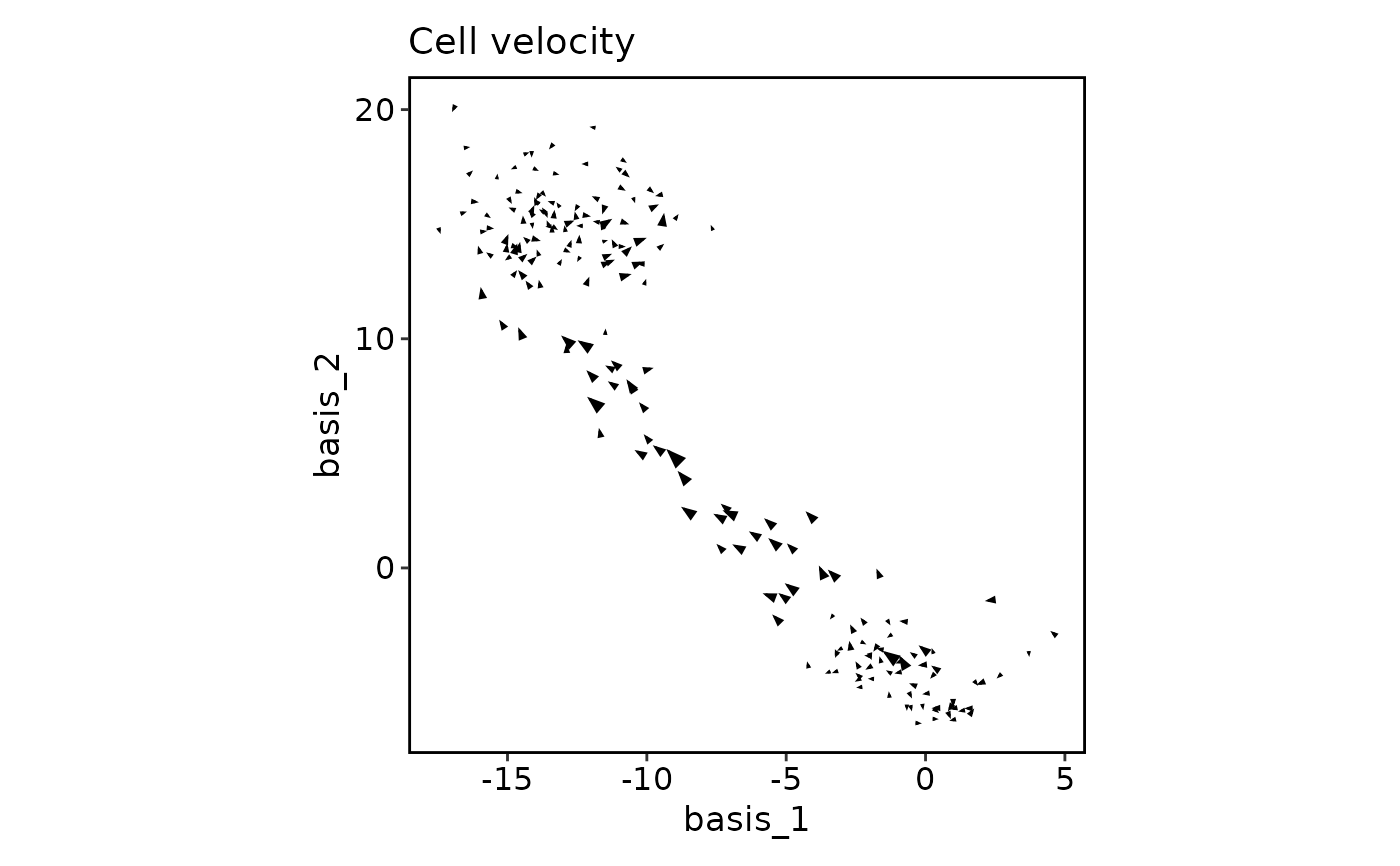
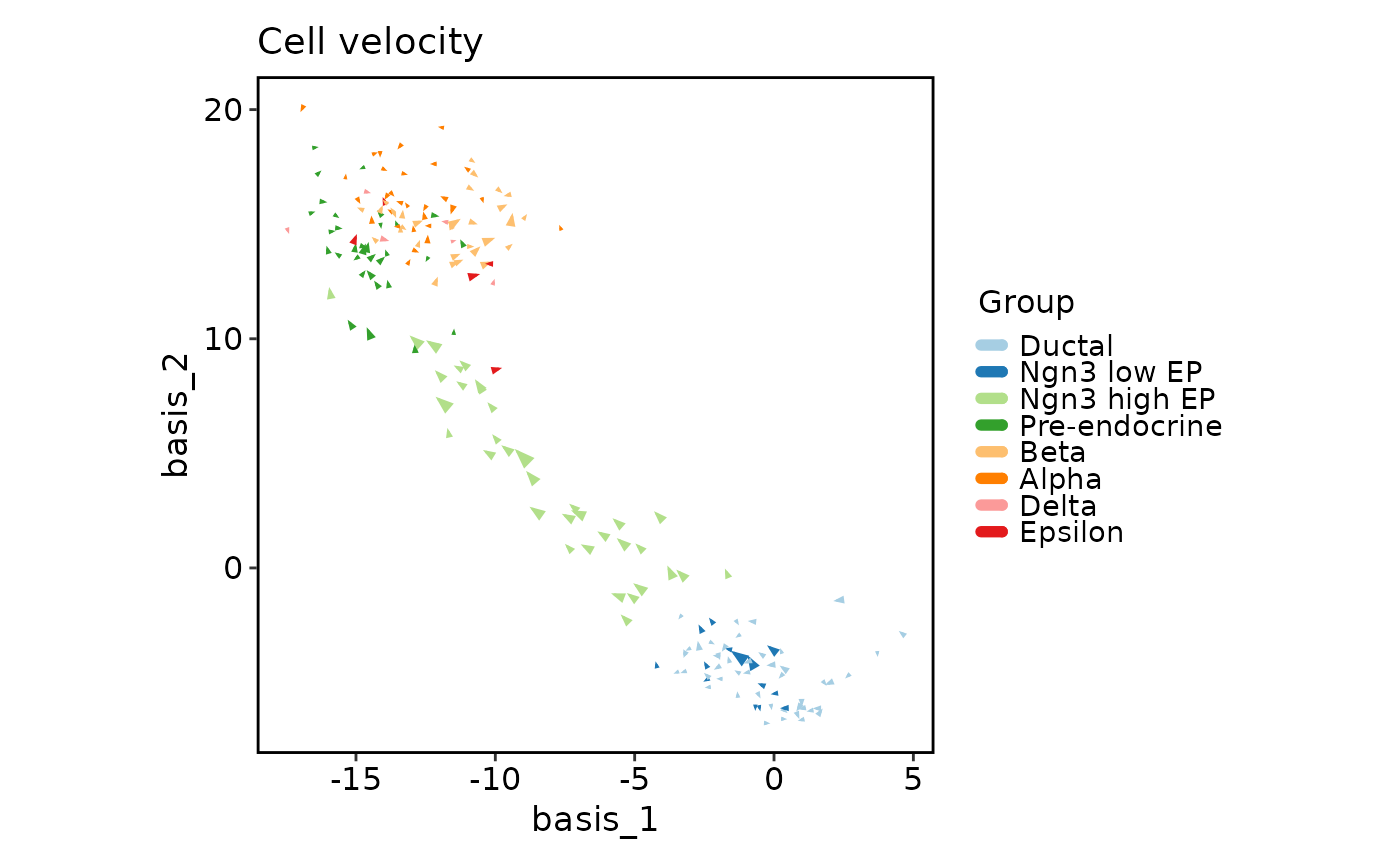
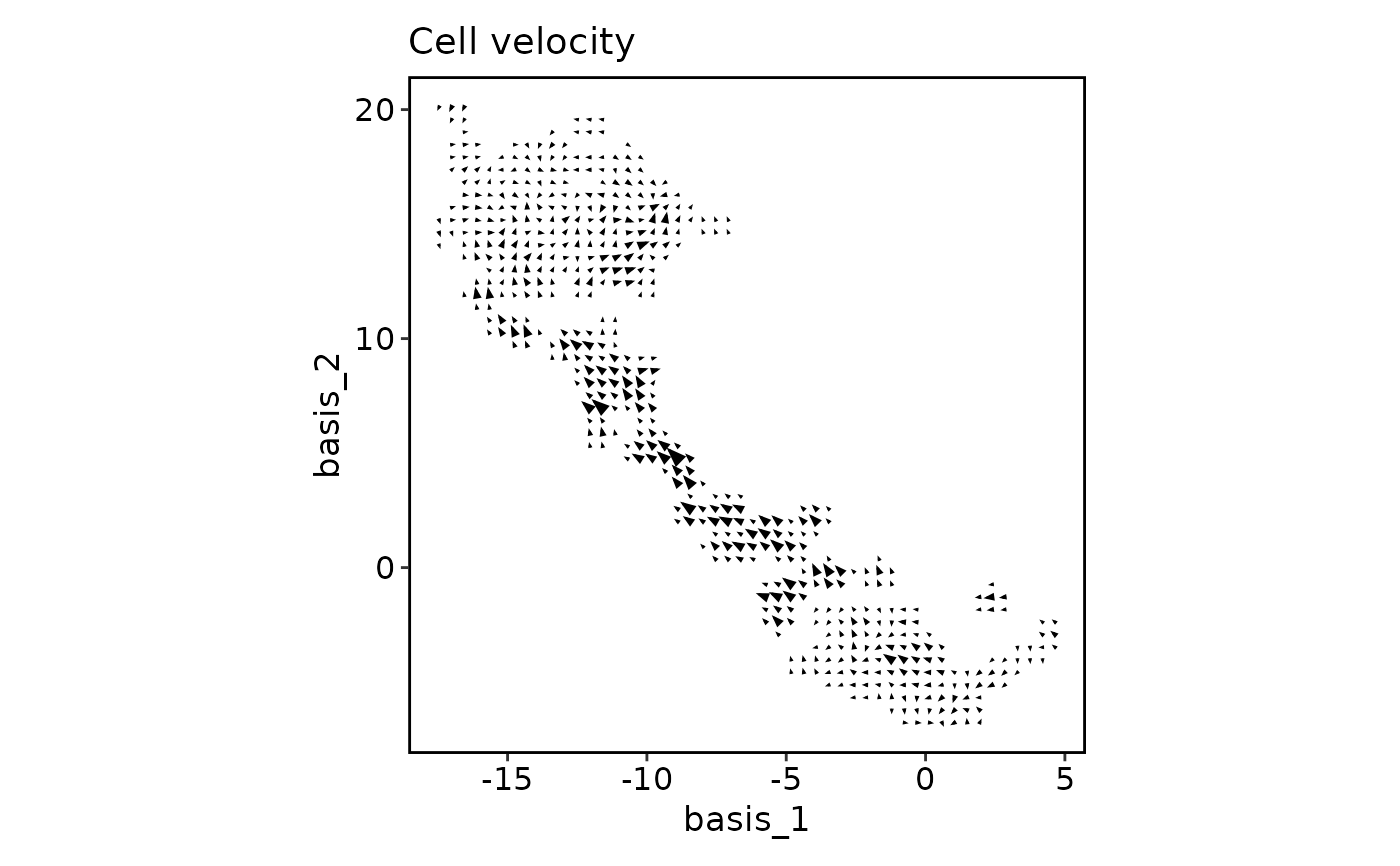
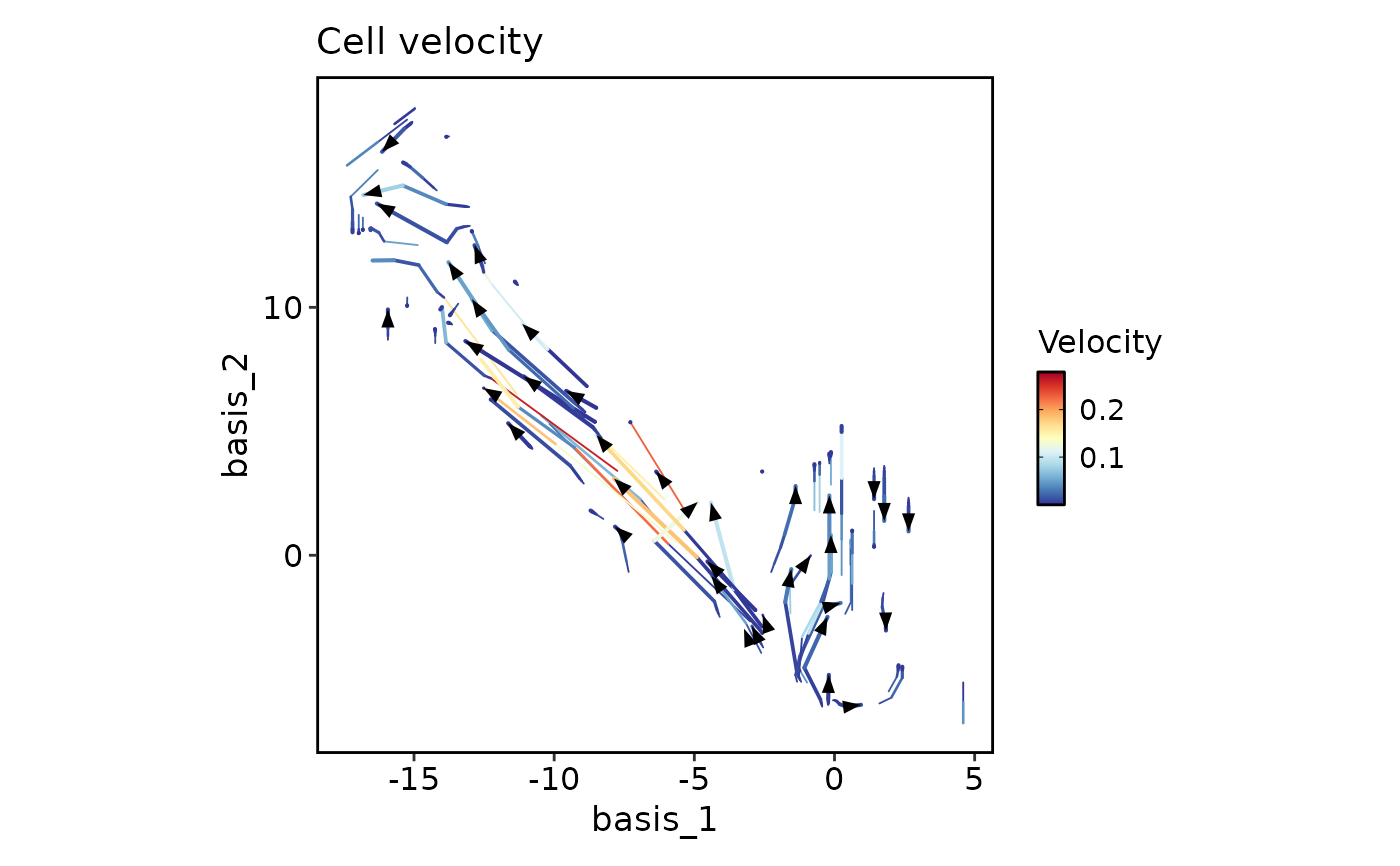
The plot shows the velocity vectors of the cells in a specified reduction space.
Usage
VelocityPlot(
  embedding,
  v_embedding,
  plot_type = c("raw", "grid", "stream"),
  split_by = NULL,
  group_by = NULL,
  group_name = "Group",
  group_palette = "Paired",
  group_palcolor = NULL,
  n_neighbors = NULL,
  density = 1,
  smooth = 0.5,
  scale = 1,
  min_mass = 1,
  cutoff_perc = 5,
  arrow_angle = 20,
  arrow_color = "black",
  arrow_alpha = 1,
  keep_na = FALSE,
  keep_empty = FALSE,
  streamline_l = 5,
  streamline_minl = 1,
  streamline_res = 1,
  streamline_n = 15,
  streamline_width = c(0, 0.8),
  streamline_alpha = 1,
  streamline_color = NULL,
  streamline_palette = "RdYlBu",
  streamline_palcolor = NULL,
  palreverse = FALSE,
  streamline_bg_color = "white",
  streamline_bg_stroke = 0.5,
  aspect.ratio = 1,
  title = "Cell velocity",
  subtitle = NULL,
  xlab = NULL,
  ylab = NULL,
  legend.position = "right",
  legend.direction = "vertical",
  theme = "theme_this",
  theme_args = list(),
  return_layer = FALSE,
  seed = 8525
)
Arguments
- embedding
A matrix or data.frame of dimension n_obs x n_dim specifying the embedding coordinates of the cells.
- v_embedding
A matrix or data.frame of dimension n_obs x n_dim specifying the velocity vectors of the cells.
- plot_type
A character string specifying the type of plot to create. Options are "raw", "grid", or "stream". Default is "raw".
- split_by
An optional character string specifying a variable to split the plot by. Not supported yet.
- group_by
An optional character string specifying a variable to group the cells by.
- group_name
An optional character string specifying the name of the grouping variable in legend. Default is "Group".
- group_palette
A character string specifying the color palette to use for grouping. Default is "Paired".
- group_palcolor
An optional character vector specifying the colors to use for grouping. If NULL, the colors will be generated from the group_palette.
- n_neighbors
An optional numeric value specifying the number of nearest neighbors for each grid point. Default is ceiling(ncol(embedding) / 50).
- density
An optional numeric value specifying the density of the grid points along each dimension. Default is 1.
- smooth
An optional numeric value specifying the smoothing factor for the velocity vectors. Default is 0.5.
- scale
An optional numeric value specifying the scaling factor for the velocity vectors. Default is 1.
- min_mass
An optional numeric value specifying the minimum mass required for a grid point to be considered. Default is 1.
- cutoff_perc
An optional numeric value specifying the percentile cutoff for removing low-density grid points. Default is 5.
- arrow_angle
An optional numeric value specifying the angle of the arrowheads in degrees for velocity arrows. Default is 20.
- arrow_color
A character string specifying the color of the velocity arrowheads. Default is "black".
- arrow_alpha
A numeric value specifying the transparency of the velocity arrows. Default is 1 (fully opaque). Only works for
plot_type = "raw"andplot_type = "grid". Forplot_type = "stream", usestreamline_alphainstead.- keep_na
A logical value or a character to replace the NA values in the data. It can also take a named list to specify different behavior for different columns. If TRUE or NA, NA values will be replaced with NA. If FALSE, NA values will be removed from the data before plotting. If a character string is provided, NA values will be replaced with the provided string. If a named vector/list is provided, the names should be the column names to apply the behavior to, and the values should be one of TRUE, FALSE, or a character string. Without a named vector/list, the behavior applies to categorical/character columns used on the plot, for example, the
x,group_by,fill_by, etc.- keep_empty
One of FALSE, TRUE and "level". It can also take a named list to specify different behavior for different columns. Without a named list, the behavior applies to the categorical/character columns used on the plot, for example, the
x,group_by,fill_by, etc.FALSE(default): Drop empty factor levels from the data before plotting.TRUE: Keep empty factor levels and show them as a separate category in the plot."level": Keep empty factor levels, but do not show them in the plot. But they will be assigned colors from the palette to maintain consistency across multiple plots. Alias:levels
- streamline_l
An optional numeric value specifying the length of the velocity streamlines. Default is 5.
- streamline_minl
An optional numeric value specifying the minimum length of the velocity streamlines. Default is 1.
- streamline_res
An optional numeric value specifying the resolution of the velocity streamlines. Default is 1.
- streamline_n
An optional numeric value specifying the number of velocity streamlines to draw. Default is 15.
- streamline_width
A numeric vector of length 2 specifying the width of the velocity streamlines. Default is c(0, 0.8).
- streamline_alpha
A numeric value specifying the transparency of the velocity streamlines. Default is 1 (fully opaque).
- streamline_color
A character string specifying the color of the velocity streamlines.
- streamline_palette
A character string specifying the color palette to use for the velocity streamlines. Default is "RdYlBu".
- streamline_palcolor
An optional character vector specifying the colors to use for the velocity streamlines. If NULL, the colors will be generated from the streamline_palette.
- palreverse
A logical value indicating whether to reverse the palette. Default is FALSE.
- streamline_bg_color
A character string specifying the background color of the velocity streamlines. Default is "white".
- streamline_bg_stroke
A numeric value specifying the background stroke width of the velocity streamlines. Default is 0.5.
- aspect.ratio
A numeric value specifying the aspect ratio of the plot.
- title
A character string specifying the title of the plot. A function can be used to generate the title based on the default title. This is useful when split_by is used and the title needs to be dynamic.
- subtitle
A character string specifying the subtitle of the plot.
- xlab
A character string specifying the x-axis label.
- ylab
A character string specifying the y-axis label.
- legend.position
A character string specifying the position of the legend. if
waiver(), for single groups, the legend will be "none", otherwise "right".- legend.direction
A character string specifying the direction of the legend.
- theme
A character string or a theme class (i.e. ggplot2::theme_classic) specifying the theme to use. Default is "theme_this".
- theme_args
A list of arguments to pass to the theme function.
- return_layer
A logical value indicating whether to return the ggplot layer instead of the full plot. Default is FALSE.
- seed
The random seed to use. Default is 8525.
Value
A ggplot object representing the cell velocity plot or a ggplot layer if return_layer is TRUE.
Examples
# \donttest{
data(dim_example)
dim_example$clusters[dim_example$clusters == "Ductal"] <- NA
VelocityPlot(dim_example[, 1:2], dim_example[, 3:4], group_by = dim_example$clusters)
 VelocityPlot(dim_example[, 1:2], dim_example[, 3:4], group_by = dim_example$clusters,
keep_na = TRUE, keep_empty = TRUE)
VelocityPlot(dim_example[, 1:2], dim_example[, 3:4], group_by = dim_example$clusters,
keep_na = TRUE, keep_empty = TRUE)
 VelocityPlot(dim_example[, 1:2], dim_example[, 3:4], group_by = dim_example$clusters,
keep_na = TRUE, keep_empty = 'level')
VelocityPlot(dim_example[, 1:2], dim_example[, 3:4], group_by = dim_example$clusters,
keep_na = TRUE, keep_empty = 'level')
 VelocityPlot(dim_example[, 1:2], dim_example[, 3:4], group_by = dim_example$clusters,
keep_na = TRUE, keep_empty = FALSE)
VelocityPlot(dim_example[, 1:2], dim_example[, 3:4], group_by = dim_example$clusters,
keep_na = TRUE, keep_empty = FALSE)
 # }
# }