ClusterMarkers
Markers for clusters of all or selected T/B cells.
This process is extended from MarkersFinder
from the biopipen package.
MarkersFinder is a pipen process that wraps the
Seurat::FindMarkers()
function, and performs enrichment analysis for the markers found.
The enrichment analysis is done by enrichr.
Note
Since this process is extended from MarkersFinder, other environment variables from MarkersFinder are also available.
However, they should not be used in this process. Other environment variables are used for more complicated cases for marker finding
(See MarkersFinder for more details).
If you are using pipen-board to run the pipeline
(see here and
here),
you may see the other environment variables of this process are hidden and readonly.
Input
srtobj: The seurat object loaded bySeuratPreparingIf you have yourSeuratobject prepared by yourself, you can also use it here, but you should make sure that the object has been processed byPrepSCTFindMarkersif data is not normalized usingSCTransform.
Output
outdir: Default:{{in.srtobj | stem0}}.markers.
The output directory for the markers and plots
Environment Variables
ncores(type=int): Default:1.
Number of cores to use for parallel computing for someSeuratprocedures.- Used in
future::plan(strategy = "multicore", workers = <ncores>)to parallelize some Seurat procedures. - See also: https://satijalab.org/seurat/articles/future_vignette.html
- Used in
dbs(list): Default:['KEGG_2021_Human', 'MSigDB_Hallmark_2020'].
The dbs to do enrichment analysis for significant markers.
You can use built-in dbs inenrichit, or provide your own gmt files.
See also https://pwwang.github.io/enrichit/reference/FetchGMT.html.
The built-in dbs include:- "BioCarta" or "BioCarta_2016"
- "GO_Biological_Process" or "GO_Biological_Process_2025"
- "GO_Cellular_Component" or "GO_Cellular_Component_2025"
- "GO_Molecular_Function" or "GO_Molecular_Function_2025"
- "KEGG", "KEGG_Human", "KEGG_2021", or "KEGG_2021_Human"
- "Hallmark", "MSigDB_Hallmark", or "MSigDB_Hallmark_2020"
- "Reactome", "Reactome_Pathways", or "Reactome_Pathways_2024"
- "WikiPathways", "WikiPathways_2024", "WikiPathways_Human", or "WikiPathways_2024_Human"
You can also fetch more dbs from https://maayanlab.cloud/Enrichr/#libraries.
sigmarkers: Default:p_val_adj < 0.05 & avg_log2FC > 0.
An expression passed todplyr::filter()to filter the significant markers for enrichment analysis.
Available variables arep_val,avg_log2FC,pct.1,pct.2andp_val_adj. For example,"p_val_adj < 0.05 & abs(avg_log2FC) > 1"to select markers with adjusted p-value < 0.05 and absolute log2 fold change > 1.enrich_style(choice): Default:enrichr.
The style of the enrichment analysis.
The enrichment analysis will be done byEnrichIt()fromenrichit.
Two styles are available:enrichr:enrichrstyle enrichment analysis (fisher's exact test will be used).clusterprofiler:clusterProfilerstyle enrichment analysis (hypergeometric test will be used).clusterProfiler: alias forclusterprofiler
assay: The assay to use.subset: An expression to subset the cells for each case.error(flag): Default:True.
Stop the job if errors happen.
Helpful when no/not enough markers are found or no pathways are enriched.
IfFalse, empty results will be returned.cache(type=auto): Default:/tmp.
Where to cache the results.
IfTrue, cache tooutdirof the job. IfFalse, don't cache.
Otherwise, specify the directory to cache to.rest(ns): Rest arguments forSeurat::FindMarkers().
Use-to replace.in the argument name. For example, usemin-pctinstead ofmin.pct.
allmarker_plots_defaults(ns): Default options for the plots for all markers whenident_1is not specified.plot_type: The type of the plot.
See https://pwwang.github.io/biopipen.utils.R/reference/VizDEGs.html.
Available types areviolin,box,bar,ridge,dim,heatmapanddot.descr: A description of the plot to be shown above the plot image.more_formats(type=list): Default:[].
The extra formats to save the plot in.save_code(flag): Default:False.
Whether to save the code to generate the plot.devpars(ns): The device parameters for the plots.res(type=int): Default:100.
The resolution of the plots.height(type=int): The height of the plots.width(type=int): The width of the plots.
<more>: Other arguments passed tobiopipen.utils::VizDEGs().
allmarker_plots(type=json): Default:{'Top 5 markers of each cluster': Diot({'plot_type': 'heatmap_log2fc', 'select': 5, 'cutoff': 0.05})}.
All marker plot cases.
The keys are the names of the cases and the values are the dicts inherited fromallmarker_plots_defaults.allenrich_plots_defaults(ns): Default options for the plots to generate for the enrichment analysis.plot_type: Default:heatmap.
The type of the plot.descr: A description of the plot to be shown above the plot image.devpars(ns): The device parameters for the plots.res(type=int): Default:100.
The resolution of the plots.height(type=int): The height of the plots.width(type=int): The width of the plots.
db(type=str): The database(s) to apply for the plot. If not specified, all databases will be applied.
dbscan also be used as an alias for this parameter.<more>: See https://pwwang.github.io/scplotter/reference/EnrichmentPlot.html.
allenrich_plots(type=json): Default:{}.
Cases of the plots to generate for the enrichment analysis.
The keys are the names of the cases and the values are the dicts inherited fromallenrich_plots_defaults.
The cases underenvs.casescan inherit this options.marker_plots_defaults(ns): Default options for the plots to generate for the markers.plot_type: The type of the plot.
See https://pwwang.github.io/biopipen.utils.R/reference/VizDEGs.html.
Available types areviolin,box,bar,ridge,dim,heatmapanddot.
There are two additional types available -volcano_pctandvolcano_log2fc.descr: A description of the plot to be shown above the plot image.more_formats(type=list): Default:[].
The extra formats to save the plot in.save_code(flag): Default:False.
Whether to save the code to generate the plot.devpars(ns): The device parameters for the plots.res(type=int): Default:100.
The resolution of the plots.height(type=int): The height of the plots.width(type=int): The width of the plots.
<more>: Other arguments passed tobiopipen.utils::VizDEGs().
Ifplot_typeisvolcano_pctorvolcano_log2fc, they will be passed toscplotter::VolcanoPlot().
marker_plots(type=json): Default:{'Volcano Plot (diff_pct)': Diot({'plot_type': 'volcano_pct'}), 'Volcano Plot (log2FC)': Diot({'plot_type': 'volcano_log2fc'}), 'Dot Plot': Diot({'plot_type': 'dot', 'devpars': Diot({'width': 500, 'height': 720})})}.
Cases of the plots to generate for the markers.
Plot cases. The keys are the names of the cases and the values are the dicts inherited frommarker_plots_defaults.
The cases underenvs.casescan inherit this options.enrich_plots_defaults(ns): Default options for the plots to generate for the enrichment analysis.plot_type: The type of the plot.
See https://pwwang.github.io/scplotter/reference/EnrichmentPlot.html.
Available types arebar,dot,lollipop,network,enrichmapandwordcloud.descr: A description of the plot to be shown above the plot image.more_formats(type=list): Default:[].
The extra formats to save the plot in.save_code(flag): Default:False.
Whether to save the code to generate the plot.devpars(ns): The device parameters for the plots.res(type=int): Default:100.
The resolution of the plots.height(type=int): The height of the plots.width(type=int): The width of the plots.
<more>: See https://pwwang.github.io/scplotter/reference/EnrichmentPlot.html.
enrich_plots(type=json): Default:{'Bar Plot': Diot({'plot_type': 'bar', 'ncol': 1, 'top_term': 10})}.
Cases of the plots to generate for the enrichment analysis.
The keys are the names of the cases and the values are the dicts inherited fromenrich_plots_defaults.
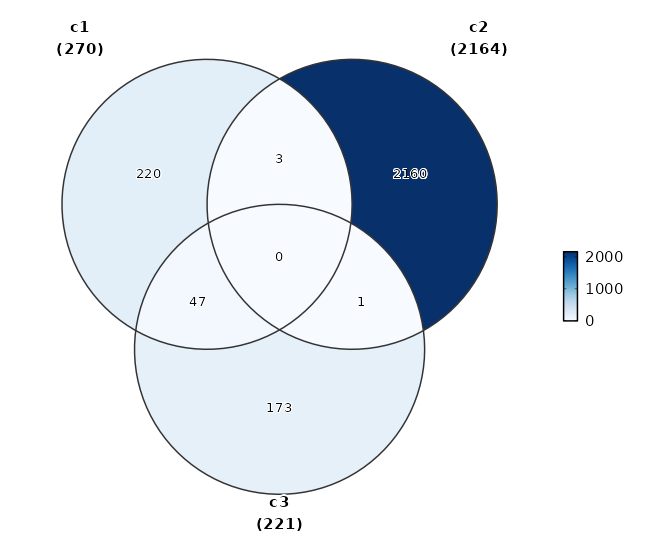
The cases underenvs.casescan inherit this options.overlaps_defaults(ns): Default options for investigating the overlapping of significant markers between different cases or comparisons.
This means eitherident_1should be empty, so that they can be expanded to multiple comparisons.sigmarkers: The expression to filter the significant markers for each case.
If not provided,envs.sigmarkerswill be used.descr: A description of the plot to be shown above the plot image.plot_type(choice): Default:venn.
The type of the plot to generate for the overlaps.venn: Useplotthis::VennDiagram().upset: Useplotthis::UpsetPlot().
more_formats(type=list): Default:[].
The extra formats to save the plot in.save_code(flag): Default:False.
Whether to save the code to generate the plot.devpars(ns): The device parameters for the plots.res(type=int): Default:100.
The resolution of the plots.height(type=int): The height of the plots.width(type=int): The width of the plots.
<more>: More arguments pased toplotthis::VennDiagram()(https://pwwang.github.io/plotthis/reference/venndiagram1.html) orplotthis::UpsetPlot()(https://pwwang.github.io/plotthis/reference/upsetplot1.html)
overlaps(type=json): Default:{}.
Cases for investigating the overlapping of significant markers between different cases or comparisons.
The keys are the names of the cases and the values are the dicts inherited fromoverlaps_defaults.
There are two situations that we can perform overlaps:- If
ident_1is not specified, the overlaps can be performed between different comparisons. - If
eachis specified, the overlaps can be performed between different cases, where in each case,ident_1must be specified.
- If
SeeAlso
Examples
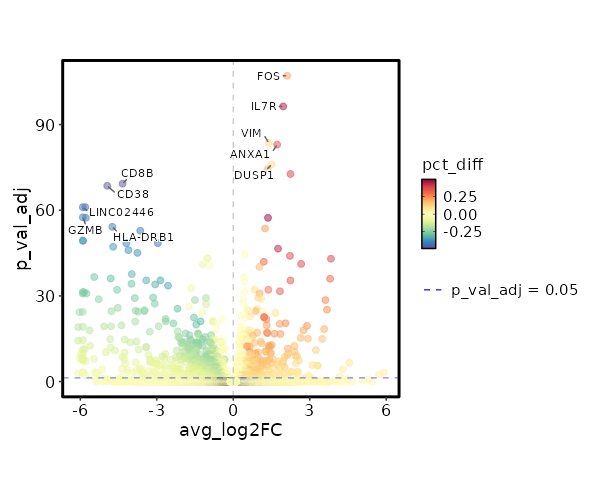
Visualize Log2 Fold Change of Markers
[ClusterMarkers.envs.marker_plots."Volcano Plot (log2FC)"]
plot_type = "volcano_log2fc"
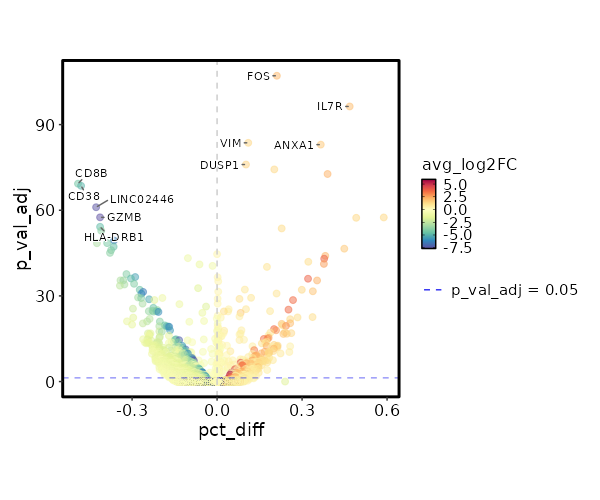
Visualize differential percentage of expression of Markers
[ClusterMarkers.envs.marker_plots."Volcano Plot (pct_diff)"]
plot_type = "volcano_pct"
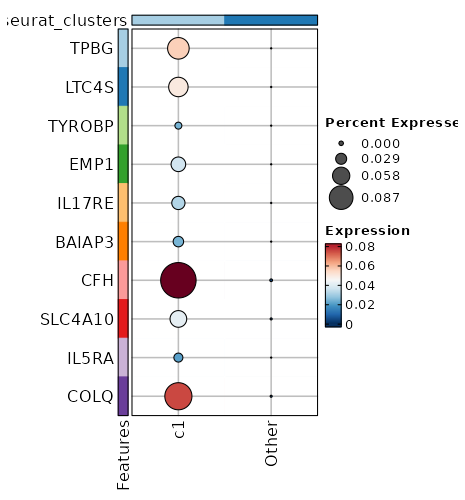
Visualize Average Expression of Markers with Dot Plot
[ClusterMarkers.envs.marker_plots."Dot Plot (AvgExp)"]
plot_type = "dotplot"
order_by = "desc(avg_log2FC)"
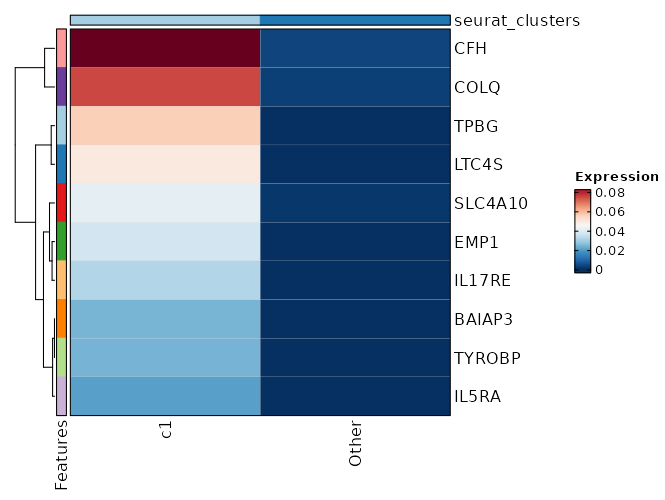
Visualize Average Expression of Markers with Heatmap
[ClusterMarkers.envs.marker_plots."Heatmap (AvgExp)"]
plot_type = "heatmap"
order_by = "desc(avg_log2FC)"
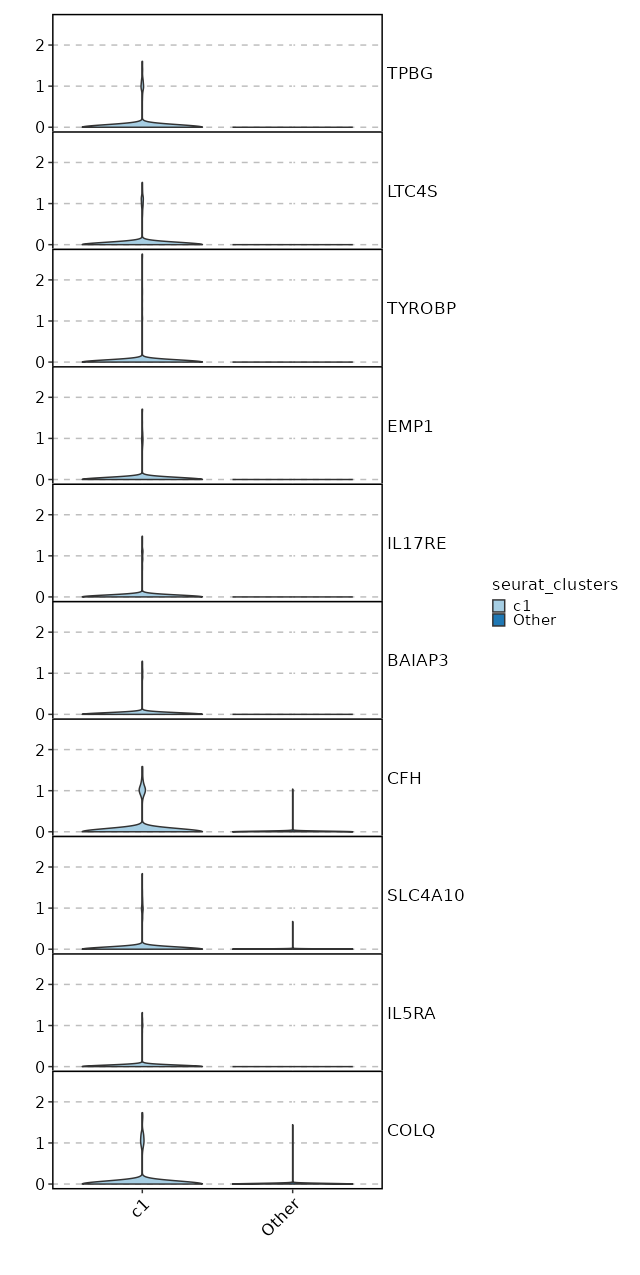
Visualize Expression of Markers with Violin Plots
[ClusterMarkers.envs.marker_plots."Violin Plots"]
plot_type = "violin"
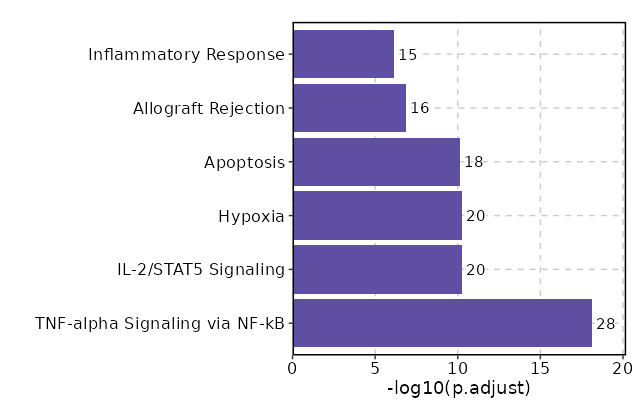
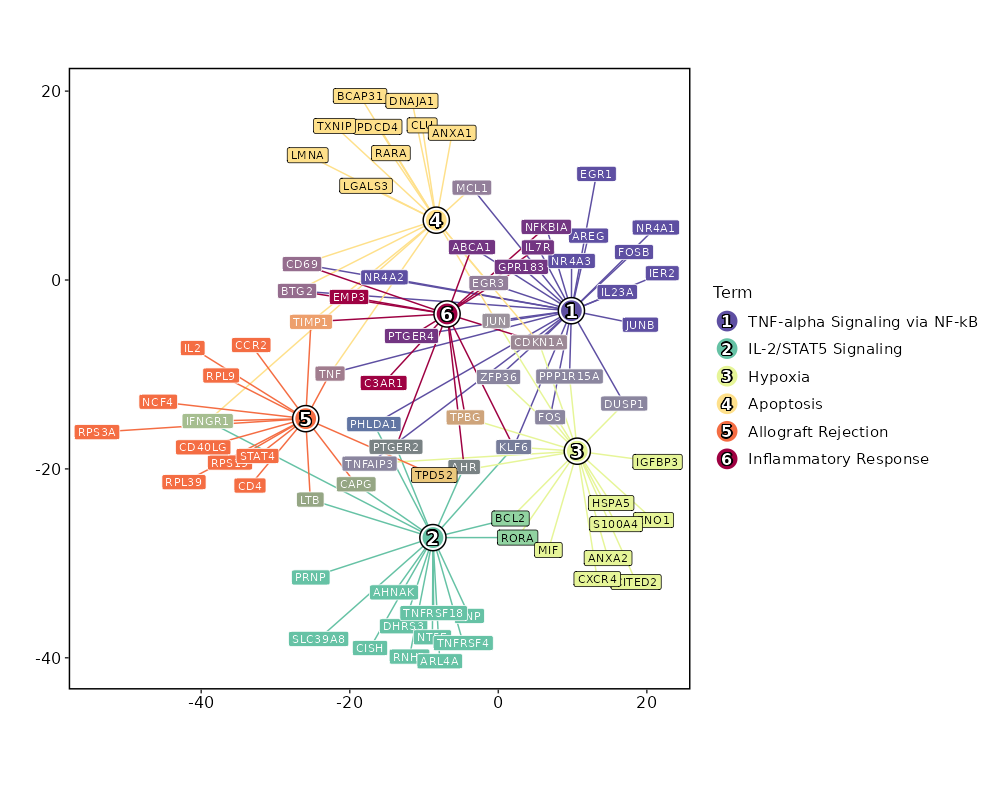
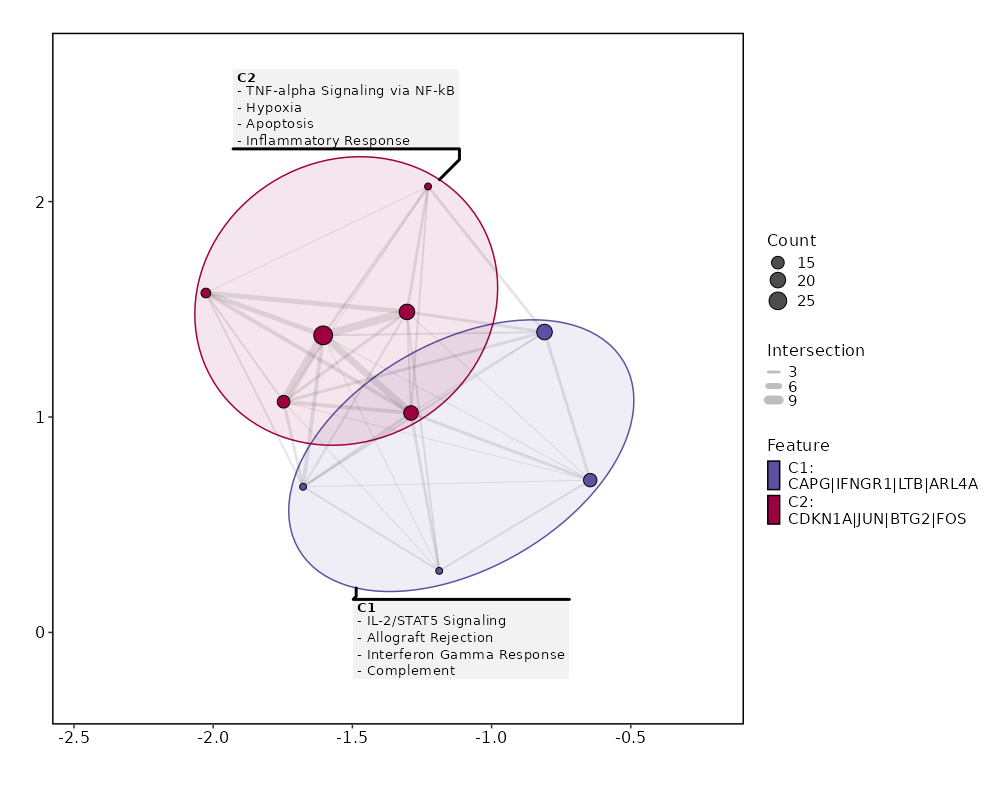
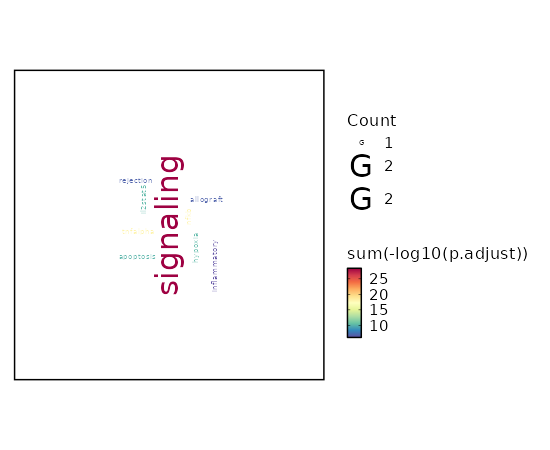
Visualize enrichment analysis results with Bar/EnrichMap/Network/WordCloud Plots
# Visualize enrichment of markers
[ClusterMarkers.envs.enrich_plots."Bar Plot"]  # Default
plot_type = "bar"

[ClusterMarkers.envs.enrich_plots."Network"]
plot_type = "network"

[ClusterMarkers.envs.enrich_plots."Enrichmap"]
plot_type = "enrichmap"

[ClusterMarkers.envs.enrich_plots."Word Cloud"]
plot_type = "wordcloud"
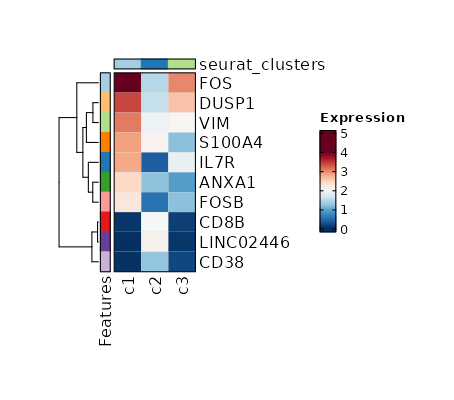
Visualize top markers of all clusters with Heatmap
[ClusterMarkers.envs.allmarker_plots."Top 10 markers of all clusters"]
plot_type = "heatmap"
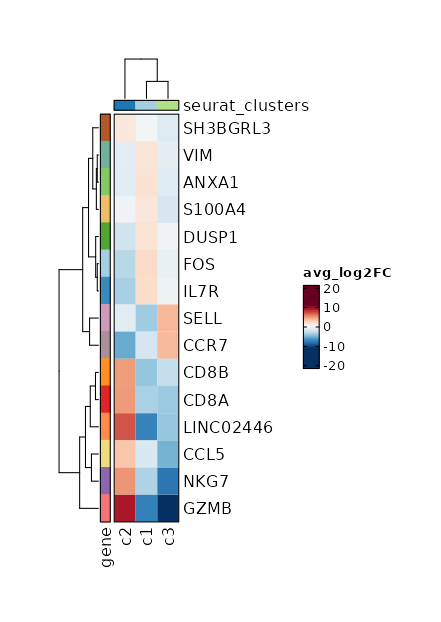
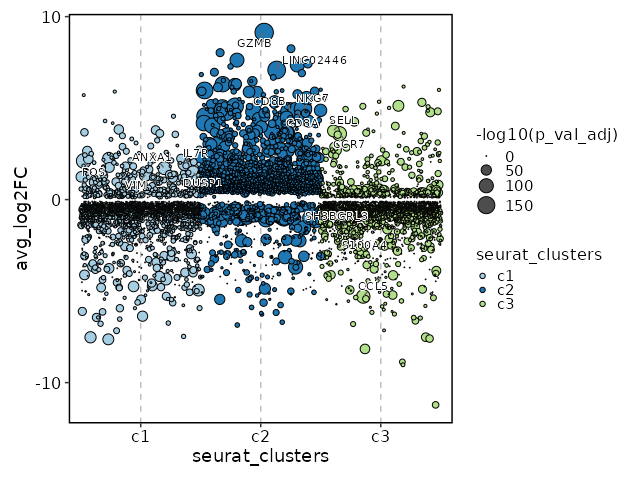
Visualize Log2 Fold Change of all markers
[ClusterMarkers.envs.allmarker_plots."Log2 Fold Change of all markers"]
plot_type = "heatmap_log2fc"
subset_by = "seurat_clusters"
Visualize all markers in all clusters with Jitter Plots
[ClusterMarkers.envs.allmarker_plots."Jitter Plots of all markers"]
plot_type = "jitter"
subset_by = "seurat_clusters"
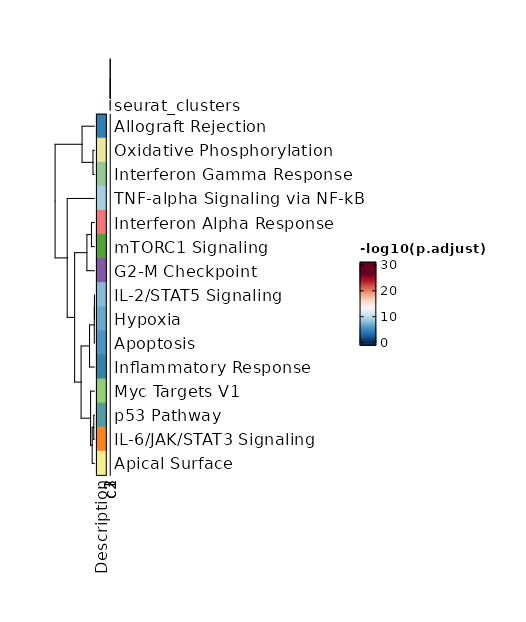
Visualize all enrichment analysis results of all clusters
[ClusterMarkers.envs.allenrich_plots."Heatmap of enriched terms of all clusters"]
plot_type = "heatmap"
Overlapping markers
[ClusterMarkers.envs.overlaps."Overlapping Markers"]
plot_type = "venn"