Visualize differentially expressed genes
Usage
VizDEGs(
  markers,
  object = NULL,
  plot_type = c("volcano", "volcano_log2fc", "volcano_pct", "jitter", "jitter_log2fc",
    "jitter_pct", "heatmap_log2fc", "heatmap_pct", "dot_log2fc", "dot_pct", "heatmap",
    "violin", "box", "bar", "ridge", "dot"),
  subset_by = NULL,
  subset_as_facet = FALSE,
  comparison_by = NULL,
  p_adjust = TRUE,
  cutoff = NULL,
  order_by = NULL,
  select = ifelse(plot_type %in% c("volcano", "volcano_log2fc", "volcano_pct",
    "jitter", "jitter_log2fc", "jitter_pct", "heatmap_log2fc", "heatmap_pct"), 5, 10),
  outprefix = NULL,
  devpars = list(res = 100),
  more_formats = c(),
  save_code = FALSE,
  ...
)
Arguments
- markers
A data frame of differential expression results, typically the output of
Seurat::FindMarkers()orSeurat::FindAllMarkers(). Must contain columns"gene"(or gene symbols as rownames),"p_val", and"avg_log2FC". For percentage-based plots (volcano_pct,jitter_pct,heatmap_pct,dot_pct), columns"pct.1"and"pct.2"are also required.- object
A Seurat object. Required for expression-based plot types:
"heatmap","violin","box","bar","ridge", and"dot". Not used for DE summary plot types. Default:NULL.- plot_type
The type of plot to generate. One of
"volcano","volcano_log2fc","volcano_pct","jitter","jitter_log2fc","jitter_pct","heatmap_log2fc","heatmap_pct","dot_log2fc","dot_pct","heatmap","violin","box","bar","ridge", or"dot". See Description for details on each type.- subset_by
A column name in
markersindicating the grouping from which each marker was identified (e.g., theclustercolumn fromFindAllMarkers()). Supports the"marker_column:metadata_column"syntax for linking to Seurat object metadata (see Metadata column mapping section). For jitter and DE heatmap/dot plot types,subset_byis required and defines the x-axis or column groups. For expression plot types,subset_bycontrols faceting or splitting. Default:NULL.- subset_as_facet
Logical. If
TRUE, facet the plot bysubset_bygroups instead of splitting into separate plots. Most useful for expression plot types. For volcano plots, controls whether faceting or split_by dispatch is used. Default:FALSE.- comparison_by
A column name in
markersindicating the comparison (e.g.,"g1:g2"for a pairwise comparison, or a single group name for one-vs-rest). Required for expression-based plot types ("heatmap","violin","box","bar","ridge","dot"). Supports the"marker_column:metadata_column"syntax (see Metadata column mapping section). If the comparison values contain a colon (e.g.,"G2M:G1"), the two groups on either side of the colon are used to subset the object. If only a single group is present, a one-vs-other comparison is assumed. Default:NULL.- p_adjust
Logical. If
TRUE(default), use adjusted p-value (p_val_adjcolumn) for significance calculations and y-axis transformations. IfFALSE, use raw p-value (p_valcolumn).- cutoff
Numeric. The p-value (or adjusted p-value, depending on
p_adjust) threshold for labeling significance. For volcano plots, setsy_cutoff. For heatmap-based DE plots (heatmap_log2fc,heatmap_pct), controls which cells receive significance marks. Default:NULL(no cutoff; defaults to0.05for volcano plots).- order_by
A string expression to order markers by (evaluated with
dplyr::arrange()). Can reference columns inmarkersas well as columns from the object metadata (whenobjectis provided andsubset_byenables merging). Only the first value of merged metadata columns is used. Example:"desc(avg_log2FC)". The ordering affects which markers are selected whenselectis numeric. Default:NULL.- select
How to select markers for labeling or display. See Marker selection and filtering section for full details.
Numeric: Top N markers per
subset_bygroup (default:5for volcano/jitter types,10for others).Character expression: Filter condition for
dplyr::filter().Character vector: Multiple filter expressions; those containing the
subset_bycolumn name filter the overall data, others filter within remaining data.
- outprefix
Prefix of the output file
- devpars
List of parameters to save the plot
- more_formats
Additional formats to save the plot in addition to 'png'
- save_code
Whether to save the code to reproduce the plot
- ...
Arguments passed on to
scplotter::MarkersPlotshow_labelsLogical. For
heatmap_log2fcandheatmap_pctplot types only. IfTRUE, display numeric values in heatmap cells. When combined withcutoff, both values and significance marks are shown. Default:FALSE.sig_markCharacter. The symbol or compound mark used to annotate statistically significant cells in
heatmap_log2fcandheatmap_pctplots. Must be a valid ComplexHeatmap mark: single characters ("-","|","+","/","\\","x","o") or compound marks ("[*]","<*>","(*)","{*}"). Note that"*"conflicts withshow_labels = TRUEbecause both use the label layer — use a compound mark instead. Default:"*".
Examples
# \donttest{
degs <- RunSeuratDEAnalysis(scplotter::pancreas_sub, "SubCellType")
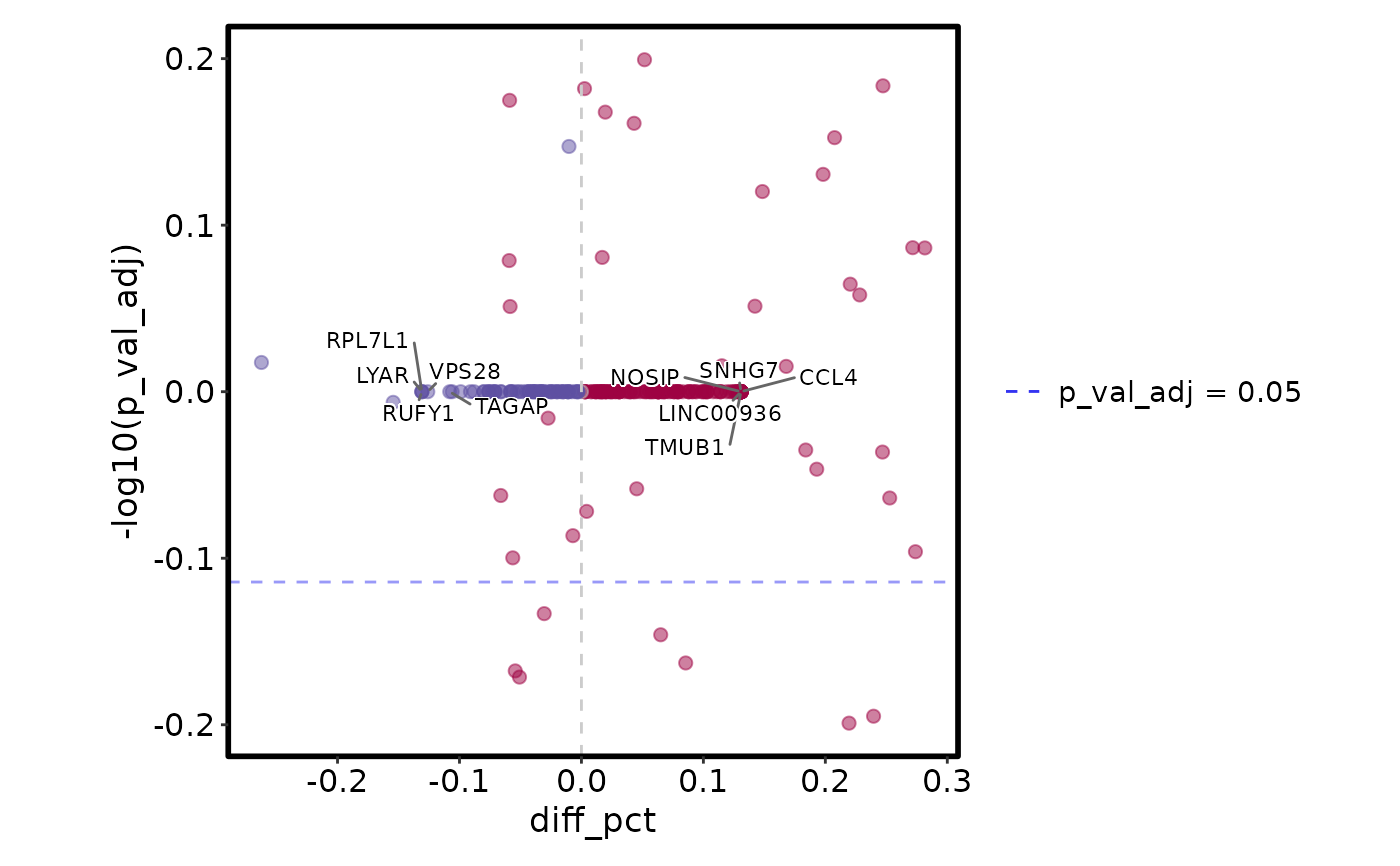
VizDEGs(degs, plot_type = "volcano_pct")
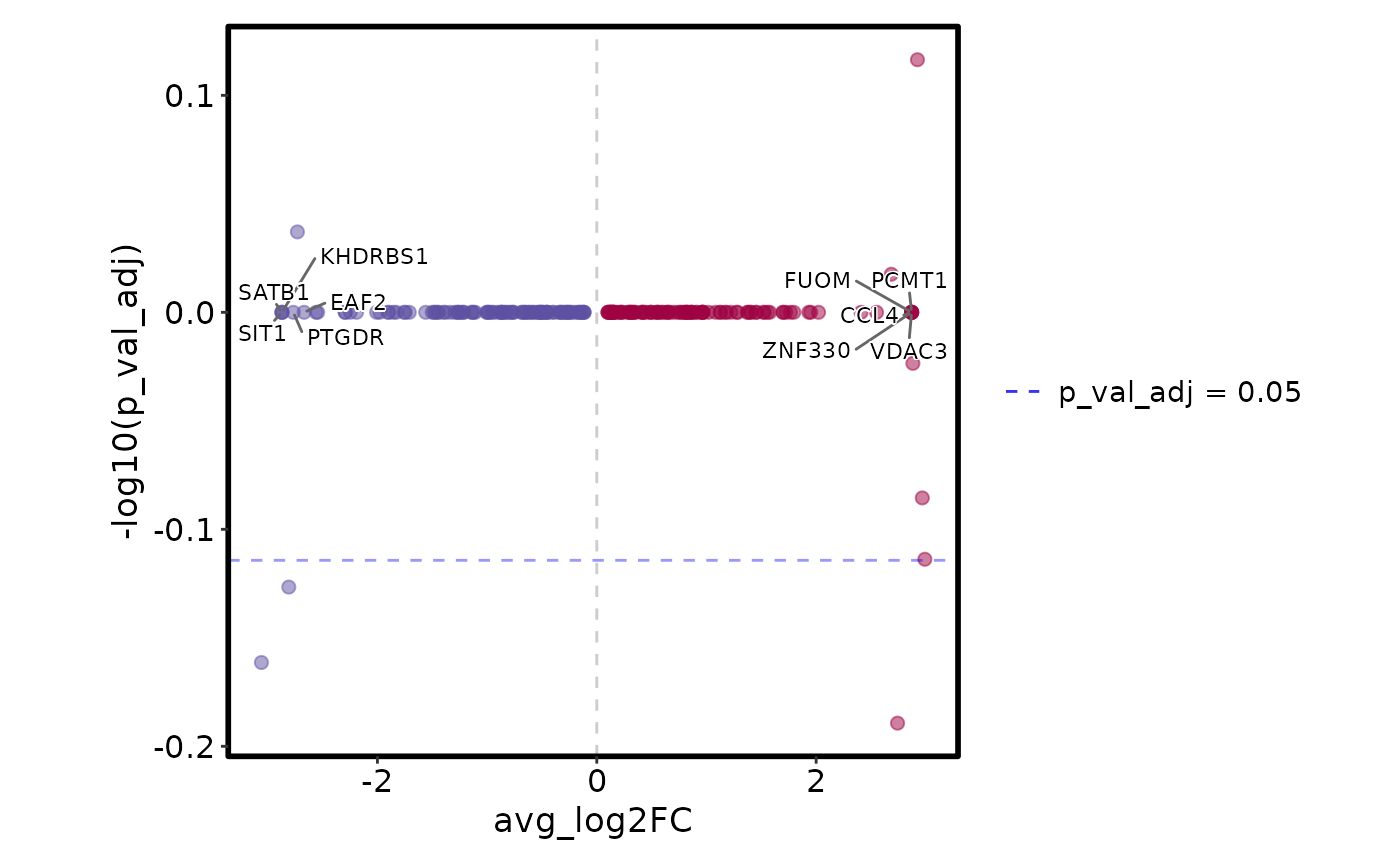
 VizDEGs(degs, plot_type = "volcano_log2fc")
 VizDEGs(degs, plot_type = "jitter_log2fc", subset_by = "SubCellType")
 VizDEGs(degs,
plot_type = "heatmap_log2fc", cutoff = 0.05,
select = 5, subset_by = "SubCellType"
)
VizDEGs(degs,
plot_type = "heatmap_log2fc", cutoff = 0.05,
select = 5, subset_by = "SubCellType"
)
 # Visualize expression of the top DEGs
# Suppose we did comparison between G2M and S phase in each SubCellType
degs$Phase <- "G2M:S"
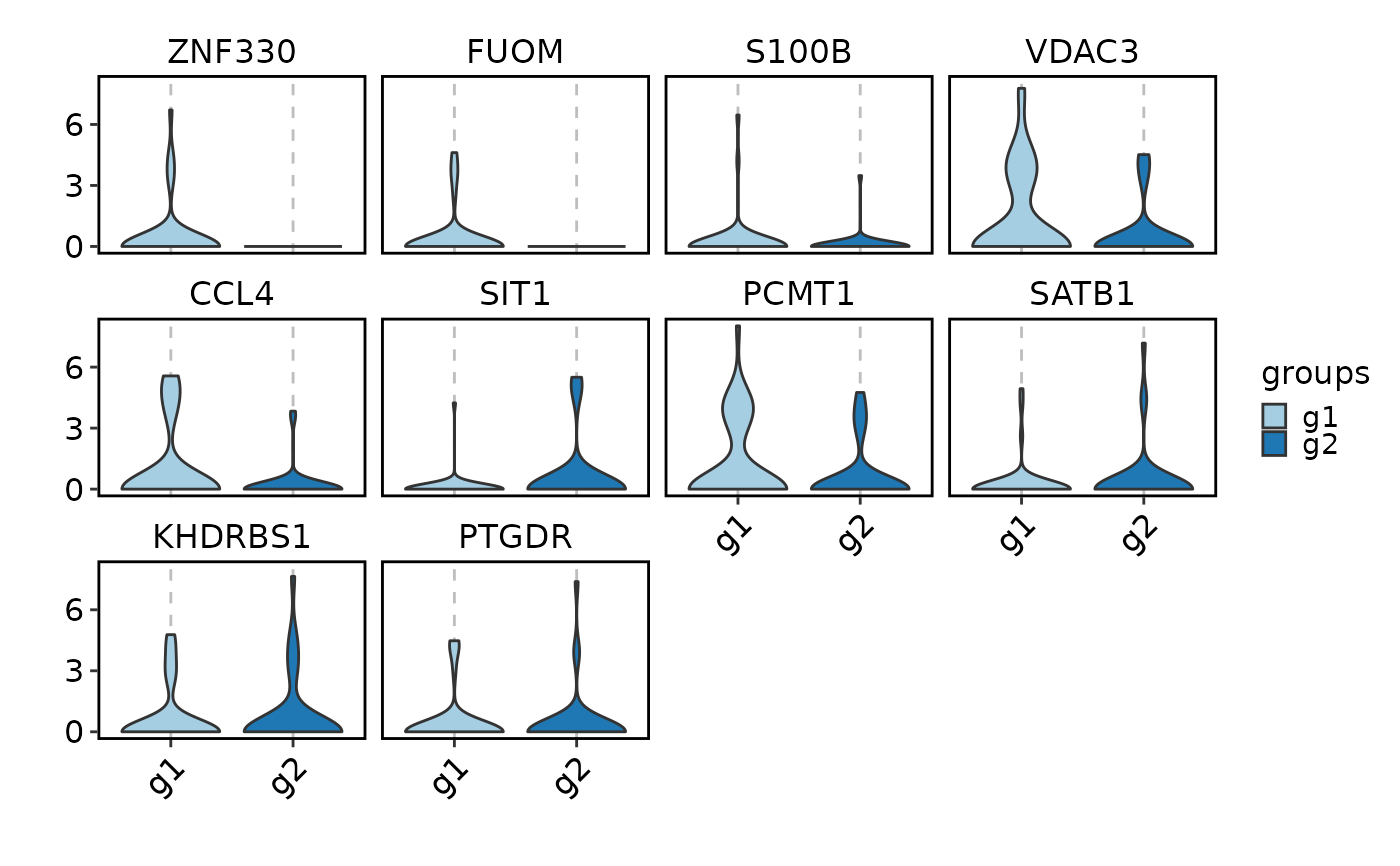
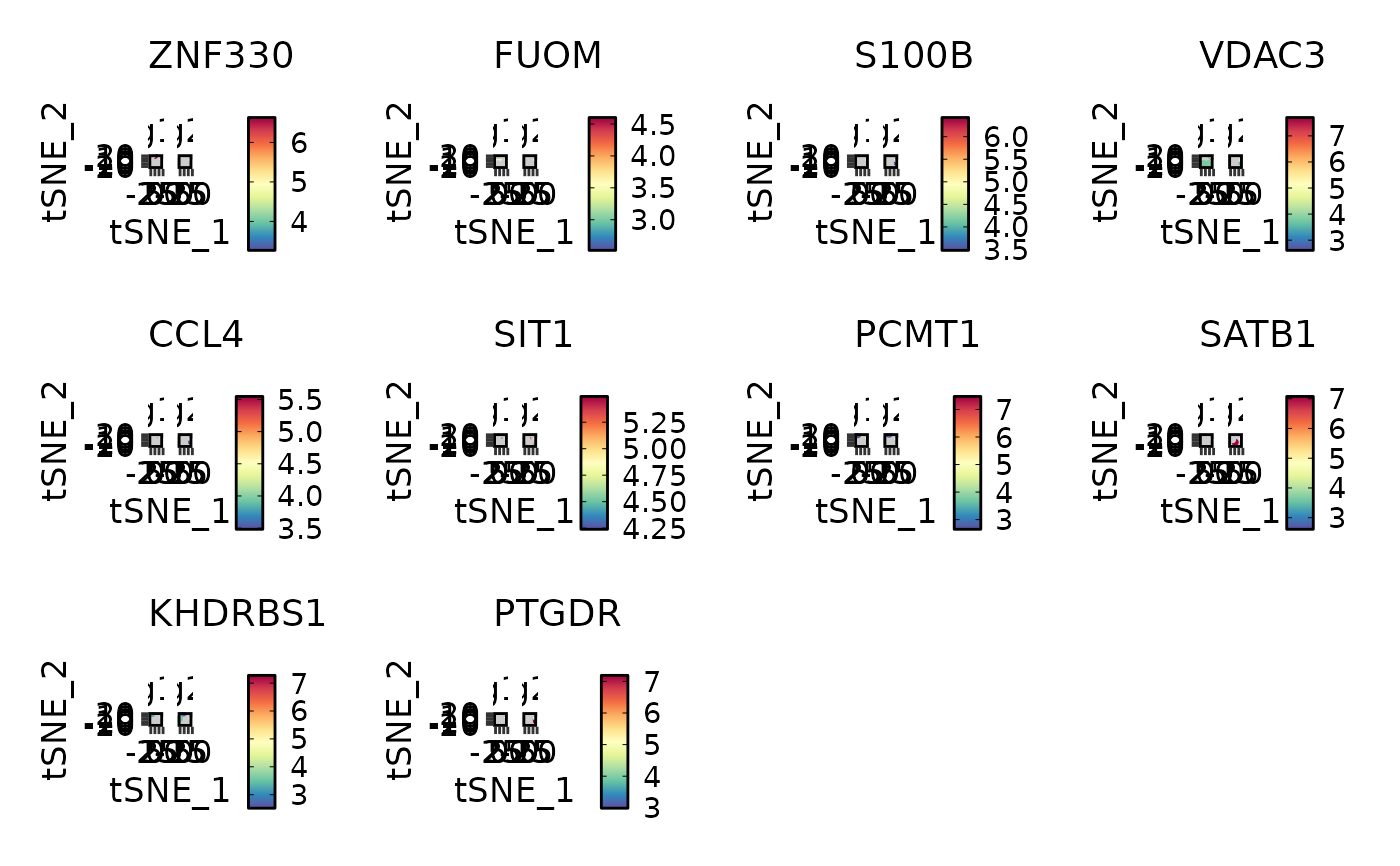
VizDEGs(degs,
object = scplotter::pancreas_sub, plot_type = "violin",
select = 2, comparison_by = "Phase", subset_by = "SubCellType"
)
#> Warning: Layer counts isn't present in the assay object; returning NULL
#> Warning: Groups with fewer than two datapoints have been dropped.
#> ℹ Set `drop = FALSE` to consider such groups for position adjustment purposes.
#> Warning: Groups with fewer than two datapoints have been dropped.
#> ℹ Set `drop = FALSE` to consider such groups for position adjustment purposes.
#> Warning: Groups with fewer than two datapoints have been dropped.
#> ℹ Set `drop = FALSE` to consider such groups for position adjustment purposes.
#> Warning: Groups with fewer than two datapoints have been dropped.
#> ℹ Set `drop = FALSE` to consider such groups for position adjustment purposes.
#> Warning: Groups with fewer than two datapoints have been dropped.
#> ℹ Set `drop = FALSE` to consider such groups for position adjustment purposes.
#> Warning: Groups with fewer than two datapoints have been dropped.
#> ℹ Set `drop = FALSE` to consider such groups for position adjustment purposes.
#> Warning: Groups with fewer than two datapoints have been dropped.
#> ℹ Set `drop = FALSE` to consider such groups for position adjustment purposes.
#> Warning: Groups with fewer than two datapoints have been dropped.
#> ℹ Set `drop = FALSE` to consider such groups for position adjustment purposes.
#> Warning: Groups with fewer than two datapoints have been dropped.
#> ℹ Set `drop = FALSE` to consider such groups for position adjustment purposes.
#> Warning: Groups with fewer than two datapoints have been dropped.
#> ℹ Set `drop = FALSE` to consider such groups for position adjustment purposes.
#> Warning: Groups with fewer than two datapoints have been dropped.
#> ℹ Set `drop = FALSE` to consider such groups for position adjustment purposes.
#> Warning: Groups with fewer than two datapoints have been dropped.
#> ℹ Set `drop = FALSE` to consider such groups for position adjustment purposes.
#> Warning: Groups with fewer than two datapoints have been dropped.
#> ℹ Set `drop = FALSE` to consider such groups for position adjustment purposes.
#> Warning: Groups with fewer than two datapoints have been dropped.
#> ℹ Set `drop = FALSE` to consider such groups for position adjustment purposes.
#> Warning: Groups with fewer than two datapoints have been dropped.
#> ℹ Set `drop = FALSE` to consider such groups for position adjustment purposes.
#> Warning: Groups with fewer than two datapoints have been dropped.
#> ℹ Set `drop = FALSE` to consider such groups for position adjustment purposes.
#> Warning: Groups with fewer than two datapoints have been dropped.
#> ℹ Set `drop = FALSE` to consider such groups for position adjustment purposes.
#> Warning: Groups with fewer than two datapoints have been dropped.
#> ℹ Set `drop = FALSE` to consider such groups for position adjustment purposes.
#> Warning: Groups with fewer than two datapoints have been dropped.
#> ℹ Set `drop = FALSE` to consider such groups for position adjustment purposes.
#> Warning: Groups with fewer than two datapoints have been dropped.
#> ℹ Set `drop = FALSE` to consider such groups for position adjustment purposes.
#> Warning: Groups with fewer than two datapoints have been dropped.
#> ℹ Set `drop = FALSE` to consider such groups for position adjustment purposes.
#> Warning: Groups with fewer than two datapoints have been dropped.
#> ℹ Set `drop = FALSE` to consider such groups for position adjustment purposes.
#> Warning: Groups with fewer than two datapoints have been dropped.
#> ℹ Set `drop = FALSE` to consider such groups for position adjustment purposes.
#> Warning: Groups with fewer than two datapoints have been dropped.
#> ℹ Set `drop = FALSE` to consider such groups for position adjustment purposes.
#> Warning: Groups with fewer than two datapoints have been dropped.
#> ℹ Set `drop = FALSE` to consider such groups for position adjustment purposes.
#> Warning: Groups with fewer than two datapoints have been dropped.
#> ℹ Set `drop = FALSE` to consider such groups for position adjustment purposes.
#> Warning: Groups with fewer than two datapoints have been dropped.
#> ℹ Set `drop = FALSE` to consider such groups for position adjustment purposes.
#> Warning: Groups with fewer than two datapoints have been dropped.
#> ℹ Set `drop = FALSE` to consider such groups for position adjustment purposes.
#> Warning: Groups with fewer than two datapoints have been dropped.
#> ℹ Set `drop = FALSE` to consider such groups for position adjustment purposes.
#> Warning: Groups with fewer than two datapoints have been dropped.
#> ℹ Set `drop = FALSE` to consider such groups for position adjustment purposes.
#> Warning: Groups with fewer than two datapoints have been dropped.
#> ℹ Set `drop = FALSE` to consider such groups for position adjustment purposes.
#> Warning: Groups with fewer than two datapoints have been dropped.
#> ℹ Set `drop = FALSE` to consider such groups for position adjustment purposes.
# Visualize expression of the top DEGs
# Suppose we did comparison between G2M and S phase in each SubCellType
degs$Phase <- "G2M:S"
VizDEGs(degs,
object = scplotter::pancreas_sub, plot_type = "violin",
select = 2, comparison_by = "Phase", subset_by = "SubCellType"
)
#> Warning: Layer counts isn't present in the assay object; returning NULL
#> Warning: Groups with fewer than two datapoints have been dropped.
#> ℹ Set `drop = FALSE` to consider such groups for position adjustment purposes.
#> Warning: Groups with fewer than two datapoints have been dropped.
#> ℹ Set `drop = FALSE` to consider such groups for position adjustment purposes.
#> Warning: Groups with fewer than two datapoints have been dropped.
#> ℹ Set `drop = FALSE` to consider such groups for position adjustment purposes.
#> Warning: Groups with fewer than two datapoints have been dropped.
#> ℹ Set `drop = FALSE` to consider such groups for position adjustment purposes.
#> Warning: Groups with fewer than two datapoints have been dropped.
#> ℹ Set `drop = FALSE` to consider such groups for position adjustment purposes.
#> Warning: Groups with fewer than two datapoints have been dropped.
#> ℹ Set `drop = FALSE` to consider such groups for position adjustment purposes.
#> Warning: Groups with fewer than two datapoints have been dropped.
#> ℹ Set `drop = FALSE` to consider such groups for position adjustment purposes.
#> Warning: Groups with fewer than two datapoints have been dropped.
#> ℹ Set `drop = FALSE` to consider such groups for position adjustment purposes.
#> Warning: Groups with fewer than two datapoints have been dropped.
#> ℹ Set `drop = FALSE` to consider such groups for position adjustment purposes.
#> Warning: Groups with fewer than two datapoints have been dropped.
#> ℹ Set `drop = FALSE` to consider such groups for position adjustment purposes.
#> Warning: Groups with fewer than two datapoints have been dropped.
#> ℹ Set `drop = FALSE` to consider such groups for position adjustment purposes.
#> Warning: Groups with fewer than two datapoints have been dropped.
#> ℹ Set `drop = FALSE` to consider such groups for position adjustment purposes.
#> Warning: Groups with fewer than two datapoints have been dropped.
#> ℹ Set `drop = FALSE` to consider such groups for position adjustment purposes.
#> Warning: Groups with fewer than two datapoints have been dropped.
#> ℹ Set `drop = FALSE` to consider such groups for position adjustment purposes.
#> Warning: Groups with fewer than two datapoints have been dropped.
#> ℹ Set `drop = FALSE` to consider such groups for position adjustment purposes.
#> Warning: Groups with fewer than two datapoints have been dropped.
#> ℹ Set `drop = FALSE` to consider such groups for position adjustment purposes.
#> Warning: Groups with fewer than two datapoints have been dropped.
#> ℹ Set `drop = FALSE` to consider such groups for position adjustment purposes.
#> Warning: Groups with fewer than two datapoints have been dropped.
#> ℹ Set `drop = FALSE` to consider such groups for position adjustment purposes.
#> Warning: Groups with fewer than two datapoints have been dropped.
#> ℹ Set `drop = FALSE` to consider such groups for position adjustment purposes.
#> Warning: Groups with fewer than two datapoints have been dropped.
#> ℹ Set `drop = FALSE` to consider such groups for position adjustment purposes.
#> Warning: Groups with fewer than two datapoints have been dropped.
#> ℹ Set `drop = FALSE` to consider such groups for position adjustment purposes.
#> Warning: Groups with fewer than two datapoints have been dropped.
#> ℹ Set `drop = FALSE` to consider such groups for position adjustment purposes.
#> Warning: Groups with fewer than two datapoints have been dropped.
#> ℹ Set `drop = FALSE` to consider such groups for position adjustment purposes.
#> Warning: Groups with fewer than two datapoints have been dropped.
#> ℹ Set `drop = FALSE` to consider such groups for position adjustment purposes.
#> Warning: Groups with fewer than two datapoints have been dropped.
#> ℹ Set `drop = FALSE` to consider such groups for position adjustment purposes.
#> Warning: Groups with fewer than two datapoints have been dropped.
#> ℹ Set `drop = FALSE` to consider such groups for position adjustment purposes.
#> Warning: Groups with fewer than two datapoints have been dropped.
#> ℹ Set `drop = FALSE` to consider such groups for position adjustment purposes.
#> Warning: Groups with fewer than two datapoints have been dropped.
#> ℹ Set `drop = FALSE` to consider such groups for position adjustment purposes.
#> Warning: Groups with fewer than two datapoints have been dropped.
#> ℹ Set `drop = FALSE` to consider such groups for position adjustment purposes.
#> Warning: Groups with fewer than two datapoints have been dropped.
#> ℹ Set `drop = FALSE` to consider such groups for position adjustment purposes.
#> Warning: Groups with fewer than two datapoints have been dropped.
#> ℹ Set `drop = FALSE` to consider such groups for position adjustment purposes.
#> Warning: Groups with fewer than two datapoints have been dropped.
#> ℹ Set `drop = FALSE` to consider such groups for position adjustment purposes.
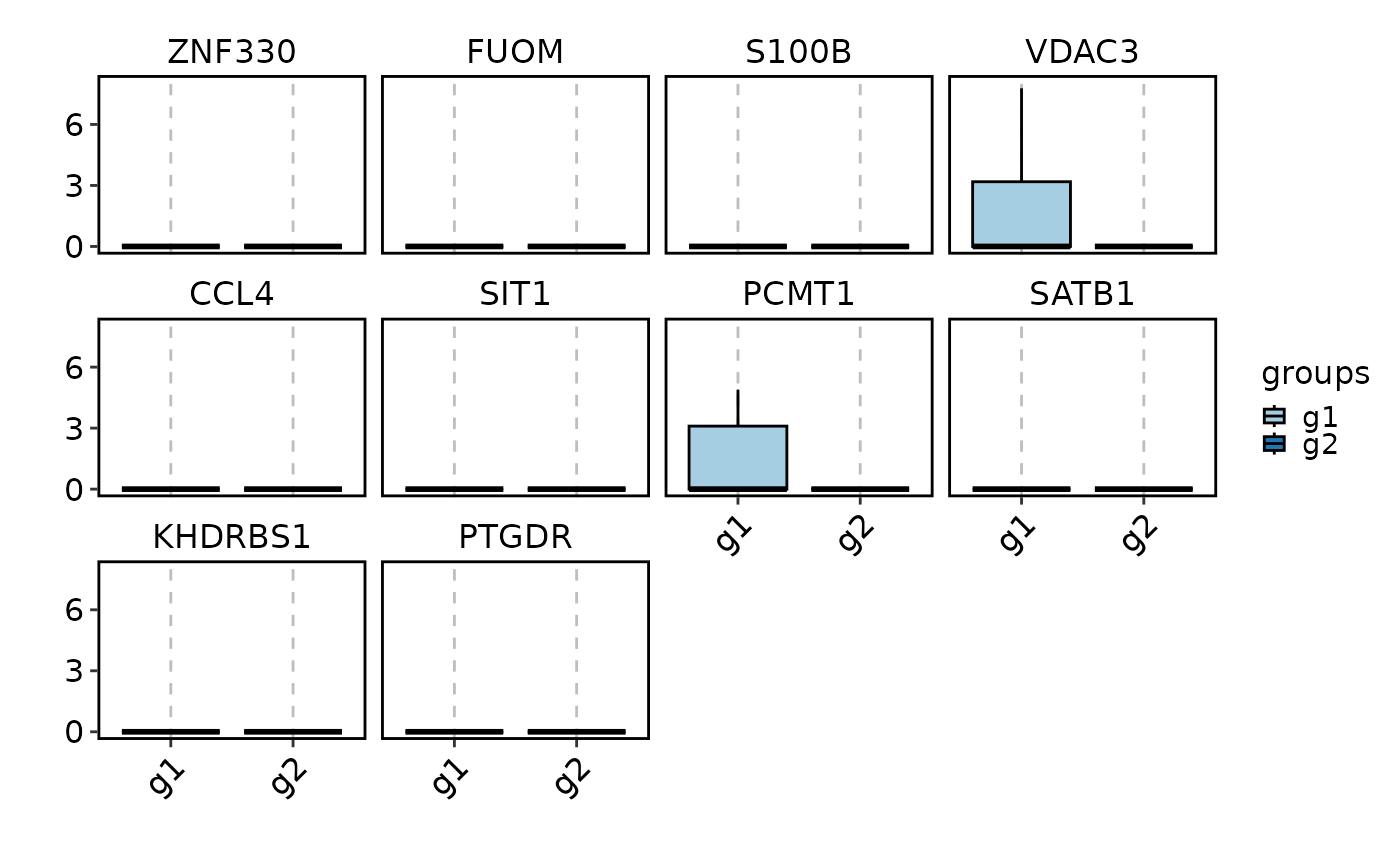
 VizDEGs(degs,
object = scplotter::pancreas_sub, plot_type = "box",
select = 2, comparison_by = "Phase", subset_by = "SubCellType"
)
#> Warning: Layer counts isn't present in the assay object; returning NULL
VizDEGs(degs,
object = scplotter::pancreas_sub, plot_type = "box",
select = 2, comparison_by = "Phase", subset_by = "SubCellType"
)
#> Warning: Layer counts isn't present in the assay object; returning NULL
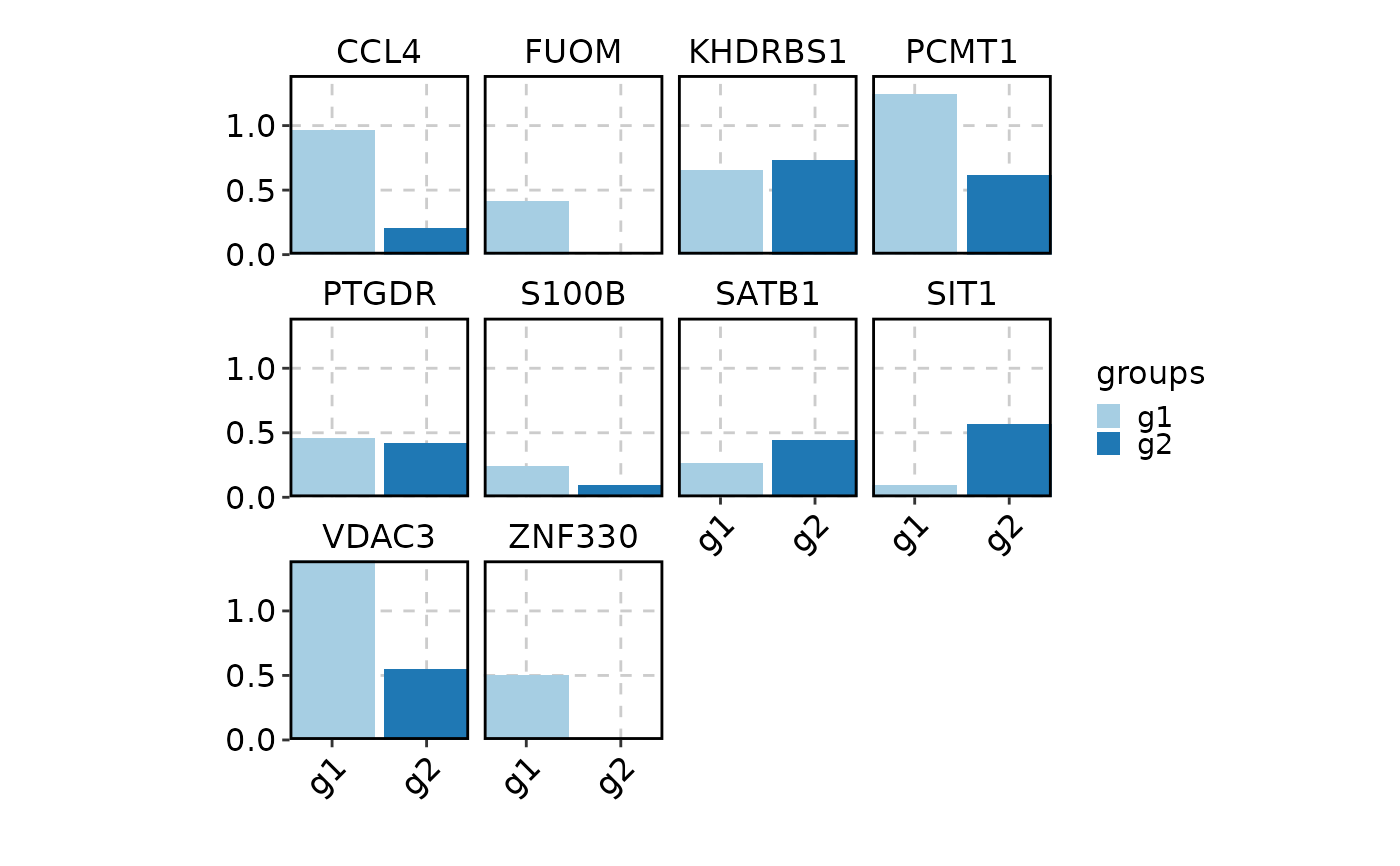
 VizDEGs(degs,
object = scplotter::pancreas_sub, plot_type = "bar",
select = 2, comparison_by = "Phase", subset_by = "SubCellType"
)
#> Warning: Layer counts isn't present in the assay object; returning NULL
VizDEGs(degs,
object = scplotter::pancreas_sub, plot_type = "bar",
select = 2, comparison_by = "Phase", subset_by = "SubCellType"
)
#> Warning: Layer counts isn't present in the assay object; returning NULL
 VizDEGs(degs,
object = scplotter::pancreas_sub, plot_type = "ridge",
select = 1, comparison_by = "Phase", subset_by = "SubCellType"
)
#> Warning: Layer counts isn't present in the assay object; returning NULL
#> Picking joint bandwidth of 0.283
#> Picking joint bandwidth of 0.252
#> Picking joint bandwidth of 0.196
#> Picking joint bandwidth of 0.0311
#> Picking joint bandwidth of 0.0338
#> Picking joint bandwidth of 0.382
#> Picking joint bandwidth of 0.0675
#> Picking joint bandwidth of 0.031
#> Picking joint bandwidth of 0.537
#> Picking joint bandwidth of 0.133
#> Picking joint bandwidth of 0.308
#> Picking joint bandwidth of 0.3
#> Picking joint bandwidth of 0.505
#> Picking joint bandwidth of 0.283
#> Picking joint bandwidth of 0.326
#> Picking joint bandwidth of 0.505
#> Picking joint bandwidth of 0.398
#> Picking joint bandwidth of 0.305
#> Picking joint bandwidth of 0.518
#> Picking joint bandwidth of 0.455
#> Picking joint bandwidth of 0.135
#> Picking joint bandwidth of 0.526
#> Picking joint bandwidth of 0.353
#> Picking joint bandwidth of 0.526
#> Picking joint bandwidth of NaN
#> Picking joint bandwidth of NaN
#> Picking joint bandwidth of NaN
#> Picking joint bandwidth of NaN
#> Picking joint bandwidth of NaN
#> Picking joint bandwidth of NaN
#> Picking joint bandwidth of NaN
#> Picking joint bandwidth of NaN
#> Warning: No shared levels found between `names(values)` of the manual scale and the
#> data's fill values.
#> Picking joint bandwidth of 0.283
#> Picking joint bandwidth of 0.252
#> Picking joint bandwidth of 0.196
#> Picking joint bandwidth of 0.0311
#> Picking joint bandwidth of 0.0338
#> Picking joint bandwidth of 0.382
#> Picking joint bandwidth of 0.0675
#> Picking joint bandwidth of 0.031
#> Picking joint bandwidth of 0.537
#> Picking joint bandwidth of 0.133
#> Picking joint bandwidth of 0.308
#> Picking joint bandwidth of 0.3
#> Picking joint bandwidth of 0.505
#> Picking joint bandwidth of 0.283
#> Picking joint bandwidth of 0.326
#> Picking joint bandwidth of 0.505
#> Picking joint bandwidth of 0.398
#> Picking joint bandwidth of 0.305
#> Picking joint bandwidth of 0.518
#> Picking joint bandwidth of 0.455
#> Picking joint bandwidth of 0.135
#> Picking joint bandwidth of 0.526
#> Picking joint bandwidth of 0.353
#> Picking joint bandwidth of 0.526
#> Picking joint bandwidth of NaN
#> Picking joint bandwidth of NaN
#> Picking joint bandwidth of NaN
#> Picking joint bandwidth of NaN
#> Picking joint bandwidth of NaN
#> Picking joint bandwidth of NaN
#> Picking joint bandwidth of NaN
#> Picking joint bandwidth of NaN
#> Warning: No shared levels found between `names(values)` of the manual scale and the
#> data's fill values.
VizDEGs(degs,
object = scplotter::pancreas_sub, plot_type = "ridge",
select = 1, comparison_by = "Phase", subset_by = "SubCellType"
)
#> Warning: Layer counts isn't present in the assay object; returning NULL
#> Picking joint bandwidth of 0.283
#> Picking joint bandwidth of 0.252
#> Picking joint bandwidth of 0.196
#> Picking joint bandwidth of 0.0311
#> Picking joint bandwidth of 0.0338
#> Picking joint bandwidth of 0.382
#> Picking joint bandwidth of 0.0675
#> Picking joint bandwidth of 0.031
#> Picking joint bandwidth of 0.537
#> Picking joint bandwidth of 0.133
#> Picking joint bandwidth of 0.308
#> Picking joint bandwidth of 0.3
#> Picking joint bandwidth of 0.505
#> Picking joint bandwidth of 0.283
#> Picking joint bandwidth of 0.326
#> Picking joint bandwidth of 0.505
#> Picking joint bandwidth of 0.398
#> Picking joint bandwidth of 0.305
#> Picking joint bandwidth of 0.518
#> Picking joint bandwidth of 0.455
#> Picking joint bandwidth of 0.135
#> Picking joint bandwidth of 0.526
#> Picking joint bandwidth of 0.353
#> Picking joint bandwidth of 0.526
#> Picking joint bandwidth of NaN
#> Picking joint bandwidth of NaN
#> Picking joint bandwidth of NaN
#> Picking joint bandwidth of NaN
#> Picking joint bandwidth of NaN
#> Picking joint bandwidth of NaN
#> Picking joint bandwidth of NaN
#> Picking joint bandwidth of NaN
#> Warning: No shared levels found between `names(values)` of the manual scale and the
#> data's fill values.
#> Picking joint bandwidth of 0.283
#> Picking joint bandwidth of 0.252
#> Picking joint bandwidth of 0.196
#> Picking joint bandwidth of 0.0311
#> Picking joint bandwidth of 0.0338
#> Picking joint bandwidth of 0.382
#> Picking joint bandwidth of 0.0675
#> Picking joint bandwidth of 0.031
#> Picking joint bandwidth of 0.537
#> Picking joint bandwidth of 0.133
#> Picking joint bandwidth of 0.308
#> Picking joint bandwidth of 0.3
#> Picking joint bandwidth of 0.505
#> Picking joint bandwidth of 0.283
#> Picking joint bandwidth of 0.326
#> Picking joint bandwidth of 0.505
#> Picking joint bandwidth of 0.398
#> Picking joint bandwidth of 0.305
#> Picking joint bandwidth of 0.518
#> Picking joint bandwidth of 0.455
#> Picking joint bandwidth of 0.135
#> Picking joint bandwidth of 0.526
#> Picking joint bandwidth of 0.353
#> Picking joint bandwidth of 0.526
#> Picking joint bandwidth of NaN
#> Picking joint bandwidth of NaN
#> Picking joint bandwidth of NaN
#> Picking joint bandwidth of NaN
#> Picking joint bandwidth of NaN
#> Picking joint bandwidth of NaN
#> Picking joint bandwidth of NaN
#> Picking joint bandwidth of NaN
#> Warning: No shared levels found between `names(values)` of the manual scale and the
#> data's fill values.
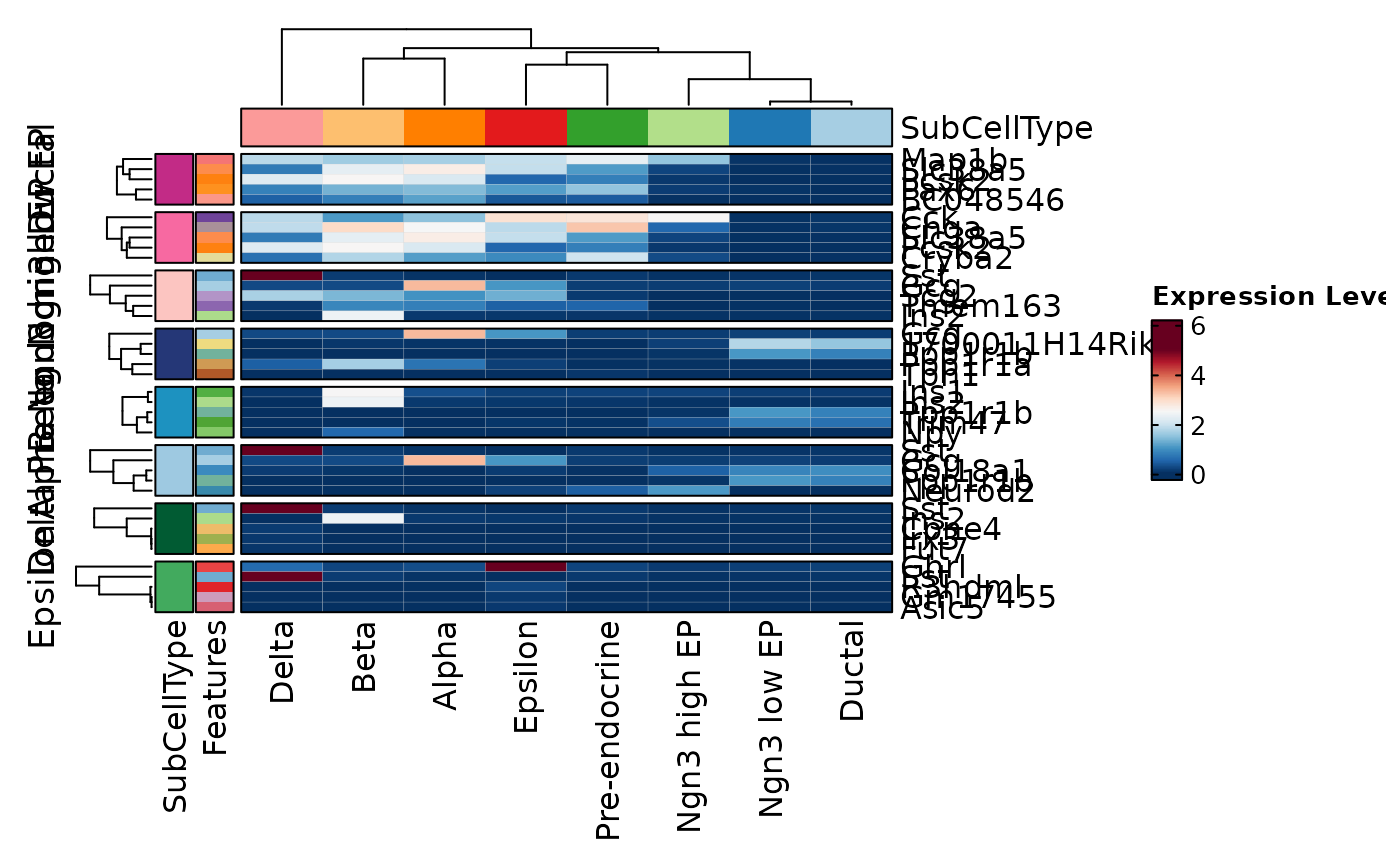
 VizDEGs(degs,
object = scplotter::pancreas_sub, plot_type = "heatmap",
cluster_columns = FALSE, comparison_by = "Phase", subset_by = "SubCellType"
)
#> Warning: Layer counts isn't present in the assay object; returning NULL
VizDEGs(degs,
object = scplotter::pancreas_sub, plot_type = "heatmap",
cluster_columns = FALSE, comparison_by = "Phase", subset_by = "SubCellType"
)
#> Warning: Layer counts isn't present in the assay object; returning NULL
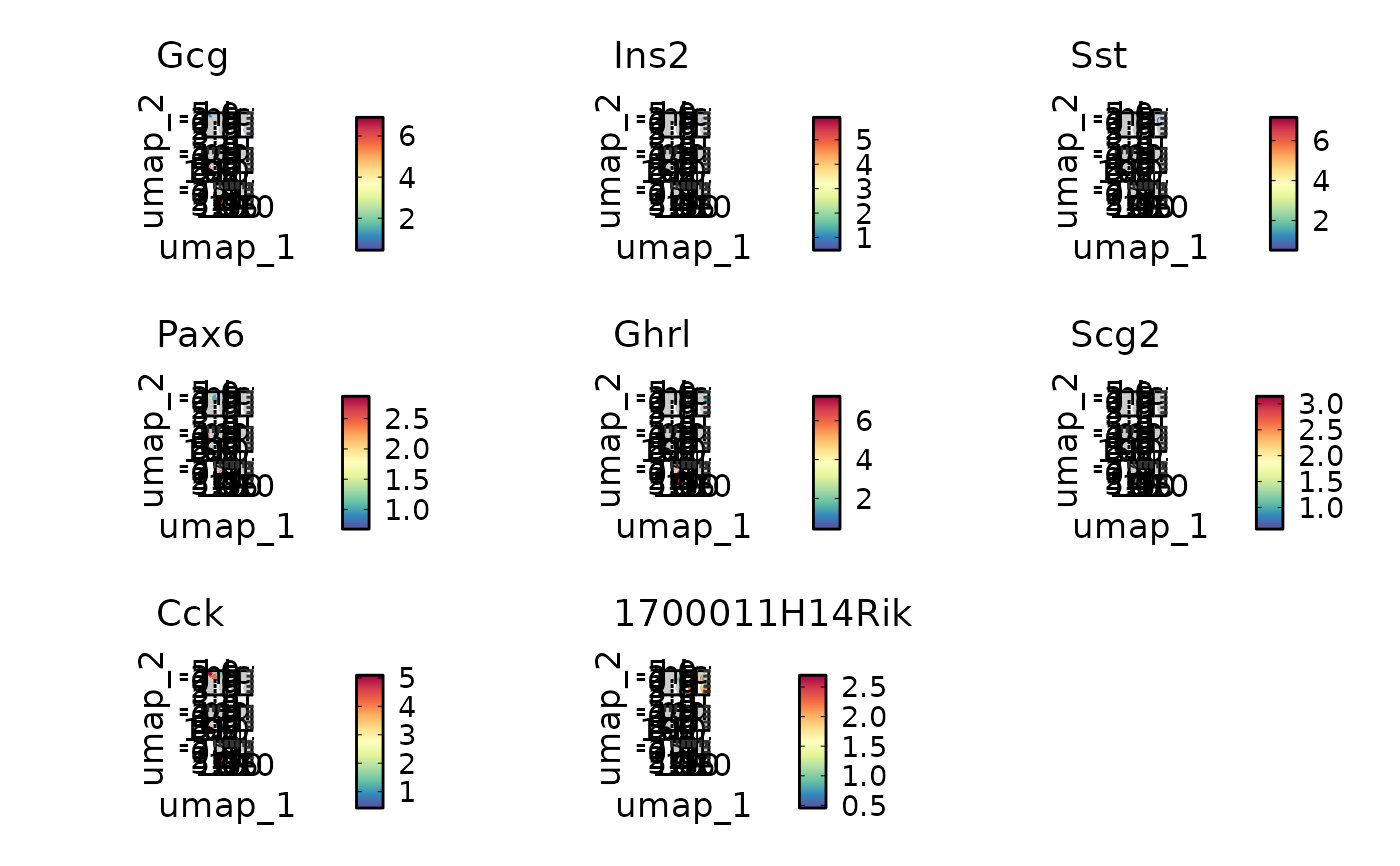
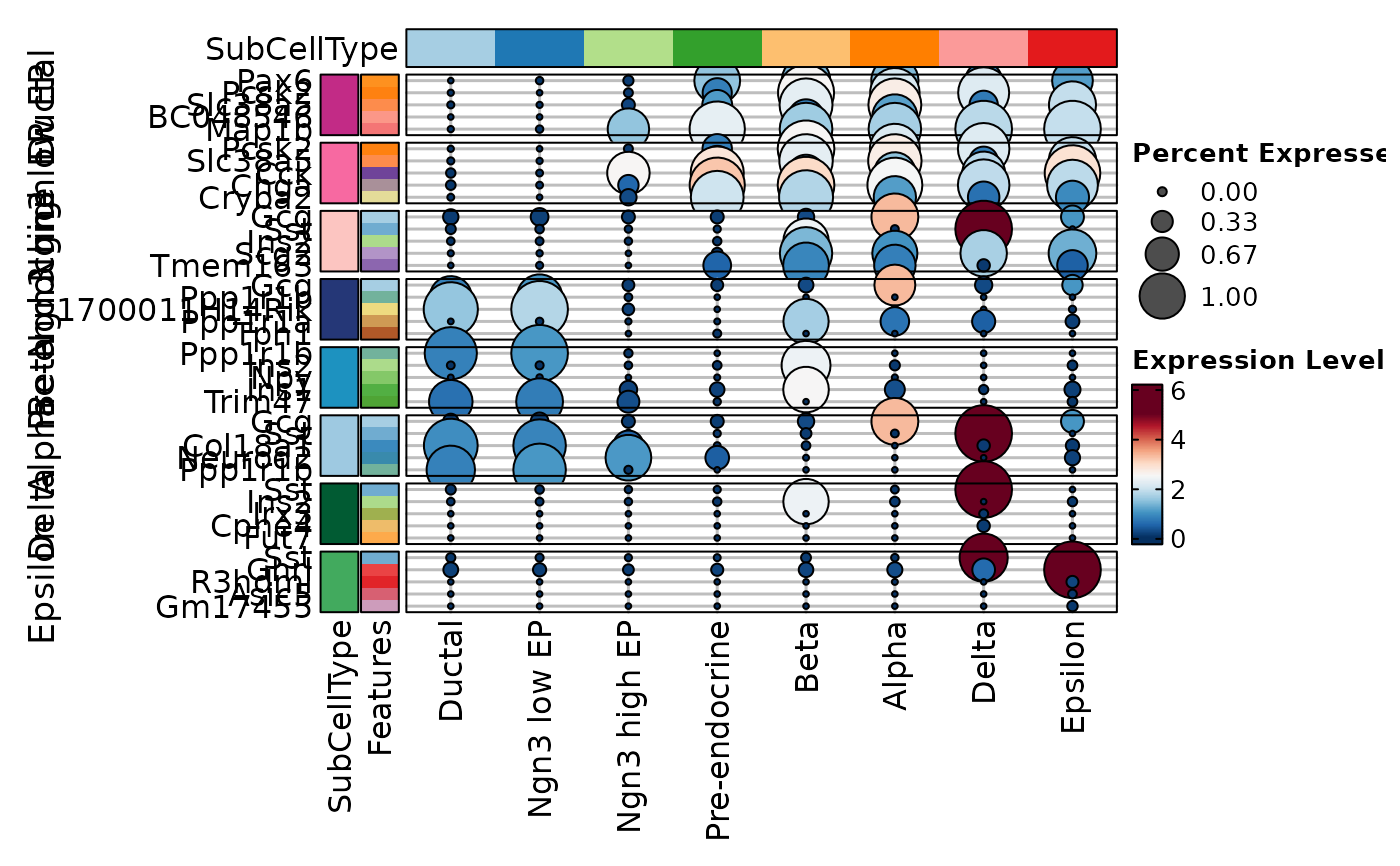
 VizDEGs(degs,
object = scplotter::pancreas_sub, plot_type = "dot",
select = 1, comparison_by = "Phase", subset_by = "SubCellType"
)
#> Warning: Layer counts isn't present in the assay object; returning NULL
VizDEGs(degs,
object = scplotter::pancreas_sub, plot_type = "dot",
select = 1, comparison_by = "Phase", subset_by = "SubCellType"
)
#> Warning: Layer counts isn't present in the assay object; returning NULL
 # }
# }