PrepareVennData is helper function to process the input data for Venn diagram.
Usage
PrepareVennData(
  data,
  in_form = NULL,
  group_by = NULL,
  group_by_sep = "_",
  id_by = NULL
)

VennDiagram(
  data,
  in_form = NULL,
  split_by = NULL,
  split_by_sep = "_",
  group_by = NULL,
  group_by_sep = "_",
  id_by = NULL,
  label = "count",
  label_fg = "black",
  label_size = NULL,
  label_bg = "white",
  label_bg_r = 0.1,
  fill_mode = "count",
  fill_name = NULL,
  palette = ifelse(fill_mode == "set", "Paired", "Spectral"),
  palcolor = NULL,
  alpha = 1,
  theme = "theme_this",
  theme_args = list(),
  title = NULL,
  subtitle = NULL,
  legend.position = "right",
  legend.direction = "vertical",
  combine = TRUE,
  nrow = NULL,
  ncol = NULL,
  byrow = TRUE,
  seed = 8525,
  axes = NULL,
  axis_titles = axes,
  guides = NULL,
  design = NULL,
  ...
)
Arguments
- data
A data frame or a list or a VennPlotData object.
- in_form
A character string indicating the datatype of the input data. Possible values are "long", "wide", "list", "venn" or NULL. "long" indicates the data is in long format. "wide" indicates the data is in wide format. "list" indicates the data is a list. "venn" indicates the data is a VennPlotData object. NULL indicates the function will detect the datatype of the input data.
A long format data would look like:
group_by id_by
A        a1
A        a2
B        a1
B        a3
...
A wide format data would look like:
A    B
TRUE TRUE
TRUE FALSE
FALSE TRUE
...
A list format data would look like:
- group_by
A character string specifying the column name of the data frame to group the data.
- group_by_sep
A character string to concatenate the columns in
group_by, if multiple columns are provided and the in_form is "long".- id_by
A character string specifying the column name of the data frame to identify the instances. Required when
group_byis a single column and data is a data frame.- split_by
The column(s) to split data by and plot separately.
- split_by_sep
The separator for multiple split_by columns. See
split_by- label
A character string specifying the label to show on the Venn diagram. Possible values are "count", "percent", "both", "none" and a function. "count" indicates the count of the intersection. "percent" indicates the percentage of the intersection. "both" indicates both the count and the percentage of the intersection. "none" indicates no label. If it is a function, if takes a data frame as input and returns a character vector as label. The data frame has columns "id", "X", "Y", "name", "item" and "count".
- label_fg
A character string specifying the color of the label text.
- label_size
A numeric value specifying the size of the label text.
- label_bg
A character string specifying the background color of the label.
- label_bg_r
A numeric value specifying the radius of the background of the label.
- fill_mode
A character string specifying the fill mode of the Venn diagram. Possible values are "count", "set", "count_rev". "count" indicates the fill color is based on the count of the intersection. "set" indicates the fill color is based on the set of the intersection. "count_rev" indicates the fill color is based on the count of the intersection in reverse order. The palette will be continuous for "count" and "count_rev". The palette will be discrete for "set".
- fill_name
A character string to name the legend of colorbar.
- palette
A character string specifying the palette to use. A named list or vector can be used to specify the palettes for different
split_byvalues.- palcolor
A character string specifying the color to use in the palette. A named list can be used to specify the colors for different
split_byvalues. If some values are missing, the values from the palette will be used (palcolor will be NULL for those values).- alpha
A numeric value specifying the transparency of the plot.
- theme
A character string or a theme class (i.e. ggplot2::theme_classic) specifying the theme to use. Default is "theme_this".
- theme_args
A list of arguments to pass to the theme function.
- title
A character string specifying the title of the plot. A function can be used to generate the title based on the default title. This is useful when split_by is used and the title needs to be dynamic.
- subtitle
A character string specifying the subtitle of the plot.
- legend.position
A character string specifying the position of the legend. if
waiver(), for single groups, the legend will be "none", otherwise "right".- legend.direction
A character string specifying the direction of the legend.
- combine
Whether to combine the plots into one when facet is FALSE. Default is TRUE.
- nrow
A numeric value specifying the number of rows in the facet.
- ncol
A numeric value specifying the number of columns in the facet.
- byrow
A logical value indicating whether to fill the plots by row.
- seed
The random seed to use. Default is 8525.
- axes
A string specifying how axes should be treated. Passed to
patchwork::wrap_plots(). Only relevant whensplit_byis used andcombineis TRUE. Options are:'keep' will retain all axes in individual plots.
'collect' will remove duplicated axes when placed in the same run of rows or columns of the layout.
'collect_x' and 'collect_y' will remove duplicated x-axes in the columns or duplicated y-axes in the rows respectively.
- axis_titles
A string specifying how axis titltes should be treated. Passed to
patchwork::wrap_plots(). Only relevant whensplit_byis used andcombineis TRUE. Options are:'keep' will retain all axis titles in individual plots.
'collect' will remove duplicated titles in one direction and merge titles in the opposite direction.
'collect_x' and 'collect_y' control this for x-axis titles and y-axis titles respectively.
- guides
A string specifying how guides should be treated in the layout. Passed to
patchwork::wrap_plots(). Only relevant whensplit_byis used andcombineis TRUE. Options are:'collect' will collect guides below to the given nesting level, removing duplicates.
'keep' will stop collection at this level and let guides be placed alongside their plot.
'auto' will allow guides to be collected if a upper level tries, but place them alongside the plot if not.
- design
Specification of the location of areas in the layout, passed to
patchwork::wrap_plots(). Only relevant whensplit_byis used andcombineis TRUE. When specified,nrow,ncol, andbyroware ignored. Seepatchwork::wrap_plots()for more details.- ...
Additional arguments.
Value
A VennPlotData object
A combined ggplot object or wrap_plots object or a list of ggplot objects
Examples
# \donttest{
set.seed(8525)
data = list(
A = sort(sample(letters, 8)),
B = sort(sample(letters, 8)),
C = sort(sample(letters, 8)),
D = sort(sample(letters, 8))
)
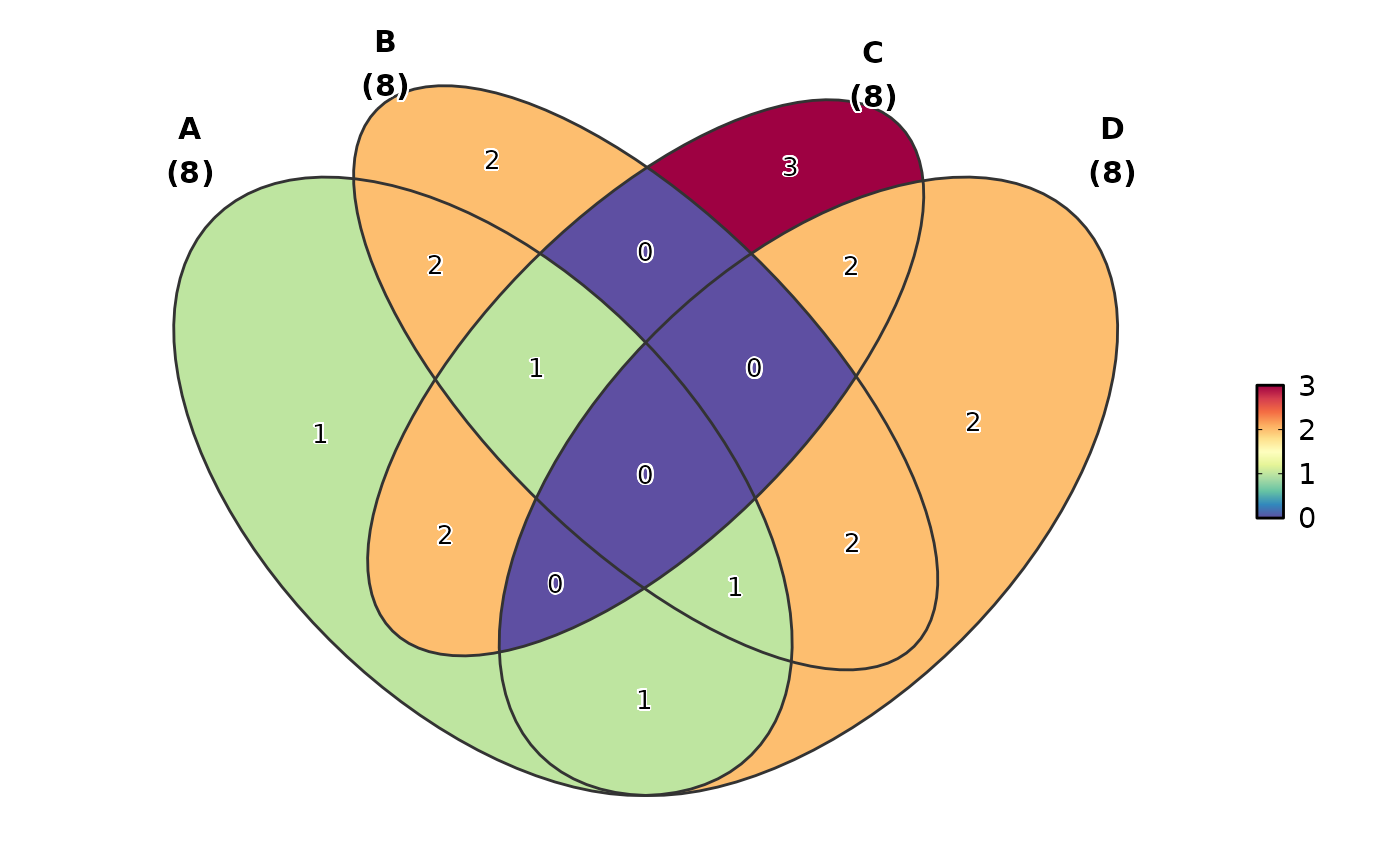
VennDiagram(data)
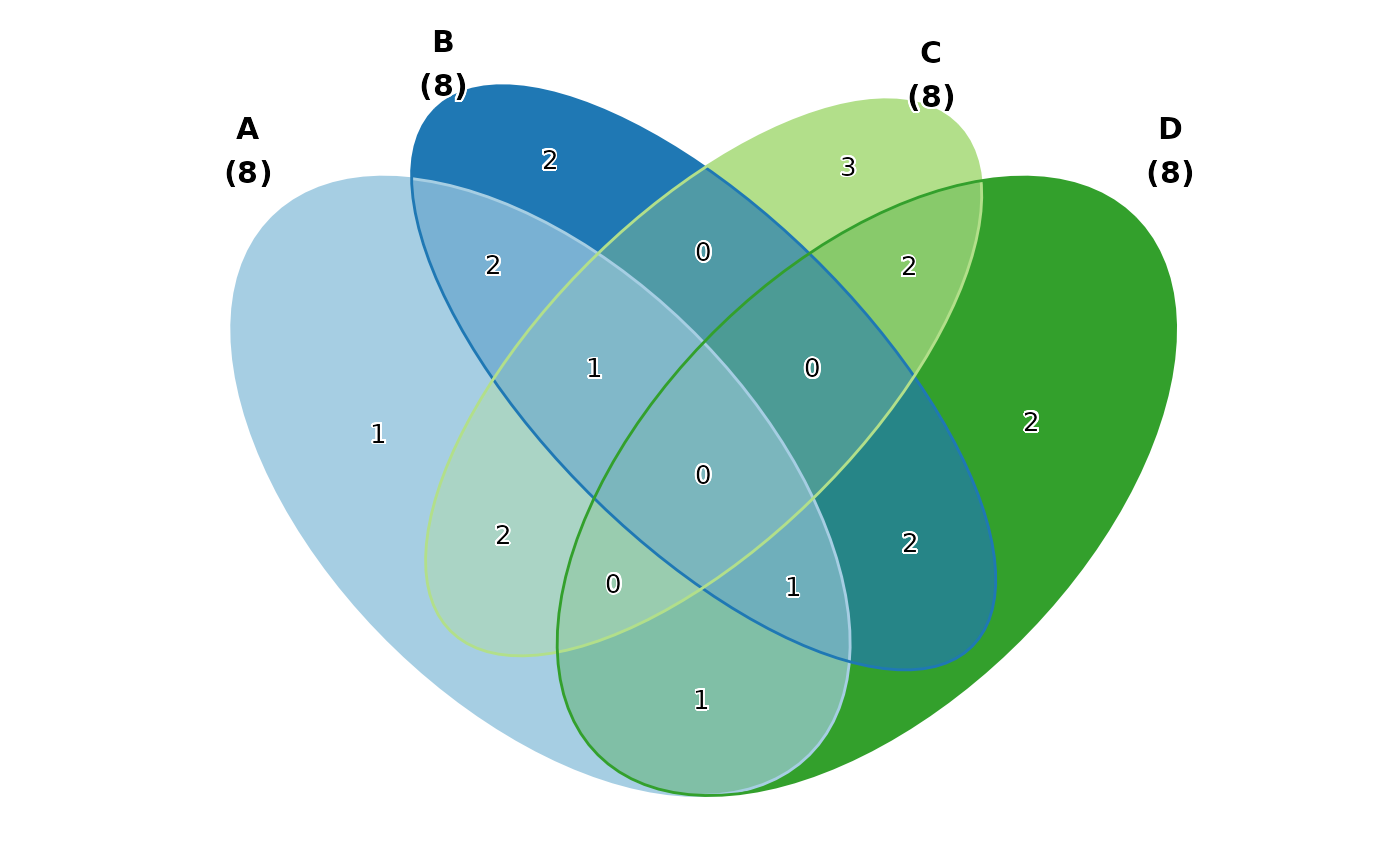
 VennDiagram(data, fill_mode = "set")
 VennDiagram(data, label = "both")
 # label with a function
VennDiagram(data, label = function(df) df$name)
# label with a function
VennDiagram(data, label = function(df) df$name)
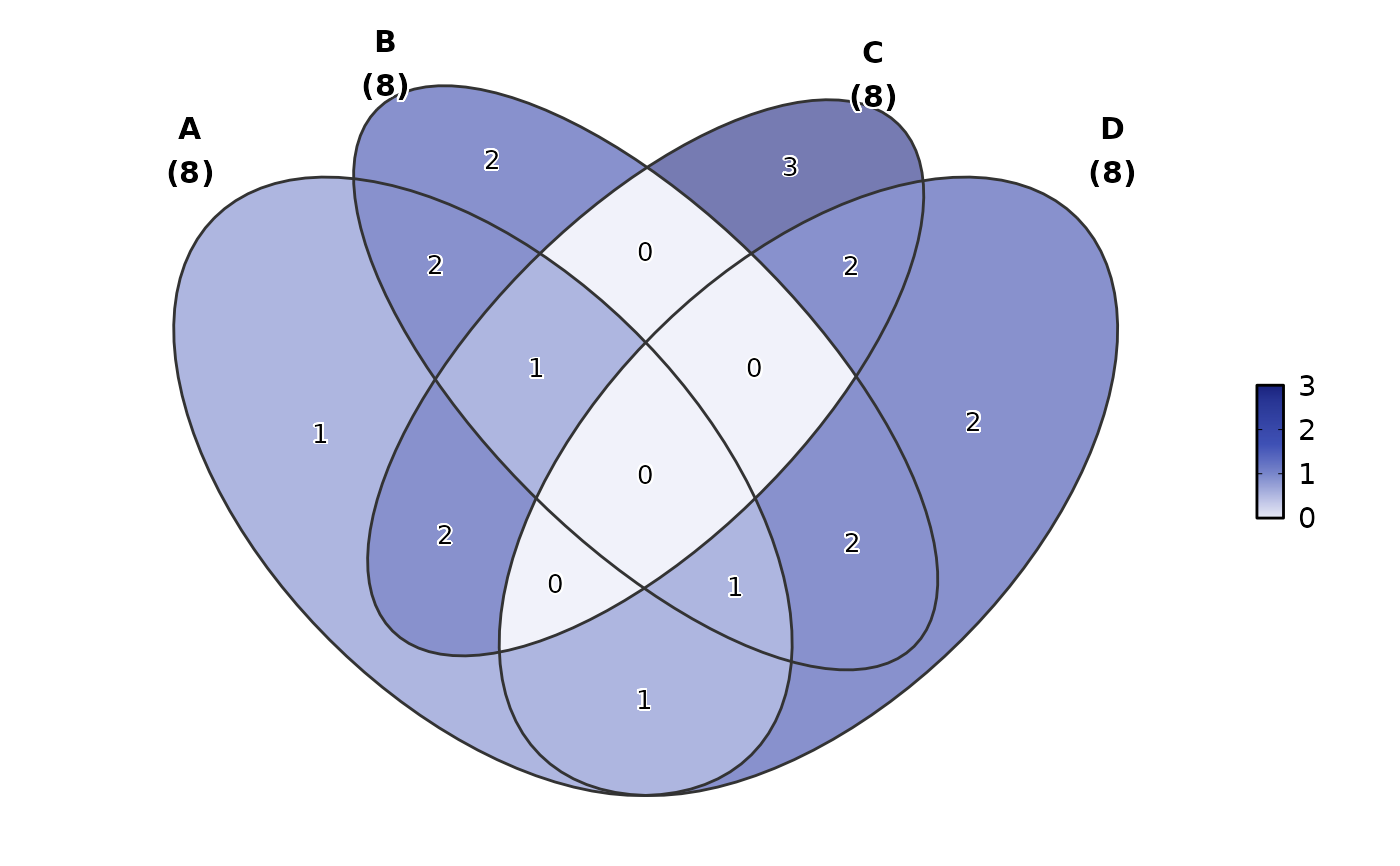
 VennDiagram(data, palette = "material-indigo", alpha = 0.6)
 # }
# }