Draws a radar chart (concentric circular grid) or spider chart (polygonal grid) displaying multivariate data in a two-dimensional polar coordinate system. Each x-axis category is placed at an evenly spaced angular position around the chart, and numeric values are plotted along the radial axis.
The function supports count aggregation (omit y to
plot observation counts), proportion scaling (via
scale_y), per-group colour control, faceting, and splitting
into separate sub-plots via split_by.
SpiderPlot is an alias that renders the same data with
polygonal grid lines (spider chart style) by using
polygon = TRUE.
A variant of RadarPlot that renders the chart with
straight polygonal grid lines (spider chart) instead of concentric
circles. Internally, it calls RadarPlotAtomic with
polygon = TRUE but is otherwise identical to
RadarPlot in behaviour and parameters.
Usage
RadarPlot(
  data,
  x,
  x_sep = "_",
  group_by = NULL,
  group_by_sep = "_",
  y = NULL,
  group_name = NULL,
  groups = NULL,
  scale_y = c("group", "global", "x", "none"),
  y_min = 0,
  y_max = NULL,
  y_nbreaks = 4,
  bg_color = "grey80",
  bg_alpha = 0.1,
  fill = TRUE,
  linewidth = 1,
  pt_size = 4,
  max_charwidth = 16,
  split_by = NULL,
  split_by_sep = "_",
  theme = "theme_this",
  theme_args = list(),
  palette = "Paired",
  palcolor = NULL,
  palreverse = FALSE,
  facet_by = NULL,
  facet_scales = "fixed",
  facet_ncol = NULL,
  facet_nrow = NULL,
  facet_byrow = TRUE,
  alpha = 0.2,
  aspect.ratio = 1,
  legend.position = waiver(),
  legend.direction = "vertical",
  keep_na = FALSE,
  keep_empty = FALSE,
  title = NULL,
  subtitle = NULL,
  seed = 8525,
  combine = TRUE,
  nrow = NULL,
  ncol = NULL,
  byrow = TRUE,
  axes = NULL,
  axis_titles = axes,
  guides = NULL,
  design = NULL,
  ...
)

SpiderPlot(
  data,
  x,
  x_sep = "_",
  group_by = NULL,
  group_by_sep = "_",
  y = NULL,
  group_name = NULL,
  groups = NULL,
  scale_y = c("group", "global", "x", "none"),
  y_min = 0,
  y_max = NULL,
  y_nbreaks = 4,
  bg_color = "grey80",
  bg_alpha = 0.1,
  fill = TRUE,
  linewidth = 1,
  pt_size = 4,
  max_charwidth = 16,
  split_by = NULL,
  split_by_sep = "_",
  theme = "theme_this",
  theme_args = list(),
  palette = "Paired",
  palcolor = NULL,
  palreverse = FALSE,
  facet_by = NULL,
  facet_scales = "fixed",
  facet_ncol = NULL,
  facet_nrow = NULL,
  facet_byrow = TRUE,
  alpha = 0.2,
  aspect.ratio = 1,
  legend.position = waiver(),
  legend.direction = "vertical",
  keep_na = FALSE,
  keep_empty = FALSE,
  title = NULL,
  subtitle = NULL,
  seed = 8525,
  combine = TRUE,
  nrow = NULL,
  ncol = NULL,
  byrow = TRUE,
  axes = NULL,
  axis_titles = axes,
  guides = NULL,
  design = NULL,
  ...
)
Arguments
- data
A data frame.
- x
A character string specifying the column name of the data frame to plot for the x-axis.
- x_sep
A character string used to join multiple
xcolumns. Default"_". Ignored whenxis a single column.- group_by
Columns to group the data for plotting For those plotting functions that do not support multiple groups, They will be concatenated into one column, using
group_by_sepas the separator- group_by_sep
The separator for multiple group_by columns. See
group_by- y
A character string specifying the column name of the data frame to plot for the y-axis.
- group_name
A character string used as the colour/fill legend title. When
NULL, thegroup_bycolumn name is used.- groups
A character vector of group values (in the
group_bycolumn) to include in the plot. WhenNULL, all groups are included. This can control which groups appear and their legend order. Implieskeep_empty = FALSEfor thegroup_bycolumn: groups not present in the data are not shown in the legend.- scale_y
How should the radial axis be scaled? Default is
"group". Options are"group","global","x", and"none"."group"— scaled to the fraction within each group."global"— scaled to the fraction of the total."x"— scaled to the fraction within each x-axis category."none"— raw counts or values, no scaling.
- y_min
A numeric value setting the minimum of the radial axis. Default
0.- y_max
A numeric value setting the maximum of the radial axis. When
NULL, the maximum data value is used.- y_nbreaks
A numeric value for the number of breaks (concentric grid lines) on the radial axis. Default
4.- bg_color
A character string specifying the background fill colour. Default
"grey80".- bg_alpha
A numeric value for the transparency of the background fill. Default
0.1.- fill
A logical value. When
TRUE(default), the data polygons are filled with the group colour. WhenFALSE, only outlines are drawn.- linewidth
A numeric value for the width of the polygon outline lines. Default
1.- pt_size
A numeric value for the size of the data point markers. Default
4.- max_charwidth
A numeric value for the maximum character width of x-axis labels before wrapping. Default
16.- split_by
The column(s) to split the data by and produce separate sub-plots. Multiple columns are concatenated with
split_by_sep.- split_by_sep
A character string to separate concatenated
split_bycolumns. Default"_".- theme
A character string or a theme class (i.e. ggplot2::theme_classic) specifying the theme to use. Default is "theme_this".
- theme_args
A list of arguments to pass to the theme function.
- palette
A character string specifying the palette to use. A named list or vector can be used to specify the palettes for different
split_byvalues.- palcolor
A character string specifying the color to use in the palette. A named list can be used to specify the colors for different
split_byvalues. If some values are missing, the values from the palette will be used (palcolor will be NULL for those values).- palreverse
A logical value indicating whether to reverse the palette. Default is FALSE.
- facet_by
A character string specifying the column name of the data frame to facet the plot. Otherwise, the data will be split by
split_byand generate multiple plots and combine them into one usingpatchwork::wrap_plots- facet_scales
Whether to scale the axes of facets. Default is "fixed" Other options are "free", "free_x", "free_y". See
ggplot2::facet_wrap- facet_ncol
A numeric value specifying the number of columns in the facet. When facet_by is a single column and facet_wrap is used.
- facet_nrow
A numeric value specifying the number of rows in the facet. When facet_by is a single column and facet_wrap is used.
- facet_byrow
A logical value indicating whether to fill the plots by row. Default is TRUE.
- alpha
A numeric value specifying the transparency of the plot.
- aspect.ratio
A numeric value specifying the aspect ratio of the plot.
- legend.position
A character string specifying the position of the legend. if
waiver(), for single groups, the legend will be "none", otherwise "right".- legend.direction
A character string specifying the direction of the legend.
- keep_na
A logical value or a character to replace the NA values in the data. It can also take a named list to specify different behavior for different columns. If TRUE or NA, NA values will be replaced with NA. If FALSE, NA values will be removed from the data before plotting. If a character string is provided, NA values will be replaced with the provided string. If a named vector/list is provided, the names should be the column names to apply the behavior to, and the values should be one of TRUE, FALSE, or a character string. Without a named vector/list, the behavior applies to categorical/character columns used on the plot, for example, the
x,group_by,fill_by, etc.- keep_empty
One of FALSE, TRUE and "level". It can also take a named list to specify different behavior for different columns. Without a named list, the behavior applies to the categorical/character columns used on the plot, for example, the
x,group_by,fill_by, etc.FALSE(default): Drop empty factor levels from the data before plotting.TRUE: Keep empty factor levels and show them as a separate category in the plot."level": Keep empty factor levels, but do not show them in the plot. But they will be assigned colors from the palette to maintain consistency across multiple plots. Alias:levels
- title
A character string specifying the title of the plot. A function can be used to generate the title based on the default title. This is useful when split_by is used and the title needs to be dynamic.
- subtitle
A character string specifying the subtitle of the plot.
- seed
A numeric seed for reproducibility. Passed to
validate_common_args().- combine
Logical; when
TRUE(default), returns a combinedpatchworkobject. WhenFALSE, returns a named list of individualggplotobjects.- ncol, nrow
Integer number of columns / rows for the combined layout (passed to
wrap_plots).- byrow
Logical; fill the combined layout by row. Default
TRUE(passed towrap_plots).- axes
A character string specifying how axes should be treated across the combined layout (passed to
wrap_plots).- axis_titles
A character string specifying how axis titles should be treated across the combined layout. Defaults to
axes.- guides
A character string specifying how guides (legends) should be collected across panels (passed to
combine_plots()).- design
A custom layout design for the combined plot (passed to
combine_plots()).- ...
Additional arguments.
Value
A ggplot object (when combine = TRUE and
split_by is NULL), a patchwork object (when
combine = TRUE and split_by is provided), or a named
list of ggplot objects (when combine = FALSE), each
with height and width attributes in inches.
A ggplot object (when combine = TRUE and
split_by is NULL), a patchwork object (when
combine = TRUE and split_by is provided), or a named
list of ggplot objects (when combine = FALSE), each
with height and width attributes in inches.
split_by Workflow
When split_by is provided:
check_keep_na()andcheck_keep_empty()normalise thekeep_na/keep_emptyarguments for all relevant columns (x,split_by,group_by,facet_by).The
split_bycolumn is validated and its NA / empty levels are processed viaprocess_keep_na_empty(). It is then removed from the per-columnkeep_na/keep_emptylists.The data frame is split by
split_by(preserving level order). Ifsplit_byisNULL, the data is wrapped in a single-element list with name"...".Per-split
palette,palcolor,legend.position, andlegend.directionare resolved viacheck_palette(),check_palcolor(), andcheck_legend().RadarPlotAtomic()is called for each split withpolygon = FALSE. Iftitleis a function, it receives the split level name and can generate dynamic titles.Results are combined via
combine_plots()(whencombine = TRUE) or returned as a named list.
Examples
# \donttest{
set.seed(8525)
# --- Radar chart with observation counts ---
data <- data.frame(
x = factor(
c(rep("A", 20), rep("B", 30), rep(NA, 30), rep("D", 40), rep("E", 50)),
levels = LETTERS[1:5]
),
group = factor(
sample(c("G1", NA, "G3", "G4"), 170, replace = TRUE),
levels = c("G1", "G2", "G3", "G4")
)
)
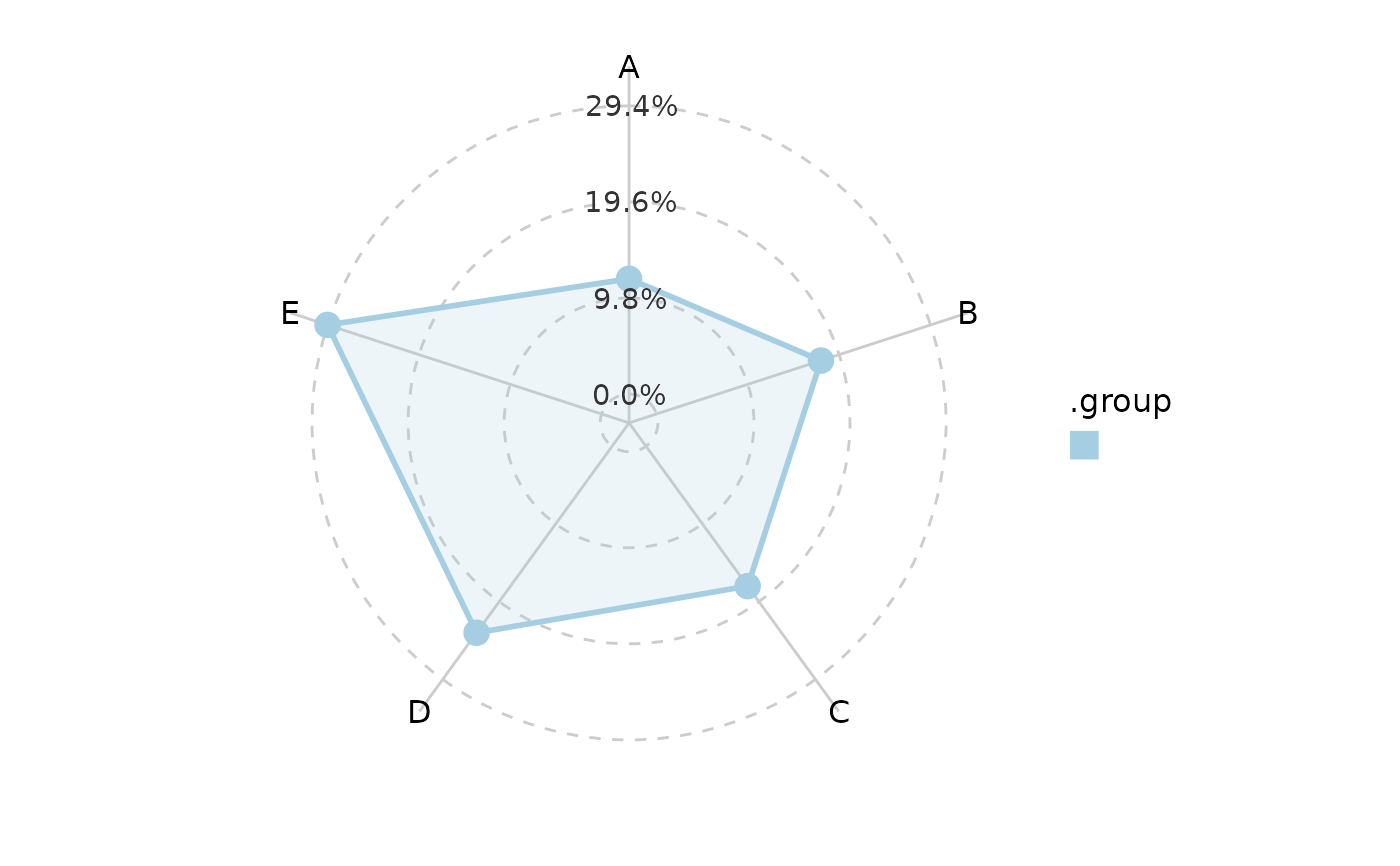
# Basic radar chart
RadarPlot(data, x = "x")
 # Keep NA and empty factor levels
RadarPlot(data, x = "x", keep_na = TRUE, keep_empty = TRUE)
# Keep NA and empty factor levels
RadarPlot(data, x = "x", keep_na = TRUE, keep_empty = TRUE)
 # Custom background colour
RadarPlot(data, x = "x", bg_color = "lightpink")
# Custom background colour
RadarPlot(data, x = "x", bg_color = "lightpink")
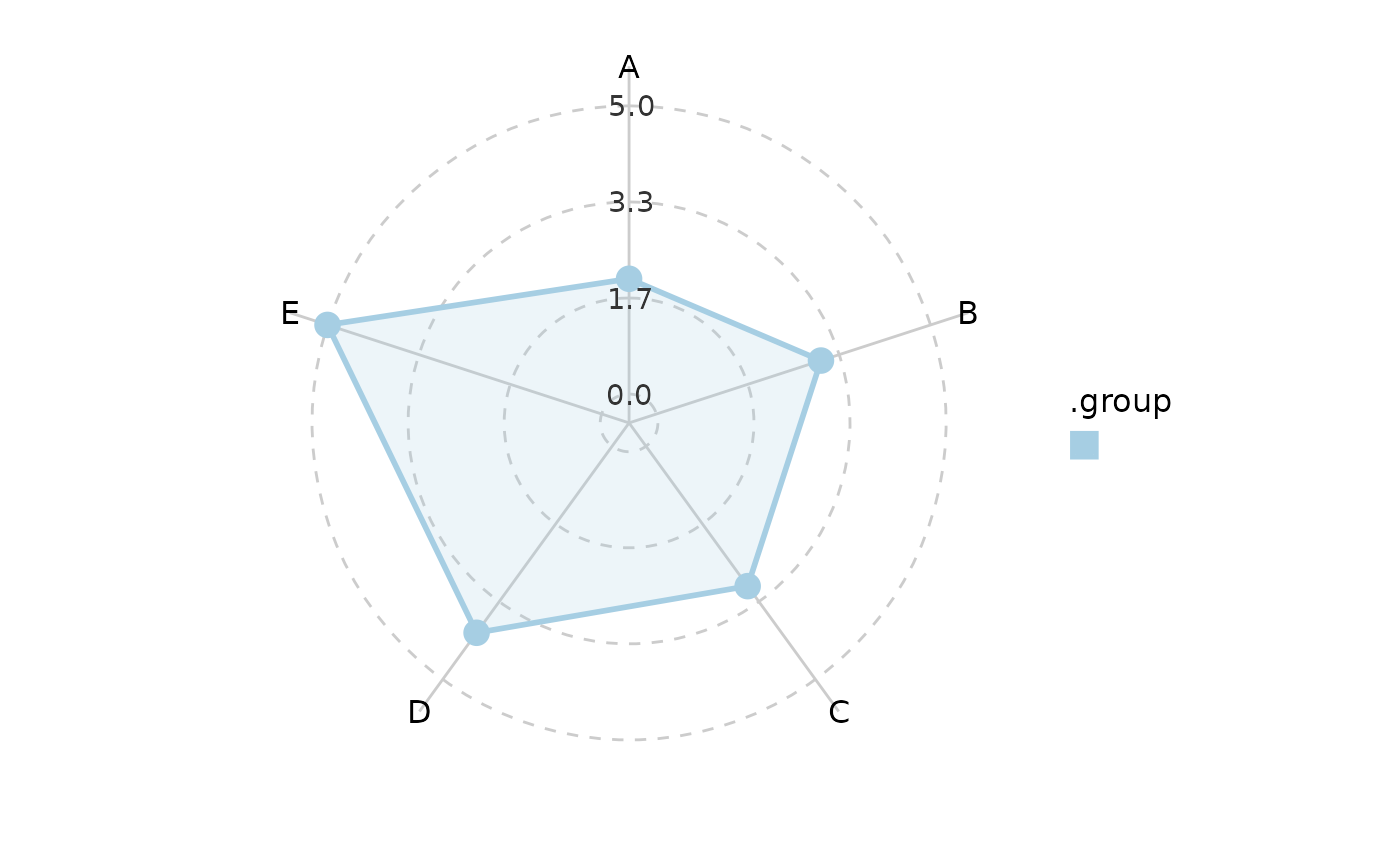
 # Raw counts (no proportion scaling)
RadarPlot(data, x = "x", scale_y = "none")
# Raw counts (no proportion scaling)
RadarPlot(data, x = "x", scale_y = "none")
 # Grouped by a variable
RadarPlot(data, x = "x", group_by = "group", keep_na = TRUE)
# Grouped by a variable
RadarPlot(data, x = "x", group_by = "group", keep_na = TRUE)
 # Faceted by a variable
RadarPlot(data, x = "x", facet_by = "group")
# Faceted by a variable
RadarPlot(data, x = "x", facet_by = "group")
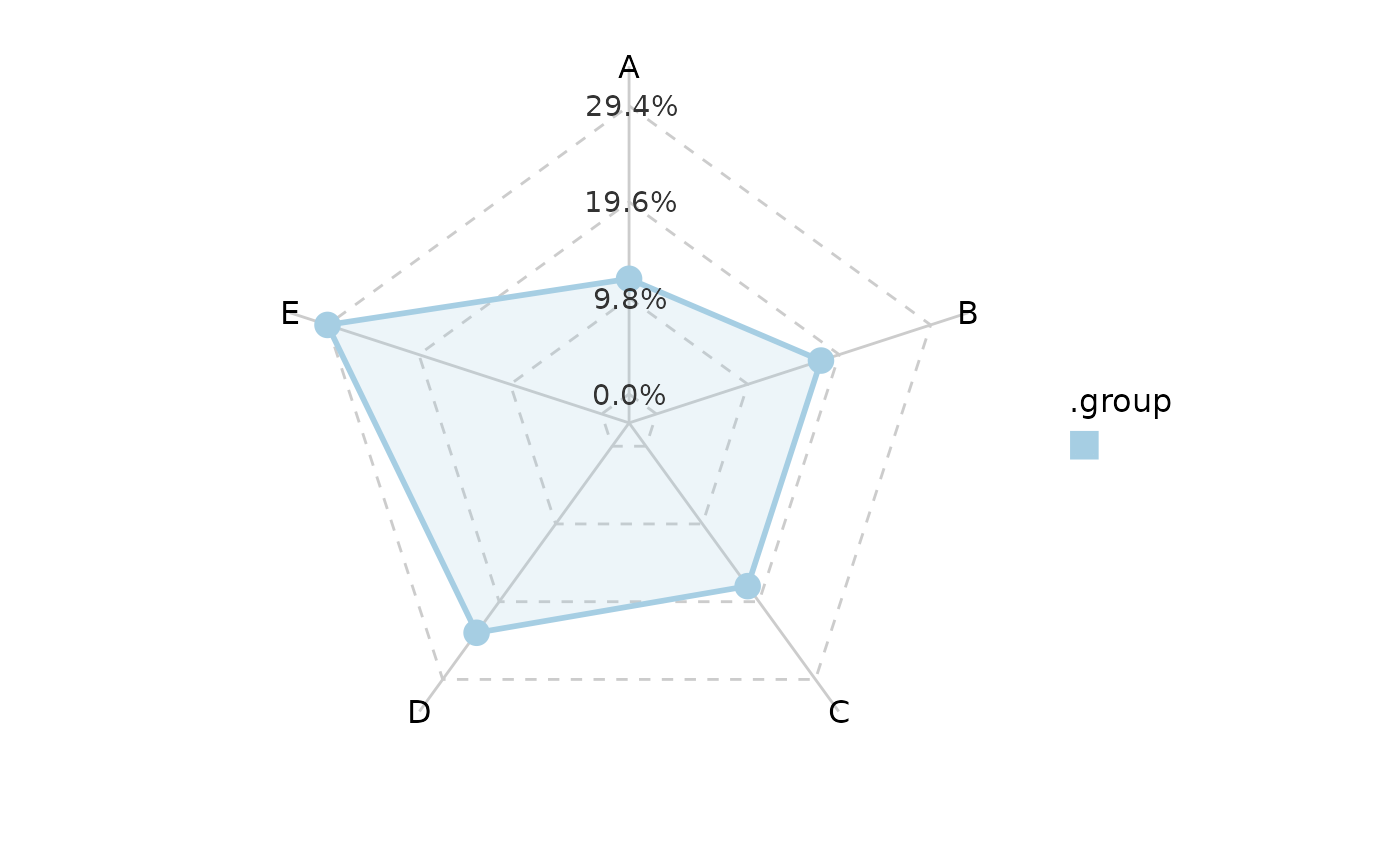
 # Spider chart variant (polygonal grid)
SpiderPlot(data, x = "x")
# Spider chart variant (polygonal grid)
SpiderPlot(data, x = "x")
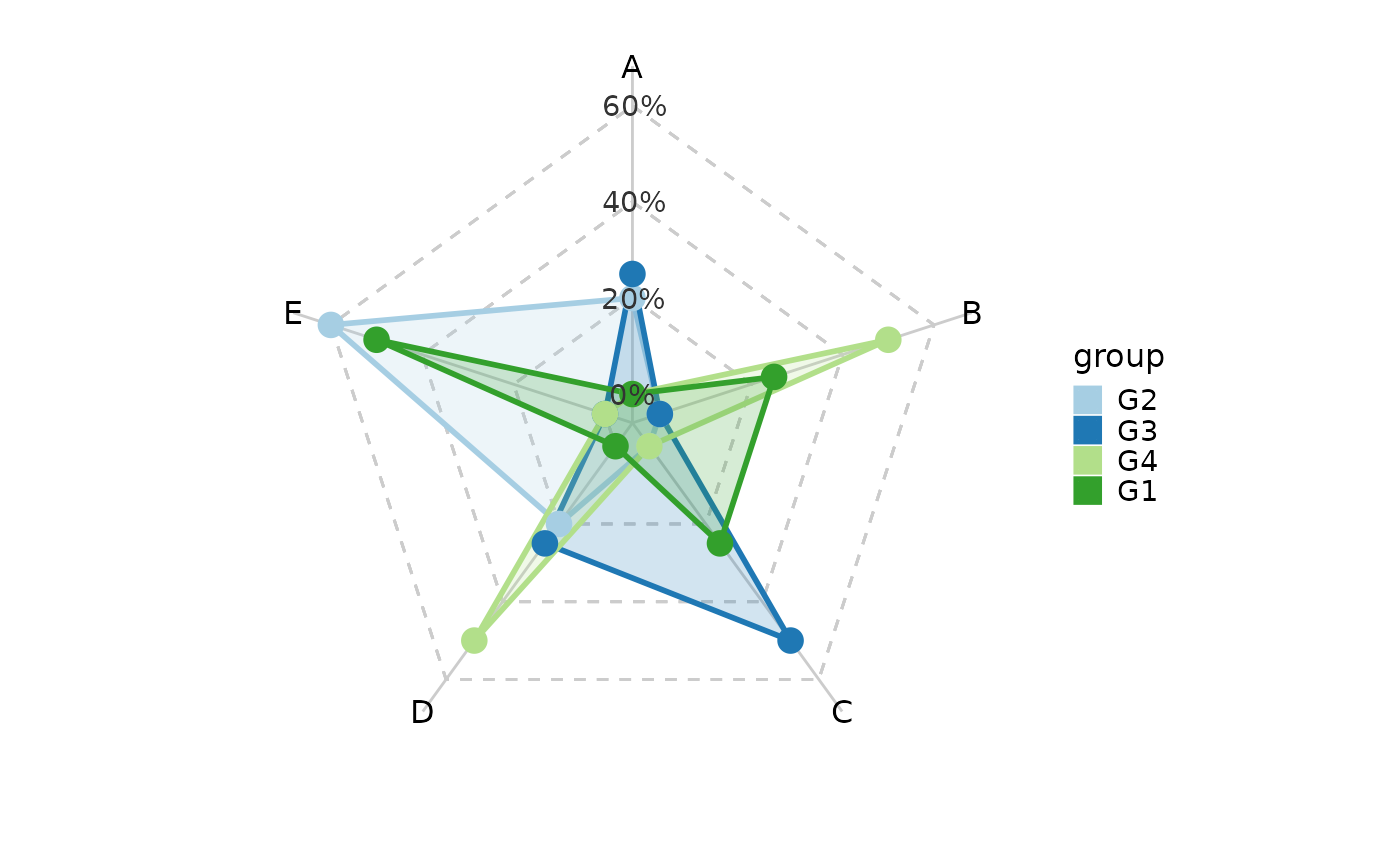
 SpiderPlot(data, x = "x", group_by = "group")
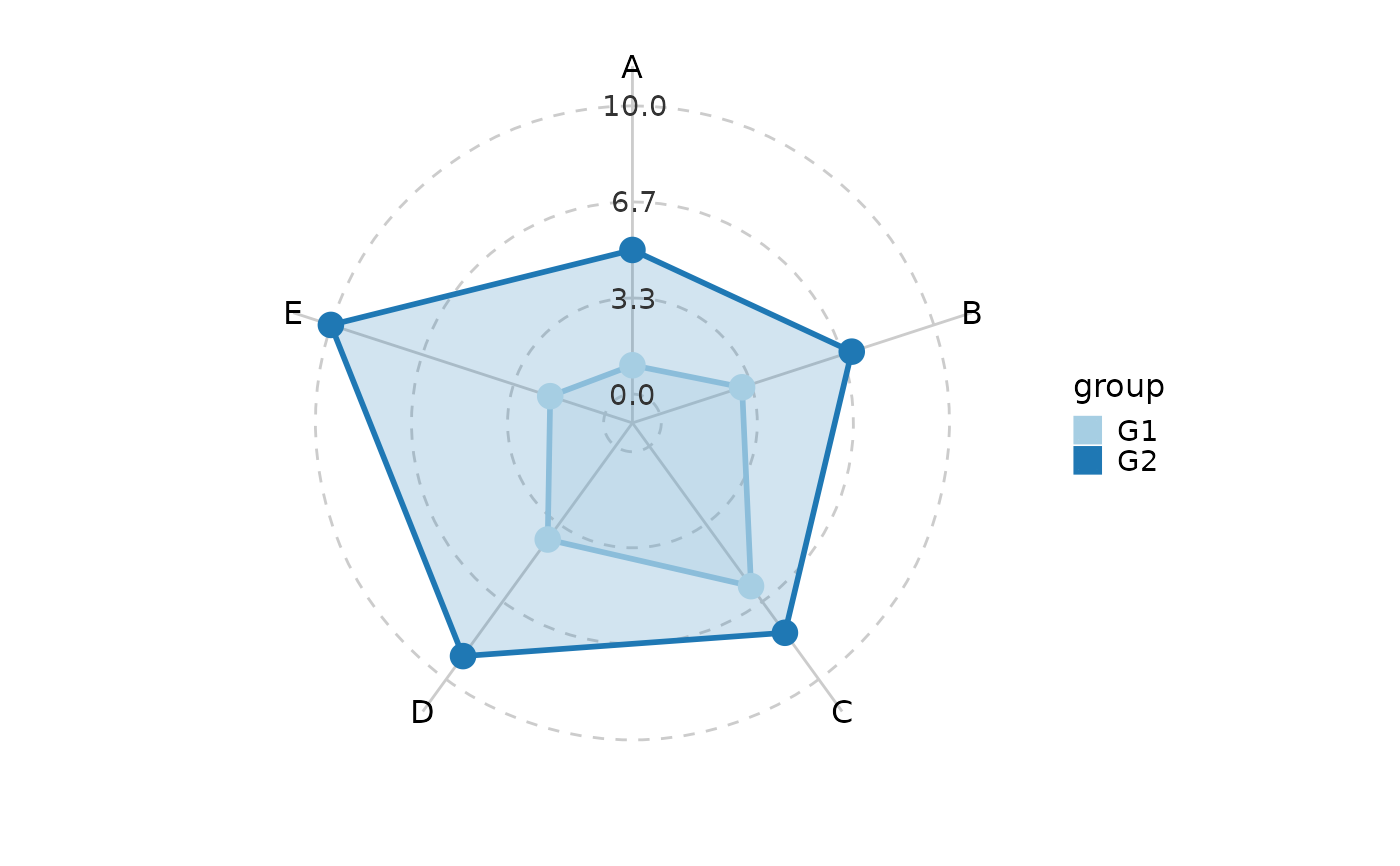
 # --- Radar chart with explicit y values ---
data <- data.frame(
x = rep(LETTERS[1:5], 2),
y = c(1, 3, 6, 4, 2, 5, 7, 8, 9, 10),
group = rep(c("G1", "G2"), each = 5)
)
# Grouped radar with raw values
RadarPlot(data, x = "x", y = "y", scale_y = "none", group_by = "group")
# --- Radar chart with explicit y values ---
data <- data.frame(
x = rep(LETTERS[1:5], 2),
y = c(1, 3, 6, 4, 2, 5, 7, 8, 9, 10),
group = rep(c("G1", "G2"), each = 5)
)
# Grouped radar with raw values
RadarPlot(data, x = "x", y = "y", scale_y = "none", group_by = "group")
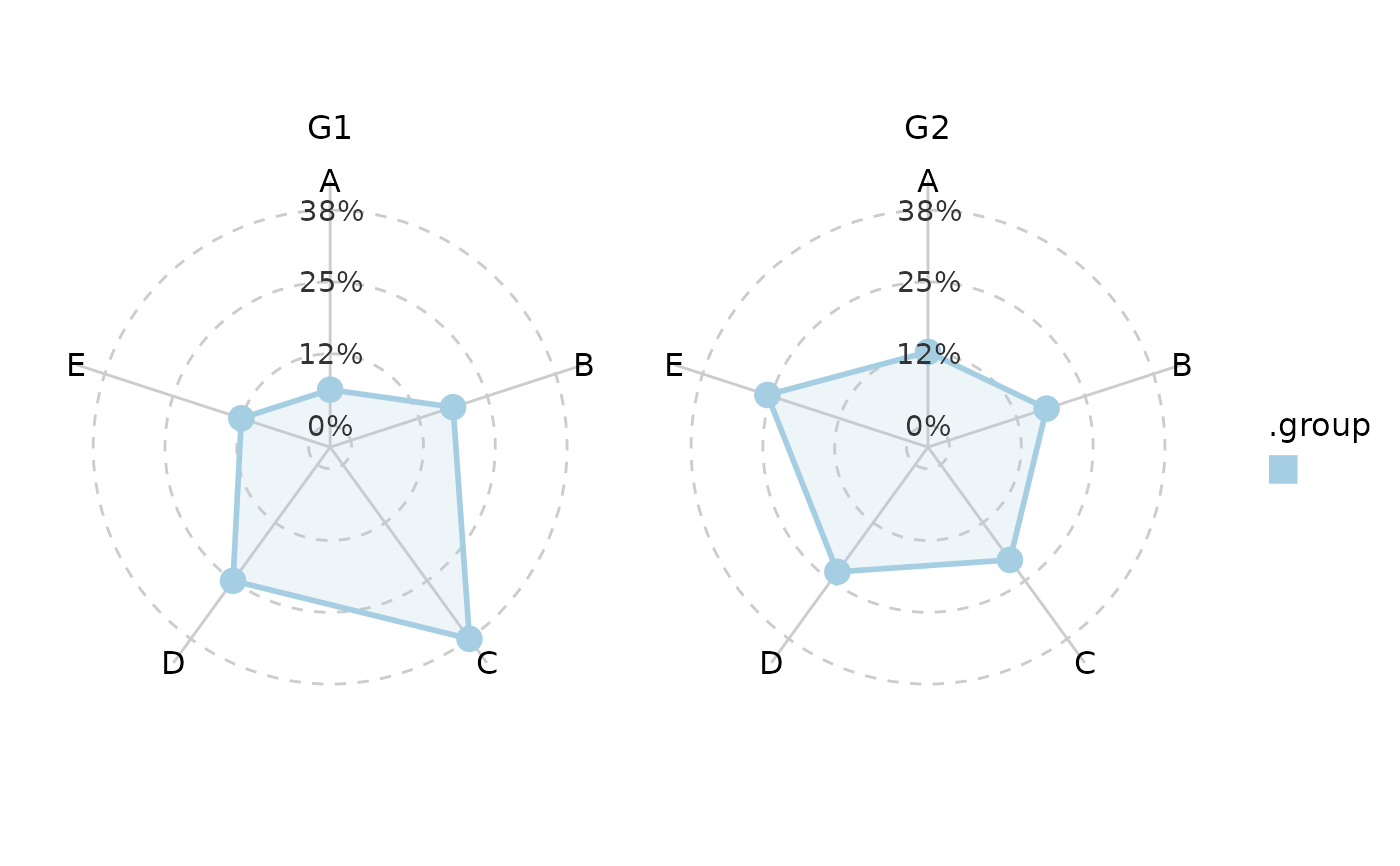
 # Faceted radar
RadarPlot(data, x = "x", y = "y", facet_by = "group")
# Faceted radar
RadarPlot(data, x = "x", y = "y", facet_by = "group")
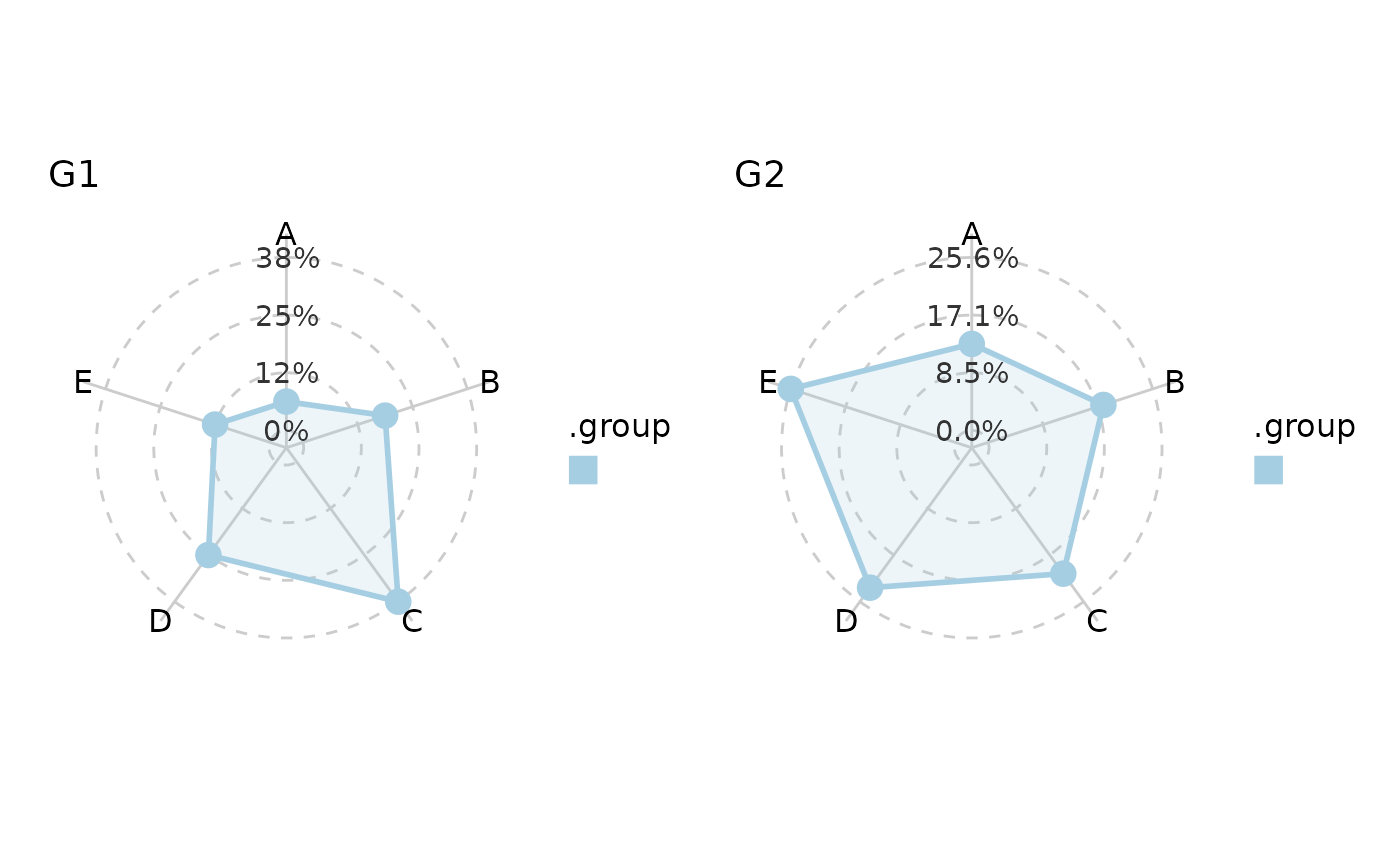
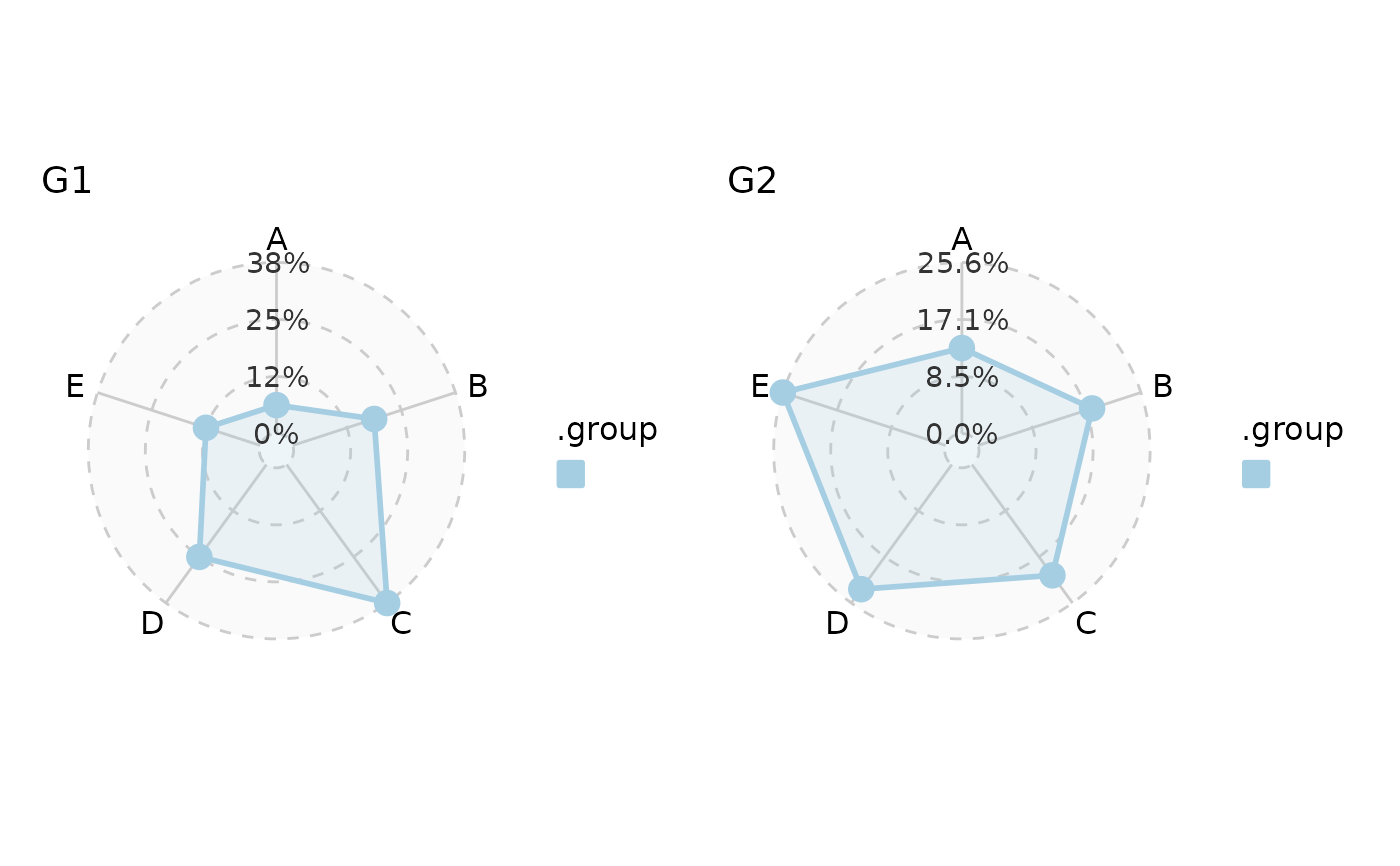
 # Split into separate sub-plots
RadarPlot(data, x = "x", y = "y", split_by = "group")
# Split into separate sub-plots
RadarPlot(data, x = "x", y = "y", split_by = "group")
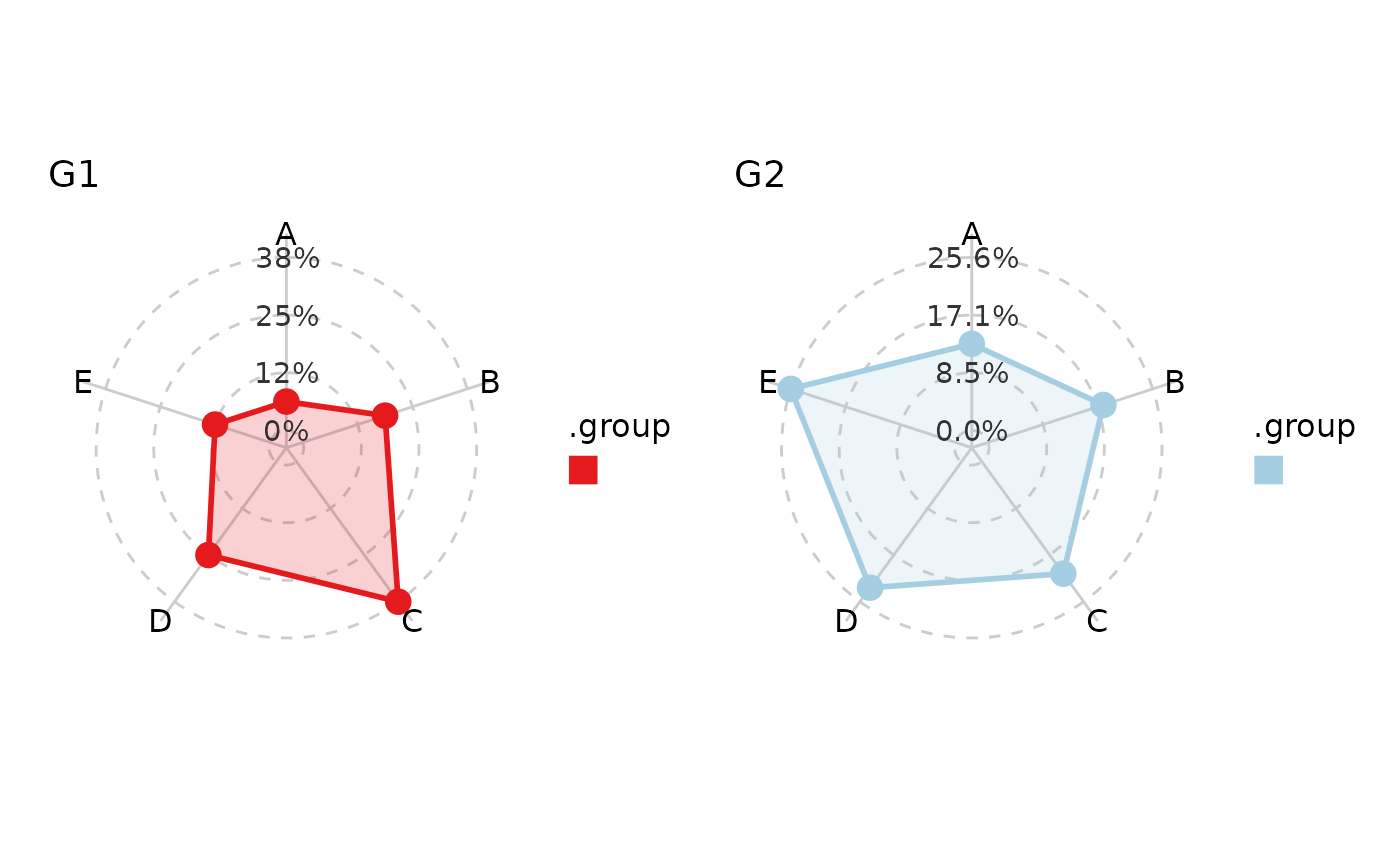
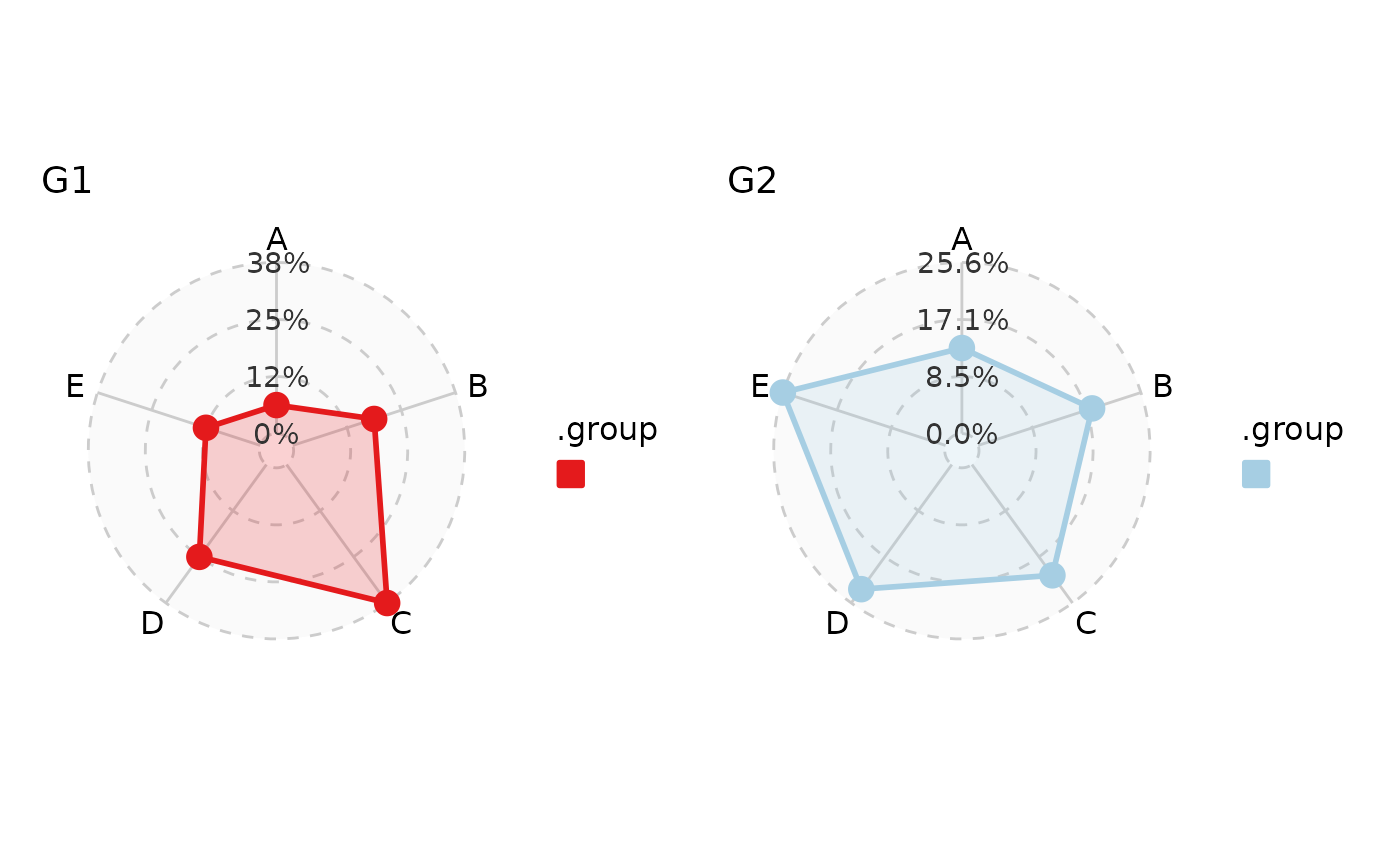
 # Per-split palettes
RadarPlot(data, x = "x", y = "y", split_by = "group",
palette = c(G1 = "Set1", G2 = "Paired"))
# Per-split palettes
RadarPlot(data, x = "x", y = "y", split_by = "group",
palette = c(G1 = "Set1", G2 = "Paired"))
 # }
# }