Ridge (joy) plot for visualising the distribution of a numeric variable across multiple groups. Each group is rendered as a partially overlapping density curve along the y-axis, making it easy to compare distribution shapes, central tendency, and spread across categories.
The function supports both long and wide data formats:
Long form (
in_form = "long", default) — a numeric column (x) plus a factor column (group_by) whose levels become the y-axis ridges.Wide form (
in_form = "wide") — multiple numeric columns listed ingroup_byare gathered internally into long form.
Optional vertical reference lines (add_vline) can mark group means,
specific values, or per-group thresholds. Supports faceting, split-by
splitting, and full palette customisation.
Usage
RidgePlot(
  data,
  x = NULL,
  in_form = c("long", "wide"),
  split_by = NULL,
  split_by_sep = "_",
  group_by = NULL,
  group_by_sep = "_",
  group_name = NULL,
  scale = NULL,
  keep_na = FALSE,
  keep_empty = FALSE,
  add_vline = NULL,
  vline_type = "solid",
  vline_color = TRUE,
  vline_width = 0.5,
  vline_alpha = 1,
  flip = FALSE,
  alpha = 0.8,
  theme = "theme_this",
  theme_args = list(),
  palette = "Paired",
  palcolor = NULL,
  palreverse = FALSE,
  title = NULL,
  subtitle = NULL,
  xlab = NULL,
  ylab = NULL,
  x_text_angle = 90,
  reverse = FALSE,
  facet_by = NULL,
  facet_scales = "fixed",
  facet_ncol = NULL,
  facet_nrow = NULL,
  facet_byrow = TRUE,
  aspect.ratio = 1,
  legend.position = "none",
  legend.direction = "vertical",
  combine = TRUE,
  nrow = NULL,
  ncol = NULL,
  byrow = TRUE,
  seed = 8525,
  axes = NULL,
  axis_titles = axes,
  guides = NULL,
  design = NULL,
  ...
)
Arguments
- data
A data frame.
- x
A character string specifying the column name of the data frame to plot for the x-axis.
- in_form
A character string specifying whether
datais in"long"(default) or"wide"format.- split_by
The column(s) to split data by and plot separately.
- split_by_sep
The separator for multiple split_by columns. See
split_by- group_by
Columns to group the data for plotting For those plotting functions that do not support multiple groups, They will be concatenated into one column, using
group_by_sepas the separator- group_by_sep
The separator for multiple group_by columns. See
group_by- group_name
A character string used as the legend title for the
group_byfill aesthetic. Defaults to the (concatenated)group_bycolumn name.- scale
A numeric value controlling the vertical overlap of ridges. Passed to
ggridges::geom_density_ridges(scale = ...). Smaller values increase overlap. WhenNULL, ggridges auto-computes the scale.- keep_na
A logical value or a character to replace the NA values in the data. It can also take a named list to specify different behavior for different columns. If TRUE or NA, NA values will be replaced with NA. If FALSE, NA values will be removed from the data before plotting. If a character string is provided, NA values will be replaced with the provided string. If a named vector/list is provided, the names should be the column names to apply the behavior to, and the values should be one of TRUE, FALSE, or a character string. Without a named vector/list, the behavior applies to categorical/character columns used on the plot, for example, the
x,group_by,fill_by, etc.- keep_empty
One of FALSE, TRUE and "level". It can also take a named list to specify different behavior for different columns. Without a named list, the behavior applies to the categorical/character columns used on the plot, for example, the
x,group_by,fill_by, etc.FALSE(default): Drop empty factor levels from the data before plotting.TRUE: Keep empty factor levels and show them as a separate category in the plot."level": Keep empty factor levels, but do not show them in the plot. But they will be assigned colors from the palette to maintain consistency across multiple plots. Alias:levels
- add_vline
A specification for vertical reference lines:
NULLorFALSE: no lines.TRUE: draw a line at the mean of each group.A numeric vector: draw the same lines for all groups.
A named list of numeric vectors: per-group lines, where names should match
group_bylevels.
- vline_type
A character string specifying the line type for the vertical reference lines. Passed as
linetypetogeom_vline(). Default:"solid".- vline_color
The colour of the vertical reference lines:
A literal colour value or vector (recycled): applied directly.
TRUE(default): each line is coloured with a darkened blend of the corresponding ridge fill colour, computed viablend_colors(mode = "multiply").
- vline_width
A numeric value for the thickness of the vertical reference lines. Passed as
linewidthtogeom_vline(). Default:0.5.- vline_alpha
A numeric value in
[0, 1]for the transparency of the vertical reference lines. Default:1.- flip
A logical value. If
TRUE, the axes are swapped viacoord_flip(). X-axis text angle and grid-line placement are adjusted accordingly.- alpha
A numeric value specifying the transparency of the plot.
- theme
A character string or a theme class (i.e. ggplot2::theme_classic) specifying the theme to use. Default is "theme_this".
- theme_args
A list of arguments to pass to the theme function.
- palette
A character string specifying the palette to use. A named list or vector can be used to specify the palettes for different
split_byvalues.- palcolor
A character string specifying the color to use in the palette. A named list can be used to specify the colors for different
split_byvalues. If some values are missing, the values from the palette will be used (palcolor will be NULL for those values).- palreverse
A logical value indicating whether to reverse the palette. Default is FALSE.
- title
A character string specifying the title of the plot. A function can be used to generate the title based on the default title. This is useful when split_by is used and the title needs to be dynamic.
- subtitle
A character string specifying the subtitle of the plot.
- xlab
A character string specifying the x-axis label.
- ylab
A character string specifying the y-axis label.
- x_text_angle
A numeric value specifying the angle of the x-axis text.
- reverse
A logical value. If
TRUE, the y-axis group order is reversed. NA groups are renamed to the literal string"NA"and placed at the end.- facet_by
A character string specifying the column name of the data frame to facet the plot. Otherwise, the data will be split by
split_byand generate multiple plots and combine them into one usingpatchwork::wrap_plots- facet_scales
Whether to scale the axes of facets. Default is "fixed" Other options are "free", "free_x", "free_y". See
ggplot2::facet_wrap- facet_ncol
A numeric value specifying the number of columns in the facet. When facet_by is a single column and facet_wrap is used.
- facet_nrow
A numeric value specifying the number of rows in the facet. When facet_by is a single column and facet_wrap is used.
- facet_byrow
A logical value indicating whether to fill the plots by row. Default is TRUE.
- aspect.ratio
A numeric value specifying the aspect ratio of the plot.
- legend.position
A character string specifying the position of the legend. if
waiver(), for single groups, the legend will be "none", otherwise "right".- legend.direction
A character string specifying the direction of the legend.
- combine
Whether to combine the plots into one when facet is FALSE. Default is TRUE.
- nrow
A numeric value specifying the number of rows in the facet.
- ncol
A numeric value specifying the number of columns in the facet.
- byrow
A logical value indicating whether to fill the plots by row.
- seed
The random seed to use. Default is 8525.
- axes
A string specifying how axes should be treated. Passed to
patchwork::wrap_plots(). Only relevant whensplit_byis used andcombineis TRUE. Options are:'keep' will retain all axes in individual plots.
'collect' will remove duplicated axes when placed in the same run of rows or columns of the layout.
'collect_x' and 'collect_y' will remove duplicated x-axes in the columns or duplicated y-axes in the rows respectively.
- axis_titles
A string specifying how axis titltes should be treated. Passed to
patchwork::wrap_plots(). Only relevant whensplit_byis used andcombineis TRUE. Options are:'keep' will retain all axis titles in individual plots.
'collect' will remove duplicated titles in one direction and merge titles in the opposite direction.
'collect_x' and 'collect_y' control this for x-axis titles and y-axis titles respectively.
- guides
A string specifying how guides should be treated in the layout. Passed to
patchwork::wrap_plots(). Only relevant whensplit_byis used andcombineis TRUE. Options are:'collect' will collect guides below to the given nesting level, removing duplicates.
'keep' will stop collection at this level and let guides be placed alongside their plot.
'auto' will allow guides to be collected if a upper level tries, but place them alongside the plot if not.
- design
Specification of the location of areas in the layout, passed to
patchwork::wrap_plots(). Only relevant whensplit_byis used andcombineis TRUE. When specified,nrow,ncol, andbyroware ignored. Seepatchwork::wrap_plots()for more details.- ...
Additional arguments.
Value
A ggplot object (single plot), a patchwork / wrap_plots object
(when split_by is provided and combine = TRUE), or a list of ggplot
objects (when split_by is provided and combine = FALSE).
split_by Workflow
When split_by is specified, RidgePlot() executes the following pipeline:
Argument validation —
validate_common_args()checks the seed and facet-by consistency.NA / empty normalisation —
check_keep_na()/check_keep_empty()convertkeep_na/keep_emptyto per-column lists.Theme resolution —
process_theme()resolves the theme string to a theme function.Split column resolution —
check_columns()validatessplit_by(force_factor, concat_multi).Pre-filtering —
process_keep_na_empty()removes NA / empty levels from the split column, thendatais split bysplit_bylevels (order preserved).Per-split parameter resolution —
check_palette(),check_palcolor(),check_legend()resolve palette, palcolor, legend.position, and legend.direction for each split.Per-split dispatch — each split is passed to
RidgePlotAtomic()with its resolved parameters. Title defaults to the split level name unlesstitleis a function (in which case it is called with the default).Combination —
combine_plots()assembles the list of plots viapatchwork::wrap_plots(), applyingnrow,ncol,byrow,axes,axis_titles,guides, anddesign.
Examples
# \donttest{
set.seed(8525)
data <- data.frame(
x = c(rnorm(250, -1), rnorm(250, 1)),
group = factor(rep(c("A", NA, LETTERS[3:5]), each = 100), levels = LETTERS[1:6])
)
# basic usage
RidgePlot(data, x = "x") # single ridge (no group_by)
#> Picking joint bandwidth of 0.371
 RidgePlot(data, x = "x", add_vline = 0, vline_color = "black")
#> Picking joint bandwidth of 0.371
RidgePlot(data, x = "x", add_vline = 0, vline_color = "black")
#> Picking joint bandwidth of 0.371
 # grouped ridges
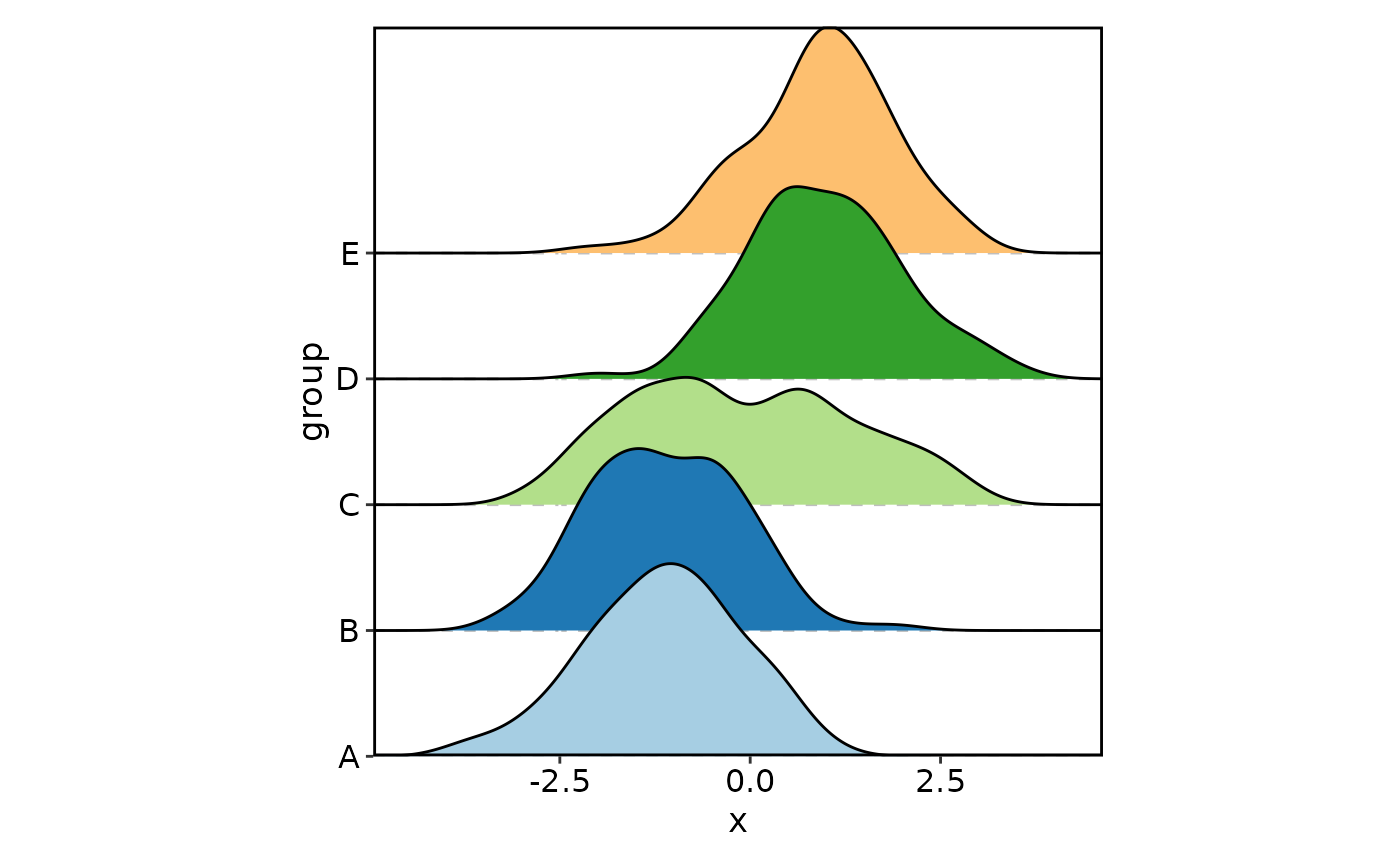
RidgePlot(data, x = "x", group_by = "group")
#> Picking joint bandwidth of 0.385
# grouped ridges
RidgePlot(data, x = "x", group_by = "group")
#> Picking joint bandwidth of 0.385
 RidgePlot(data, x = "x", group_by = "group",
keep_na = TRUE, keep_empty = TRUE)
#> Picking joint bandwidth of 0.378
RidgePlot(data, x = "x", group_by = "group",
keep_na = TRUE, keep_empty = TRUE)
#> Picking joint bandwidth of 0.378
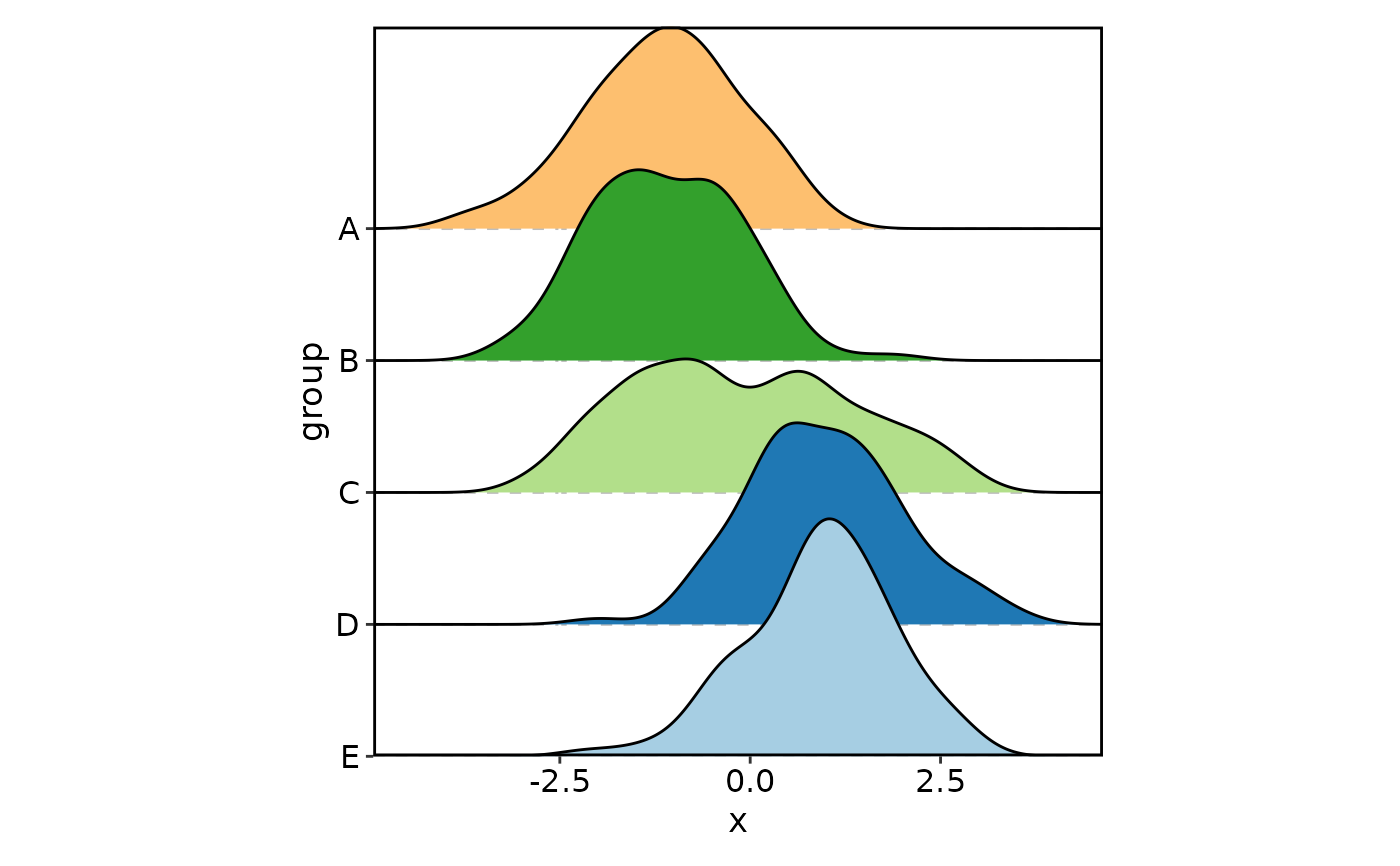
 RidgePlot(data, x = "x", group_by = "group", reverse = TRUE)
#> Picking joint bandwidth of 0.385
RidgePlot(data, x = "x", group_by = "group", reverse = TRUE)
#> Picking joint bandwidth of 0.385
 RidgePlot(data, x = "x", group_by = "group",
add_vline = TRUE, vline_color = TRUE, alpha = 0.7)
#> Picking joint bandwidth of 0.385
RidgePlot(data, x = "x", group_by = "group",
add_vline = TRUE, vline_color = TRUE, alpha = 0.7)
#> Picking joint bandwidth of 0.385
 # faceting
RidgePlot(data, x = "x", facet_by = "group",
keep_na = TRUE, keep_empty = TRUE)
#> Picking joint bandwidth of 0.356
#> Picking joint bandwidth of NaN
#> Warning: no non-missing arguments to min; returning Inf
#> Warning: no non-missing arguments to max; returning -Inf
#> Picking joint bandwidth of 0.518
#> Picking joint bandwidth of 0.361
#> Picking joint bandwidth of 0.307
#> Picking joint bandwidth of NaN
#> Warning: no non-missing arguments to min; returning Inf
#> Warning: no non-missing arguments to max; returning -Inf
#> Picking joint bandwidth of 0.347
# faceting
RidgePlot(data, x = "x", facet_by = "group",
keep_na = TRUE, keep_empty = TRUE)
#> Picking joint bandwidth of 0.356
#> Picking joint bandwidth of NaN
#> Warning: no non-missing arguments to min; returning Inf
#> Warning: no non-missing arguments to max; returning -Inf
#> Picking joint bandwidth of 0.518
#> Picking joint bandwidth of 0.361
#> Picking joint bandwidth of 0.307
#> Picking joint bandwidth of NaN
#> Warning: no non-missing arguments to min; returning Inf
#> Warning: no non-missing arguments to max; returning -Inf
#> Picking joint bandwidth of 0.347
#> Picking joint bandwidth of 0.356
#> Picking joint bandwidth of NaN
#> Warning: no non-missing arguments to min; returning Inf
#> Warning: no non-missing arguments to max; returning -Inf
#> Picking joint bandwidth of 0.518
#> Picking joint bandwidth of 0.361
#> Picking joint bandwidth of 0.307
#> Picking joint bandwidth of NaN
#> Warning: no non-missing arguments to min; returning Inf
#> Warning: no non-missing arguments to max; returning -Inf
#> Picking joint bandwidth of 0.347
 # wide form
data_wide <- data.frame(
A = rnorm(100),
B = rnorm(100),
C = rnorm(100),
D = rnorm(100),
E = rnorm(100),
group = sample(letters[1:4], 100, replace = TRUE)
)
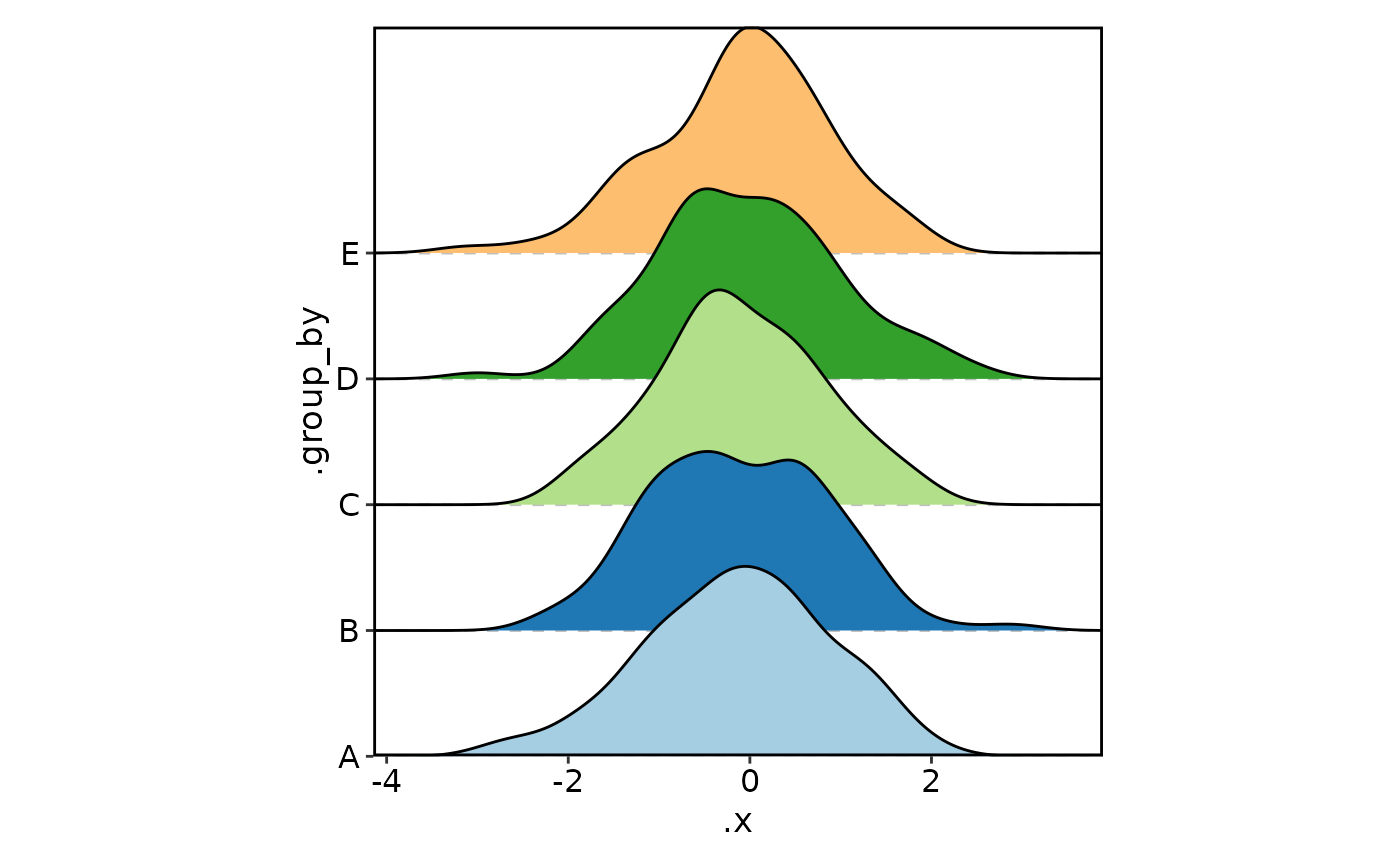
RidgePlot(data_wide, group_by = LETTERS[1:5], in_form = "wide")
#> Warning: Column 'A' not found in data. Skipping 'keep_na' processing for this column.
#> Warning: Column 'B' not found in data. Skipping 'keep_na' processing for this column.
#> Warning: Column 'C' not found in data. Skipping 'keep_na' processing for this column.
#> Warning: Column 'D' not found in data. Skipping 'keep_na' processing for this column.
#> Warning: Column 'E' not found in data. Skipping 'keep_na' processing for this column.
#> Warning: Column 'A' not found in data. Skipping 'keep_empty' processing for this column.
#> Warning: Column 'B' not found in data. Skipping 'keep_empty' processing for this column.
#> Warning: Column 'C' not found in data. Skipping 'keep_empty' processing for this column.
#> Warning: Column 'D' not found in data. Skipping 'keep_empty' processing for this column.
#> Warning: Column 'E' not found in data. Skipping 'keep_empty' processing for this column.
#> Picking joint bandwidth of 0.337
# wide form
data_wide <- data.frame(
A = rnorm(100),
B = rnorm(100),
C = rnorm(100),
D = rnorm(100),
E = rnorm(100),
group = sample(letters[1:4], 100, replace = TRUE)
)
RidgePlot(data_wide, group_by = LETTERS[1:5], in_form = "wide")
#> Warning: Column 'A' not found in data. Skipping 'keep_na' processing for this column.
#> Warning: Column 'B' not found in data. Skipping 'keep_na' processing for this column.
#> Warning: Column 'C' not found in data. Skipping 'keep_na' processing for this column.
#> Warning: Column 'D' not found in data. Skipping 'keep_na' processing for this column.
#> Warning: Column 'E' not found in data. Skipping 'keep_na' processing for this column.
#> Warning: Column 'A' not found in data. Skipping 'keep_empty' processing for this column.
#> Warning: Column 'B' not found in data. Skipping 'keep_empty' processing for this column.
#> Warning: Column 'C' not found in data. Skipping 'keep_empty' processing for this column.
#> Warning: Column 'D' not found in data. Skipping 'keep_empty' processing for this column.
#> Warning: Column 'E' not found in data. Skipping 'keep_empty' processing for this column.
#> Picking joint bandwidth of 0.337
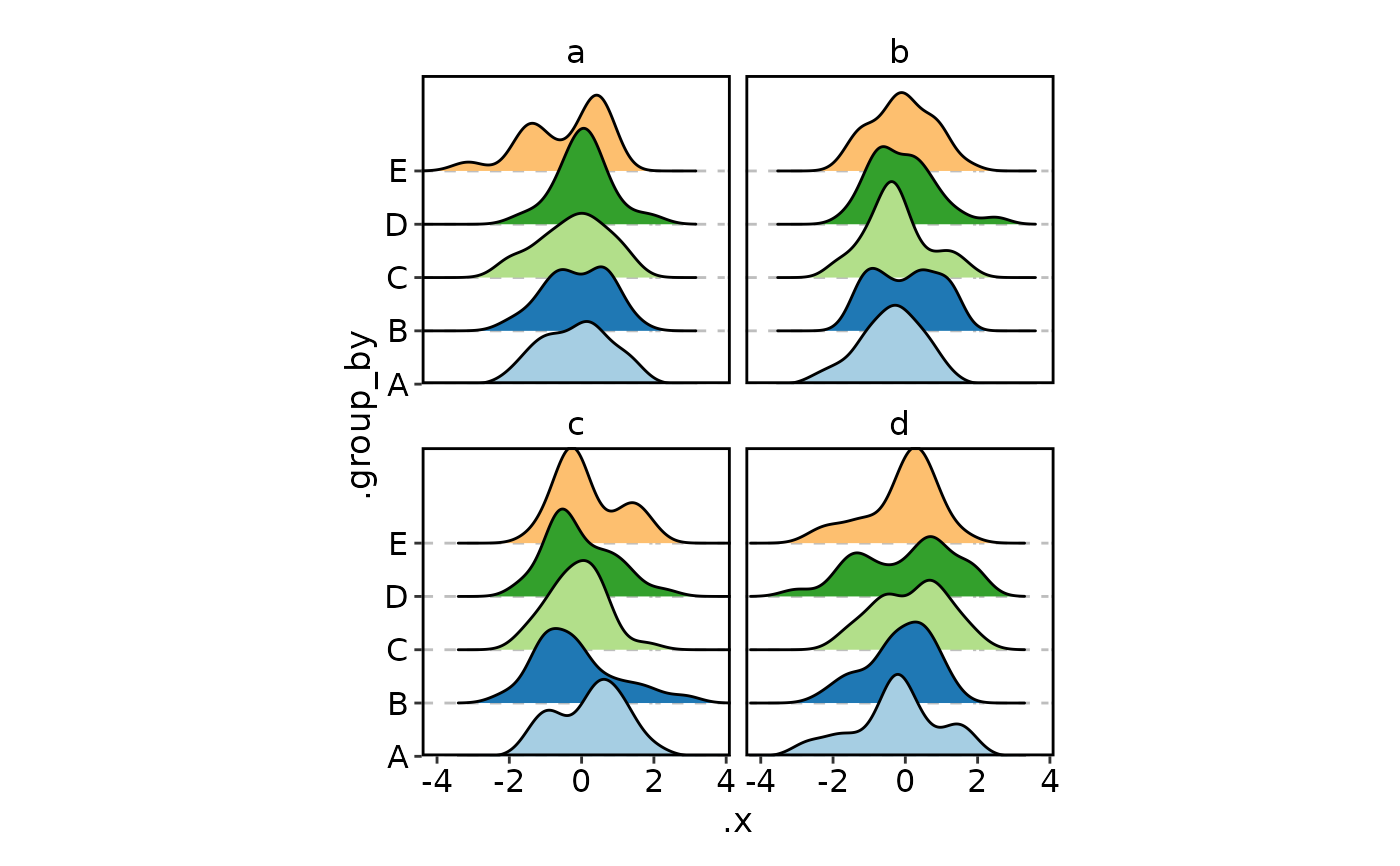
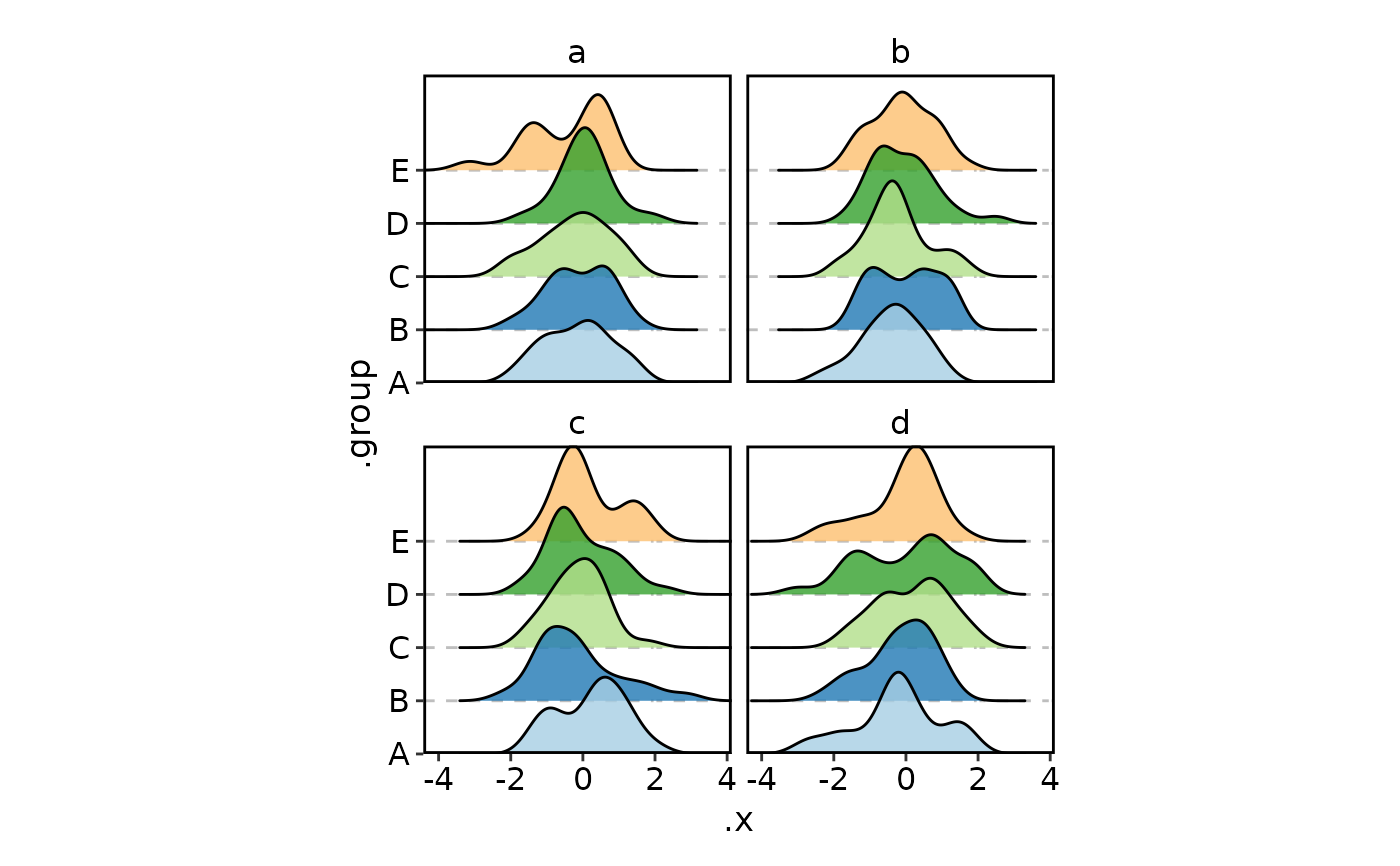
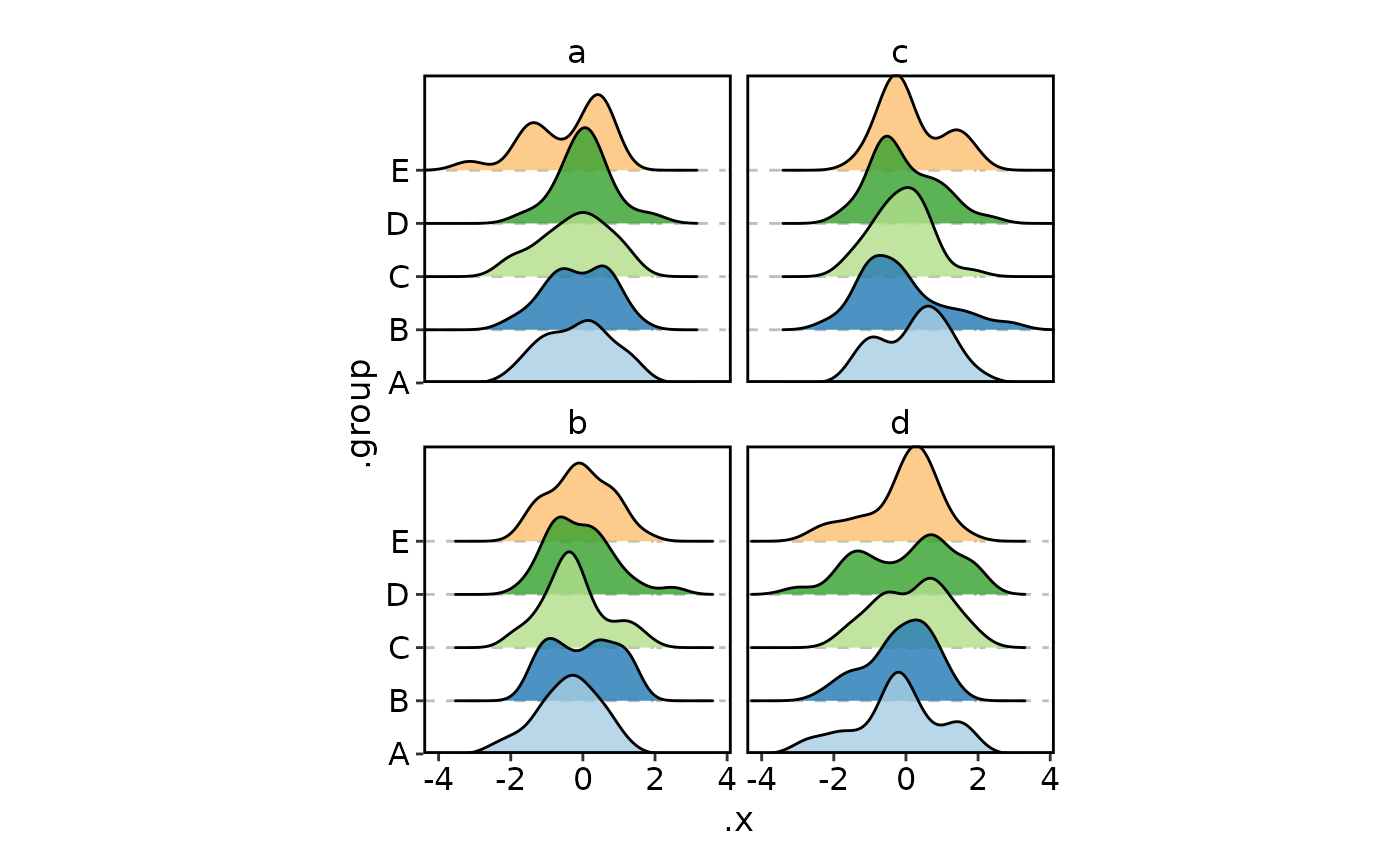
 RidgePlot(data_wide, group_by = LETTERS[1:5], in_form = "wide", facet_by = "group")
#> Warning: Column 'A' not found in data. Skipping 'keep_na' processing for this column.
#> Warning: Column 'B' not found in data. Skipping 'keep_na' processing for this column.
#> Warning: Column 'C' not found in data. Skipping 'keep_na' processing for this column.
#> Warning: Column 'D' not found in data. Skipping 'keep_na' processing for this column.
#> Warning: Column 'E' not found in data. Skipping 'keep_na' processing for this column.
#> Warning: Column 'A' not found in data. Skipping 'keep_empty' processing for this column.
#> Warning: Column 'B' not found in data. Skipping 'keep_empty' processing for this column.
#> Warning: Column 'C' not found in data. Skipping 'keep_empty' processing for this column.
#> Warning: Column 'D' not found in data. Skipping 'keep_empty' processing for this column.
#> Warning: Column 'E' not found in data. Skipping 'keep_empty' processing for this column.
#> Picking joint bandwidth of 0.429
#> Picking joint bandwidth of 0.416
#> Picking joint bandwidth of 0.367
#> Picking joint bandwidth of 0.428
#> Picking joint bandwidth of 0.429
#> Picking joint bandwidth of 0.416
#> Picking joint bandwidth of 0.367
#> Picking joint bandwidth of 0.428
RidgePlot(data_wide, group_by = LETTERS[1:5], in_form = "wide", facet_by = "group")
#> Warning: Column 'A' not found in data. Skipping 'keep_na' processing for this column.
#> Warning: Column 'B' not found in data. Skipping 'keep_na' processing for this column.
#> Warning: Column 'C' not found in data. Skipping 'keep_na' processing for this column.
#> Warning: Column 'D' not found in data. Skipping 'keep_na' processing for this column.
#> Warning: Column 'E' not found in data. Skipping 'keep_na' processing for this column.
#> Warning: Column 'A' not found in data. Skipping 'keep_empty' processing for this column.
#> Warning: Column 'B' not found in data. Skipping 'keep_empty' processing for this column.
#> Warning: Column 'C' not found in data. Skipping 'keep_empty' processing for this column.
#> Warning: Column 'D' not found in data. Skipping 'keep_empty' processing for this column.
#> Warning: Column 'E' not found in data. Skipping 'keep_empty' processing for this column.
#> Picking joint bandwidth of 0.429
#> Picking joint bandwidth of 0.416
#> Picking joint bandwidth of 0.367
#> Picking joint bandwidth of 0.428
#> Picking joint bandwidth of 0.429
#> Picking joint bandwidth of 0.416
#> Picking joint bandwidth of 0.367
#> Picking joint bandwidth of 0.428
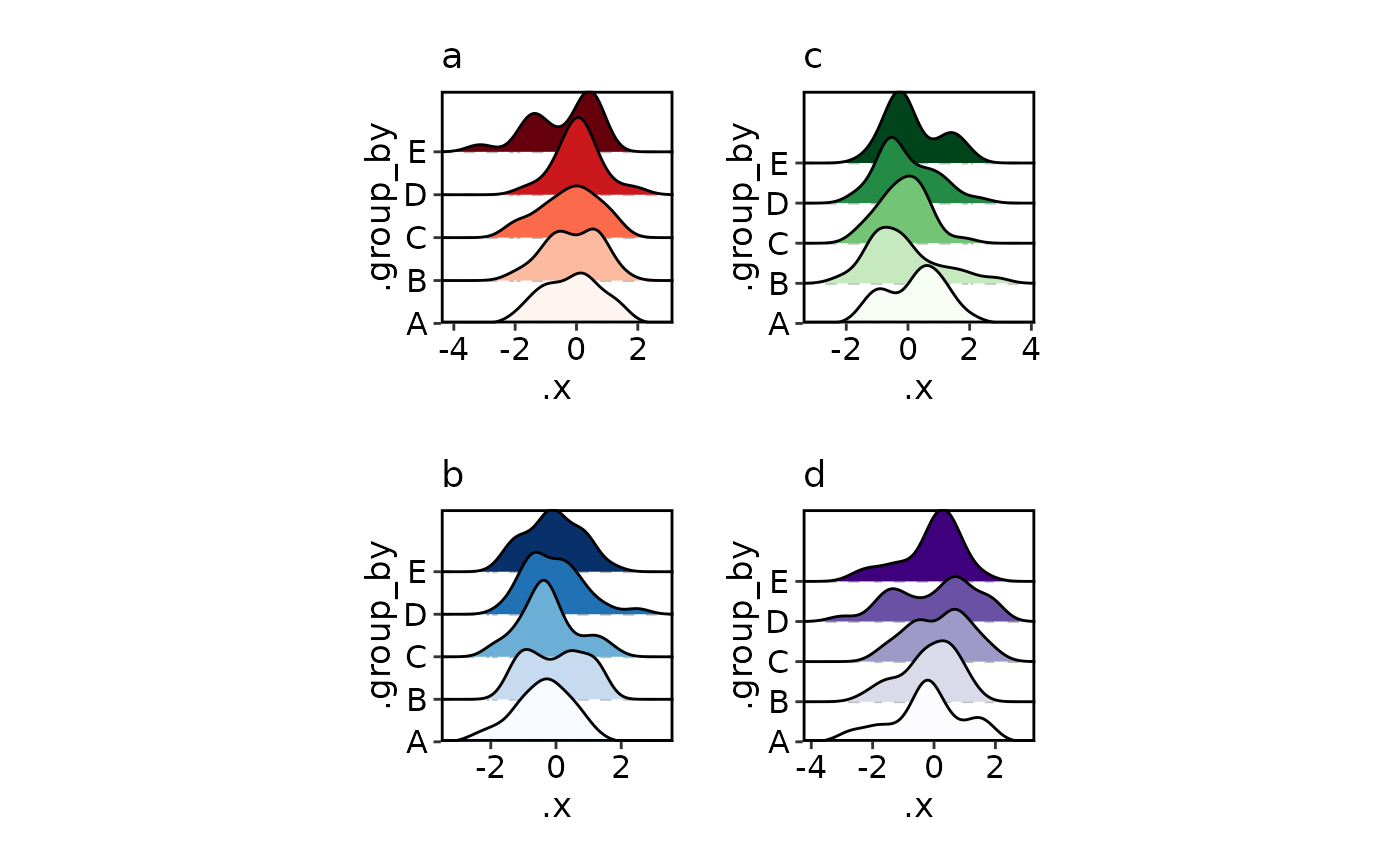
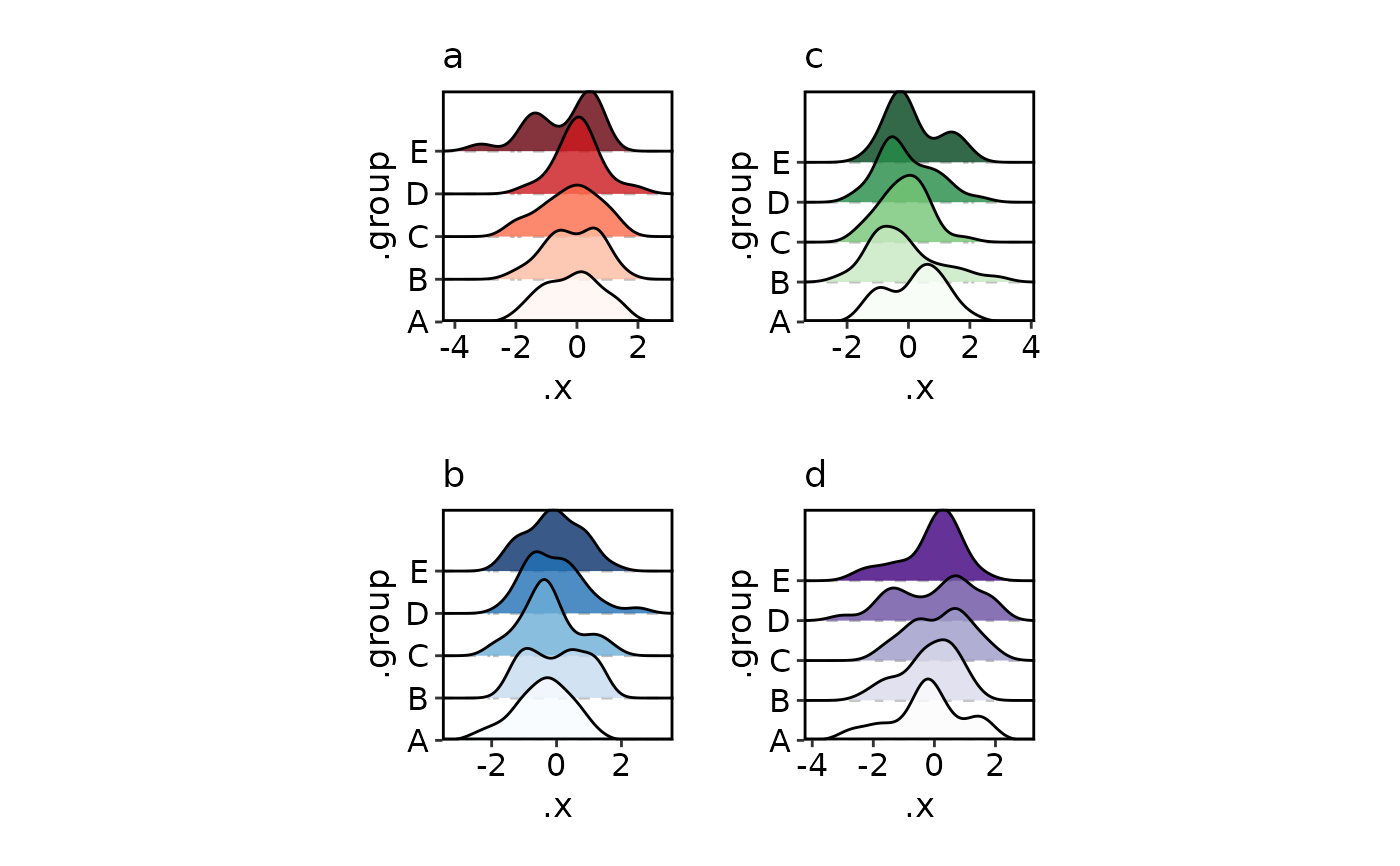
 # split_by with per-split palettes
RidgePlot(data_wide, group_by = LETTERS[1:5], in_form = "wide", split_by = "group",
palette = list(a = "Reds", b = "Blues", c = "Greens", d = "Purples"))
#> Warning: Column 'A' not found in data. Skipping 'keep_na' processing for this column.
#> Warning: Column 'B' not found in data. Skipping 'keep_na' processing for this column.
#> Warning: Column 'C' not found in data. Skipping 'keep_na' processing for this column.
#> Warning: Column 'D' not found in data. Skipping 'keep_na' processing for this column.
#> Warning: Column 'E' not found in data. Skipping 'keep_na' processing for this column.
#> Warning: Column 'A' not found in data. Skipping 'keep_empty' processing for this column.
#> Warning: Column 'B' not found in data. Skipping 'keep_empty' processing for this column.
#> Warning: Column 'C' not found in data. Skipping 'keep_empty' processing for this column.
#> Warning: Column 'D' not found in data. Skipping 'keep_empty' processing for this column.
#> Warning: Column 'E' not found in data. Skipping 'keep_empty' processing for this column.
#> Picking joint bandwidth of 0.429
#> Picking joint bandwidth of 0.416
#> Picking joint bandwidth of 0.367
#> Picking joint bandwidth of 0.428
# split_by with per-split palettes
RidgePlot(data_wide, group_by = LETTERS[1:5], in_form = "wide", split_by = "group",
palette = list(a = "Reds", b = "Blues", c = "Greens", d = "Purples"))
#> Warning: Column 'A' not found in data. Skipping 'keep_na' processing for this column.
#> Warning: Column 'B' not found in data. Skipping 'keep_na' processing for this column.
#> Warning: Column 'C' not found in data. Skipping 'keep_na' processing for this column.
#> Warning: Column 'D' not found in data. Skipping 'keep_na' processing for this column.
#> Warning: Column 'E' not found in data. Skipping 'keep_na' processing for this column.
#> Warning: Column 'A' not found in data. Skipping 'keep_empty' processing for this column.
#> Warning: Column 'B' not found in data. Skipping 'keep_empty' processing for this column.
#> Warning: Column 'C' not found in data. Skipping 'keep_empty' processing for this column.
#> Warning: Column 'D' not found in data. Skipping 'keep_empty' processing for this column.
#> Warning: Column 'E' not found in data. Skipping 'keep_empty' processing for this column.
#> Warning: Column 'A' not found in data. Skipping 'keep_na' processing for this column.
#> Warning: Column 'B' not found in data. Skipping 'keep_na' processing for this column.
#> Warning: Column 'C' not found in data. Skipping 'keep_na' processing for this column.
#> Warning: Column 'D' not found in data. Skipping 'keep_na' processing for this column.
#> Warning: Column 'E' not found in data. Skipping 'keep_na' processing for this column.
#> Warning: Column 'A' not found in data. Skipping 'keep_empty' processing for this column.
#> Warning: Column 'B' not found in data. Skipping 'keep_empty' processing for this column.
#> Warning: Column 'C' not found in data. Skipping 'keep_empty' processing for this column.
#> Warning: Column 'D' not found in data. Skipping 'keep_empty' processing for this column.
#> Warning: Column 'E' not found in data. Skipping 'keep_empty' processing for this column.
#> Warning: Column 'A' not found in data. Skipping 'keep_na' processing for this column.
#> Warning: Column 'B' not found in data. Skipping 'keep_na' processing for this column.
#> Warning: Column 'C' not found in data. Skipping 'keep_na' processing for this column.
#> Warning: Column 'D' not found in data. Skipping 'keep_na' processing for this column.
#> Warning: Column 'E' not found in data. Skipping 'keep_na' processing for this column.
#> Warning: Column 'A' not found in data. Skipping 'keep_empty' processing for this column.
#> Warning: Column 'B' not found in data. Skipping 'keep_empty' processing for this column.
#> Warning: Column 'C' not found in data. Skipping 'keep_empty' processing for this column.
#> Warning: Column 'D' not found in data. Skipping 'keep_empty' processing for this column.
#> Warning: Column 'E' not found in data. Skipping 'keep_empty' processing for this column.
#> Warning: Column 'A' not found in data. Skipping 'keep_na' processing for this column.
#> Warning: Column 'B' not found in data. Skipping 'keep_na' processing for this column.
#> Warning: Column 'C' not found in data. Skipping 'keep_na' processing for this column.
#> Warning: Column 'D' not found in data. Skipping 'keep_na' processing for this column.
#> Warning: Column 'E' not found in data. Skipping 'keep_na' processing for this column.
#> Warning: Column 'A' not found in data. Skipping 'keep_empty' processing for this column.
#> Warning: Column 'B' not found in data. Skipping 'keep_empty' processing for this column.
#> Warning: Column 'C' not found in data. Skipping 'keep_empty' processing for this column.
#> Warning: Column 'D' not found in data. Skipping 'keep_empty' processing for this column.
#> Warning: Column 'E' not found in data. Skipping 'keep_empty' processing for this column.
#> Picking joint bandwidth of 0.429
#> Picking joint bandwidth of 0.416
#> Picking joint bandwidth of 0.367
#> Picking joint bandwidth of 0.428
 # }
# }