A wrapped function around plotROC package to create ROC curves.
Usage
ROCCurve(
  data,
  truth_by,
  score_by,
  pos_label = NULL,
  split_by = NULL,
  split_by_sep = "_",
  group_by = NULL,
  group_by_sep = "_",
  group_name = NULL,
  x_axis_reverse = FALSE,
  percent = FALSE,
  ci = NULL,
  n_cuts = 0,
  cutoffs_at = NULL,
  cutoffs_labels = NULL,
  cutoffs_accuracy = 0.001,
  cutoffs_pt_size = 5,
  cutoffs_pt_shape = 4,
  cutoffs_pt_stroke = 1,
  cutoffs_labal_fg = "black",
  cutoffs_label_size = 4,
  cutoffs_label_bg = "white",
  cutoffs_label_bg_r = 0.1,
  show_auc = c("auto", "none", "legend", "plot"),
  auc_accuracy = 0.01,
  auc_size = 4,
  theme = "theme_this",
  theme_args = list(),
  palette = "Spectral",
  palcolor = NULL,
  palreverse = FALSE,
  alpha = 1,
  facet_by = NULL,
  facet_scales = "fixed",
  facet_ncol = NULL,
  facet_nrow = NULL,
  facet_byrow = TRUE,
  aspect.ratio = 1,
  legend.position = waiver(),
  legend.direction = "vertical",
  title = NULL,
  subtitle = NULL,
  xlab = ifelse(x_axis_reverse, "Specificity", "1 - Specificity"),
  ylab = "Sensitivity",
  combine = TRUE,
  nrow = NULL,
  ncol = NULL,
  byrow = TRUE,
  seed = 8525,
  axes = NULL,
  axis_titles = axes,
  guides = NULL,
  design = NULL,
  ...
)
Arguments
- data
A data frame.
- truth_by
A character string of the column name that contains the true class labels. (a.k.a. the binary outcome, 1/0 or TRUE/FALSE.)
- score_by
character strings of the column names that contains the predicted scores. When multiple columns are provided, the ROC curve is plotted for each column.
- pos_label
A character string of the positive class label. When NULL, the labels will be handled by the
plotROCpackage.- split_by
The column(s) to split data by and plot separately.
- split_by_sep
The separator for multiple split_by columns. See
split_by- group_by
Columns to group the data for plotting For those plotting functions that do not support multiple groups, They will be concatenated into one column, using
group_by_sepas the separator- group_by_sep
The separator for multiple group_by columns. See
group_by- group_name
A character string to name the legend of the ROC curve groups.
- x_axis_reverse
A logical to reverse the x-axis, that is from 1 to 0.
- percent
A logical to display the x and y axis as percentages.
- ci
A list of arguments to pass to
plotROC::geom_rocci()to add confidence intervals. When NULL, no confidence intervals are added.- n_cuts
An integer to specify the number of cutpoints on the ROC curve. It will be the quantiles of the predicted scores.
- cutoffs_at
Vector of user supplied cutoffs to plot as points. If non-NULL, it will override the values of n_cuts and plot the observed cutoffs closest to the user-supplied ones. Both
cutoffs_atandcutoffs.labelswill be passed toplotROC::geom_roc(). Other than numeric values, the following special values are allowed. These values are the methods ofOptimalCutpoints::optimal.cutpoints(), they are literally:"CB" (cost-benefit method);
"MCT" (minimizes Misclassification Cost Term);
"MinValueSp" (a minimum value set for Specificity);
"MinValueSe" (a minimum value set for Sensitivity);
"ValueSe" (a value set for Sensitivity);
"MinValueSpSe" (a minimum value set for Specificity and Sensitivity);
"MaxSp" (maximizes Specificity);
"MaxSe" (maximizes Sensitivity);
"MaxSpSe" (maximizes Sensitivity and Specificity simultaneously);
"MaxProdSpSe" (maximizes the product of Sensitivity and Specificity or Accuracy Area);
"ROC01" (minimizes distance between ROC plot and point (0,1));
"SpEqualSe" (Sensitivity = Specificity);
"Youden" (Youden Index);
"MaxEfficiency" (maximizes Efficiency or Accuracy, similar to minimize Error Rate);
"Minimax" (minimizes the most frequent error);
"MaxDOR" (maximizes Diagnostic Odds Ratio);
"MaxKappa" (maximizes Kappa Index);
"MinValueNPV" (a minimum value set for Negative Predictive Value);
"MinValuePPV" (a minimum value set for Positive Predictive Value);
"ValueNPV" (a value set for Negative Predictive Value);
"ValuePPV" (a value set for Positive Predictive Value);
"MinValueNPVPPV" (a minimum value set for Predictive Values);
"PROC01" (minimizes distance between PROC plot and point (0,1));
"NPVEqualPPV" (Negative Predictive Value = Positive Predictive Value);
"MaxNPVPPV" (maximizes Positive Predictive Value and Negative Predictive Value simultaneously);
"MaxSumNPVPPV" (maximizes the sum of the Predictive Values);
"MaxProdNPVPPV" (maximizes the product of Predictive Values);
"ValueDLR.Negative" (a value set for Negative Diagnostic Likelihood Ratio);
"ValueDLR.Positive" (a value set for Positive Diagnostic Likelihood Ratio);
"MinPvalue" (minimizes p-value associated with the statistical Chi-squared test which measures the association between the marker and the binary result obtained on using the cutpoint);
"ObservedPrev" (The closest value to observed prevalence);
"MeanPrev" (The closest value to the mean of the diagnostic test values);
"PrevalenceMatching" (The value for which predicted prevalence is practically equal to observed prevalence).
- cutoffs_labels
vector of user-supplied labels for the cutoffs. Must be a character vector of the same length as cutoffs_at.
- cutoffs_accuracy
A numeric to specify the accuracy of the cutoff values to show.
- cutoffs_pt_size
A numeric to specify the size of the cutoff points.
- cutoffs_pt_shape
A numeric to specify the shape of the cutoff points.
- cutoffs_pt_stroke
A numeric to specify the stroke of the cutoff points.
- cutoffs_labal_fg
A character string to specify the color of the cutoff labels.
- cutoffs_label_size
A numeric to specify the size of the cutoff labels.
- cutoffs_label_bg
A character string to specify the background color of the cutoff labels.
- cutoffs_label_bg_r
A numeric to specify the radius of the background of the cutoff labels.
- show_auc
A character string to specify the position of the AUC values.
"auto" (default): Automatically determine the position based on the plot. When there is a single group or 'facet_by' is provided, the AUC is placed on the plot. Otherwise, the AUC is placed in the legend.
"none": Do not display the AUC values.
"legend": Display the AUC values in the legend.
"plot": Display the AUC values on the plot (left/right bottom corner).
- auc_accuracy
A numeric to specify the accuracy of the AUC values.
- auc_size
A numeric to specify the size of the AUC values when they are displayed on the plot.
- theme
A character string or a theme class (i.e. ggplot2::theme_classic) specifying the theme to use. Default is "theme_this".
- theme_args
A list of arguments to pass to the theme function.
- palette
A character string specifying the palette to use. A named list or vector can be used to specify the palettes for different
split_byvalues.- palcolor
A character string specifying the color to use in the palette. A named list can be used to specify the colors for different
split_byvalues. If some values are missing, the values from the palette will be used (palcolor will be NULL for those values).- palreverse
A logical value indicating whether to reverse the palette. Default is FALSE.
- alpha
A numeric value specifying the transparency of the plot.
- facet_by
A character string specifying the column name of the data frame to facet the plot. Otherwise, the data will be split by
split_byand generate multiple plots and combine them into one usingpatchwork::wrap_plots- facet_scales
Whether to scale the axes of facets. Default is "fixed" Other options are "free", "free_x", "free_y". See
ggplot2::facet_wrap- facet_ncol
A numeric value specifying the number of columns in the facet. When facet_by is a single column and facet_wrap is used.
- facet_nrow
A numeric value specifying the number of rows in the facet. When facet_by is a single column and facet_wrap is used.
- facet_byrow
A logical value indicating whether to fill the plots by row. Default is TRUE.
- aspect.ratio
A numeric value specifying the aspect ratio of the plot.
- legend.position
A character string specifying the position of the legend. if
waiver(), for single groups, the legend will be "none", otherwise "right".- legend.direction
A character string specifying the direction of the legend.
- title
A character string specifying the title of the plot. A function can be used to generate the title based on the default title. This is useful when split_by is used and the title needs to be dynamic.
- subtitle
A character string specifying the subtitle of the plot.
- xlab
A character string specifying the x-axis label.
- ylab
A character string specifying the y-axis label.
- combine
Whether to combine the plots into one when facet is FALSE. Default is TRUE.
- nrow
A numeric value specifying the number of rows in the facet.
- ncol
A numeric value specifying the number of columns in the facet.
- byrow
A logical value indicating whether to fill the plots by row.
- seed
The random seed to use. Default is 8525.
- axes
A string specifying how axes should be treated. Passed to
patchwork::wrap_plots(). Only relevant whensplit_byis used andcombineis TRUE. Options are:'keep' will retain all axes in individual plots.
'collect' will remove duplicated axes when placed in the same run of rows or columns of the layout.
'collect_x' and 'collect_y' will remove duplicated x-axes in the columns or duplicated y-axes in the rows respectively.
- axis_titles
A string specifying how axis titltes should be treated. Passed to
patchwork::wrap_plots(). Only relevant whensplit_byis used andcombineis TRUE. Options are:'keep' will retain all axis titles in individual plots.
'collect' will remove duplicated titles in one direction and merge titles in the opposite direction.
'collect_x' and 'collect_y' control this for x-axis titles and y-axis titles respectively.
- guides
A string specifying how guides should be treated in the layout. Passed to
patchwork::wrap_plots(). Only relevant whensplit_byis used andcombineis TRUE. Options are:'collect' will collect guides below to the given nesting level, removing duplicates.
'keep' will stop collection at this level and let guides be placed alongside their plot.
'auto' will allow guides to be collected if a upper level tries, but place them alongside the plot if not.
- design
Specification of the location of areas in the layout, passed to
patchwork::wrap_plots(). Only relevant whensplit_byis used andcombineis TRUE. When specified,nrow,ncol, andbyroware ignored. Seepatchwork::wrap_plots()for more details.- ...
Additional arguments.
Value
A patch_work::wrap_plots object or a list of them if combine is FALSE.
You can retrieve the AUC values using attr(p, "auc") if combine is TRUE.
If combine is FALSE, The AUC value of each plot can be retrieved using attr(p[[i]], "auc").
Examples
set.seed(8525)
D.ex <- rbinom(200, size = 1, prob = .5)
M1 <- rnorm(200, mean = D.ex, sd = .65)
M2 <- rnorm(200, mean = D.ex, sd = 1.5)
gender <- c("Male", "Female")[rbinom(200, 1, .49) + 1]
data <- data.frame(D = D.ex, D.str = c("Healthy", "Ill")[D.ex + 1],
gender = gender, M1 = M1, M2 = M2)
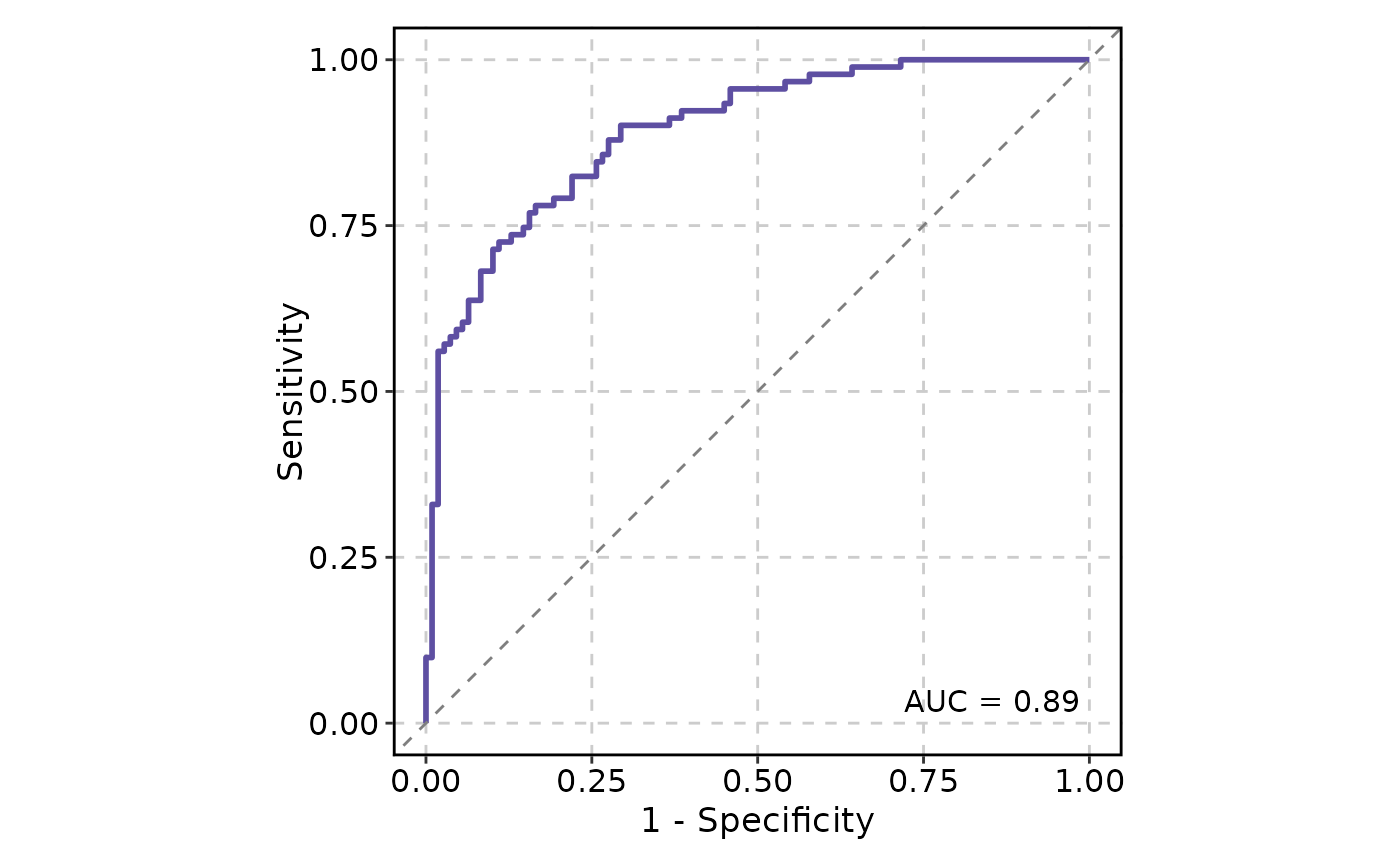
ROCCurve(data, truth_by = "D", score_by = "M1")
 # will warn about the positive label
ROCCurve(data, truth_by = "D.str", score_by = "M1")
#> Warning: 'pos_label' is NULL, value 'Ill' from 'D.str' will be used as the positive label.
# will warn about the positive label
ROCCurve(data, truth_by = "D.str", score_by = "M1")
#> Warning: 'pos_label' is NULL, value 'Ill' from 'D.str' will be used as the positive label.
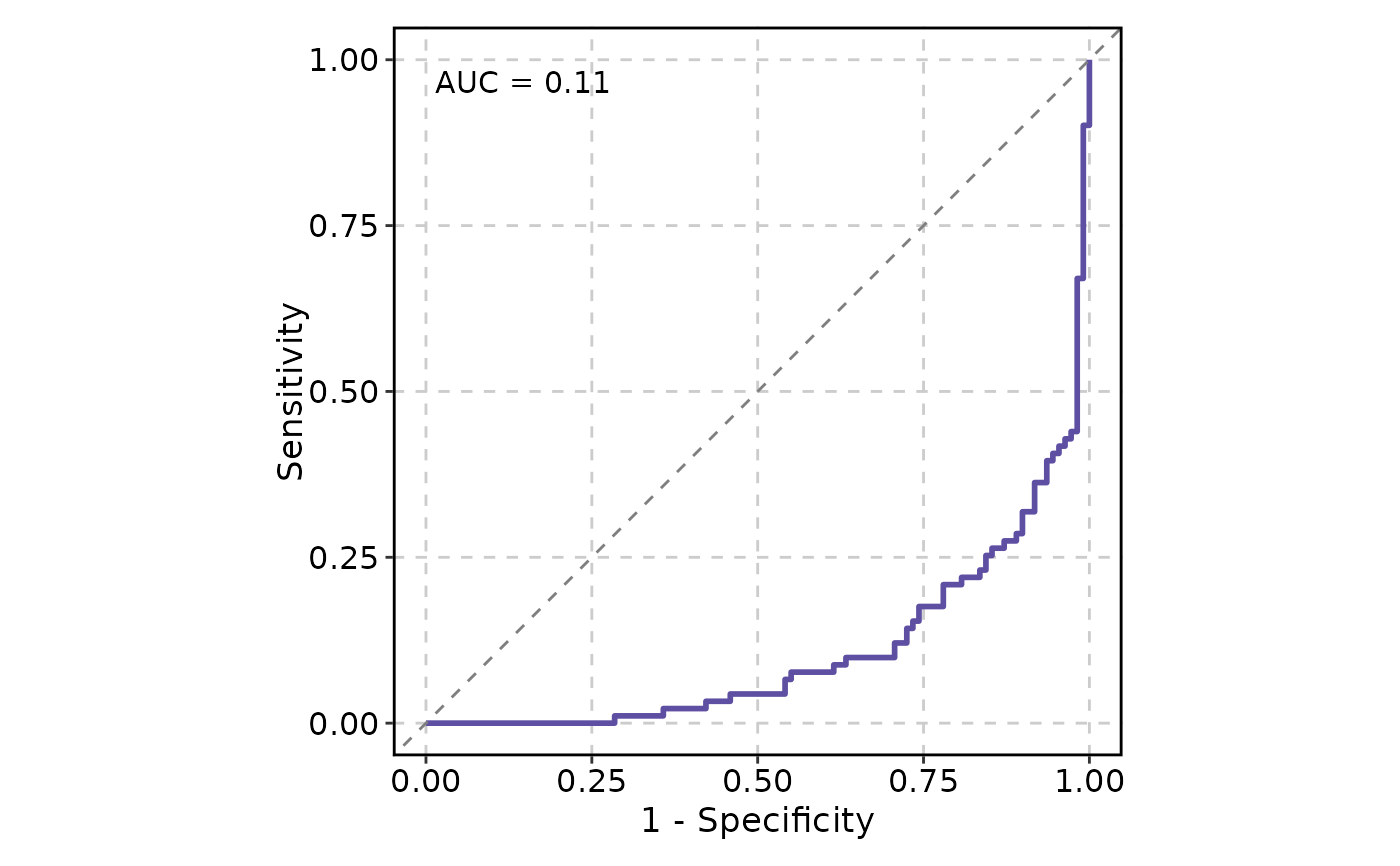 ROCCurve(data, truth_by = "D", score_by = "M1", increasing = FALSE)
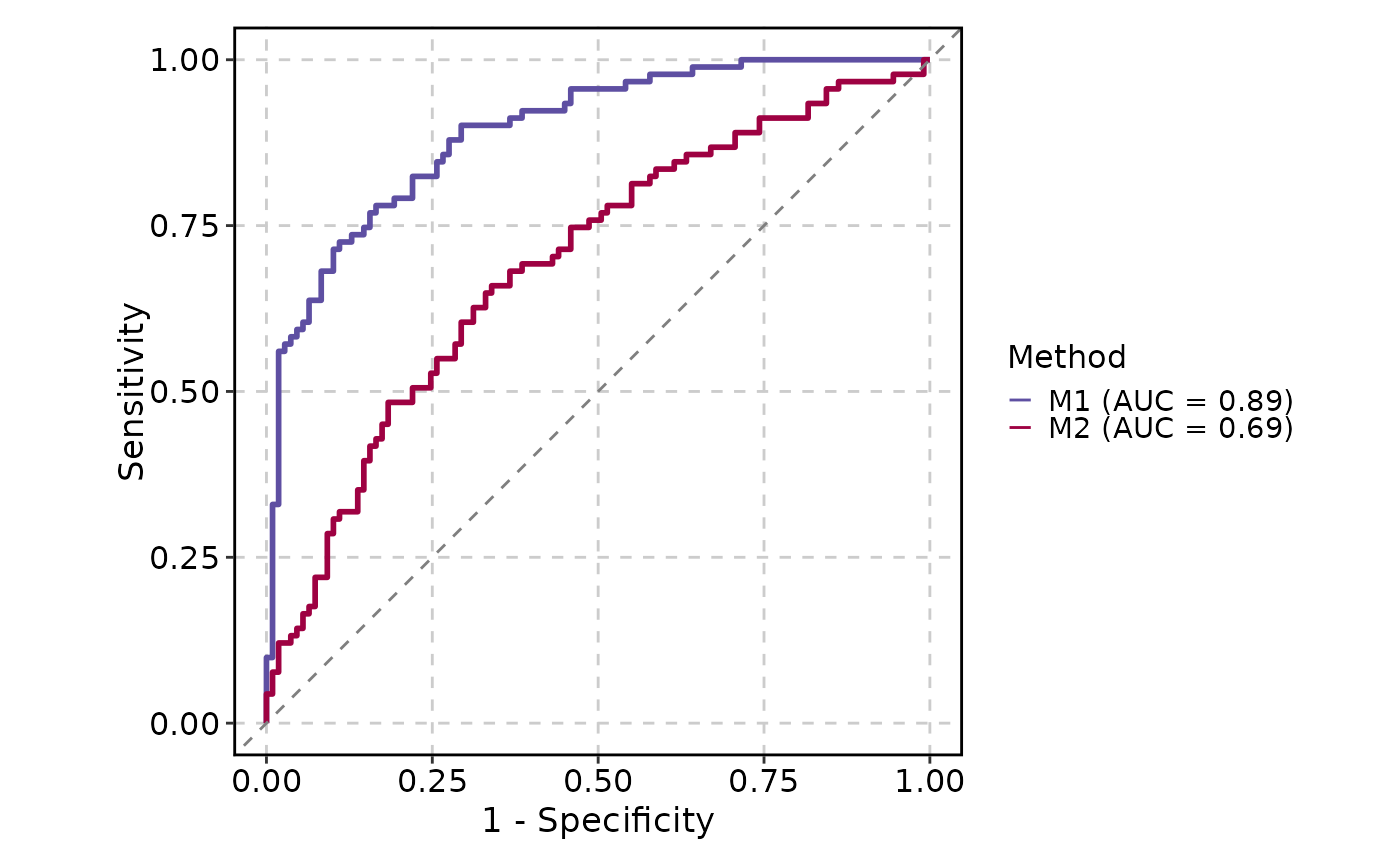 # Multiple ROC curves
ROCCurve(data, truth_by = "D", score_by = c("M1", "M2"), group_name = "Method")
# Multiple ROC curves
ROCCurve(data, truth_by = "D", score_by = c("M1", "M2"), group_name = "Method")
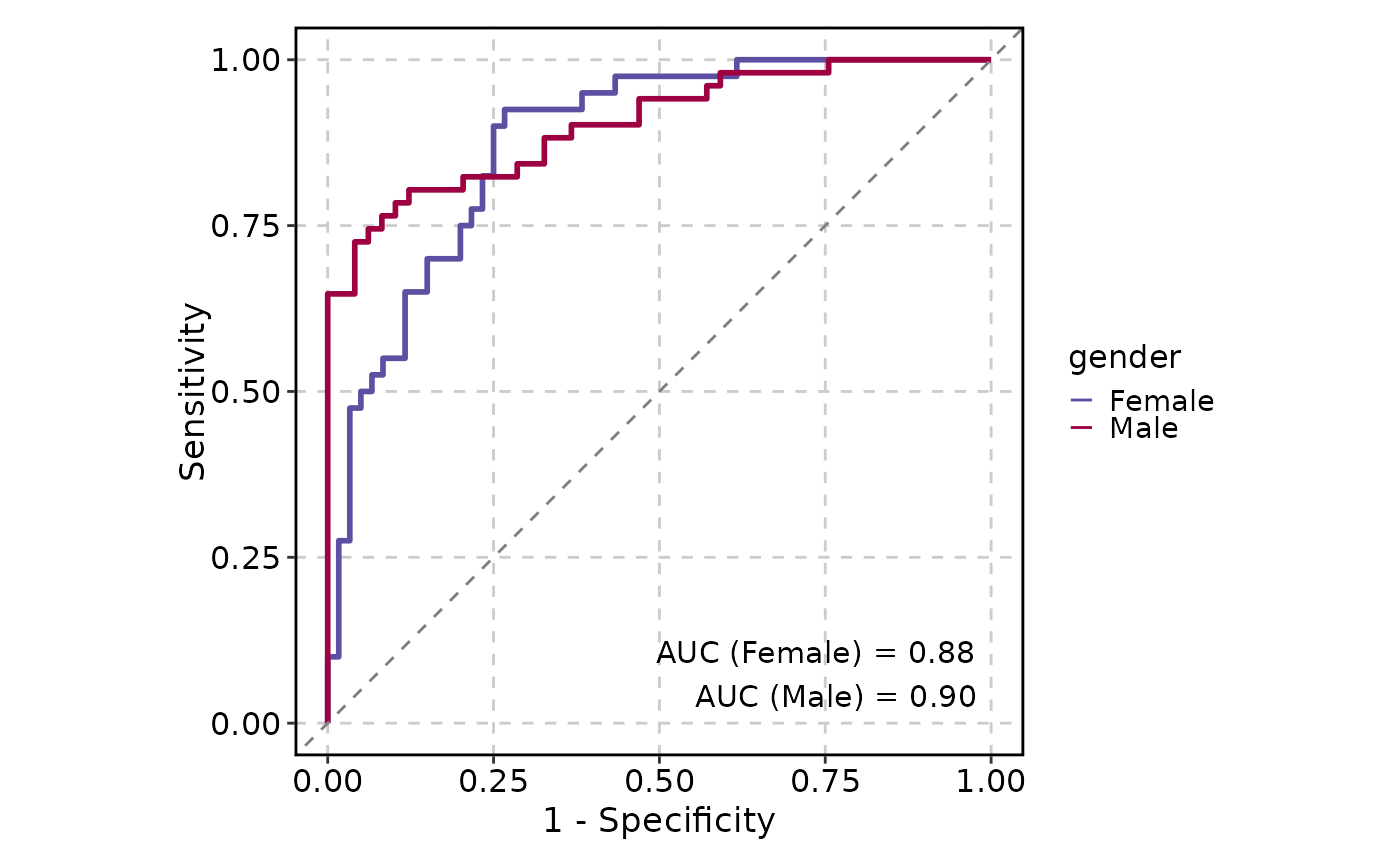 ROCCurve(data, truth_by = "D", score_by = "M1", group_by = "gender", show_auc = "plot")
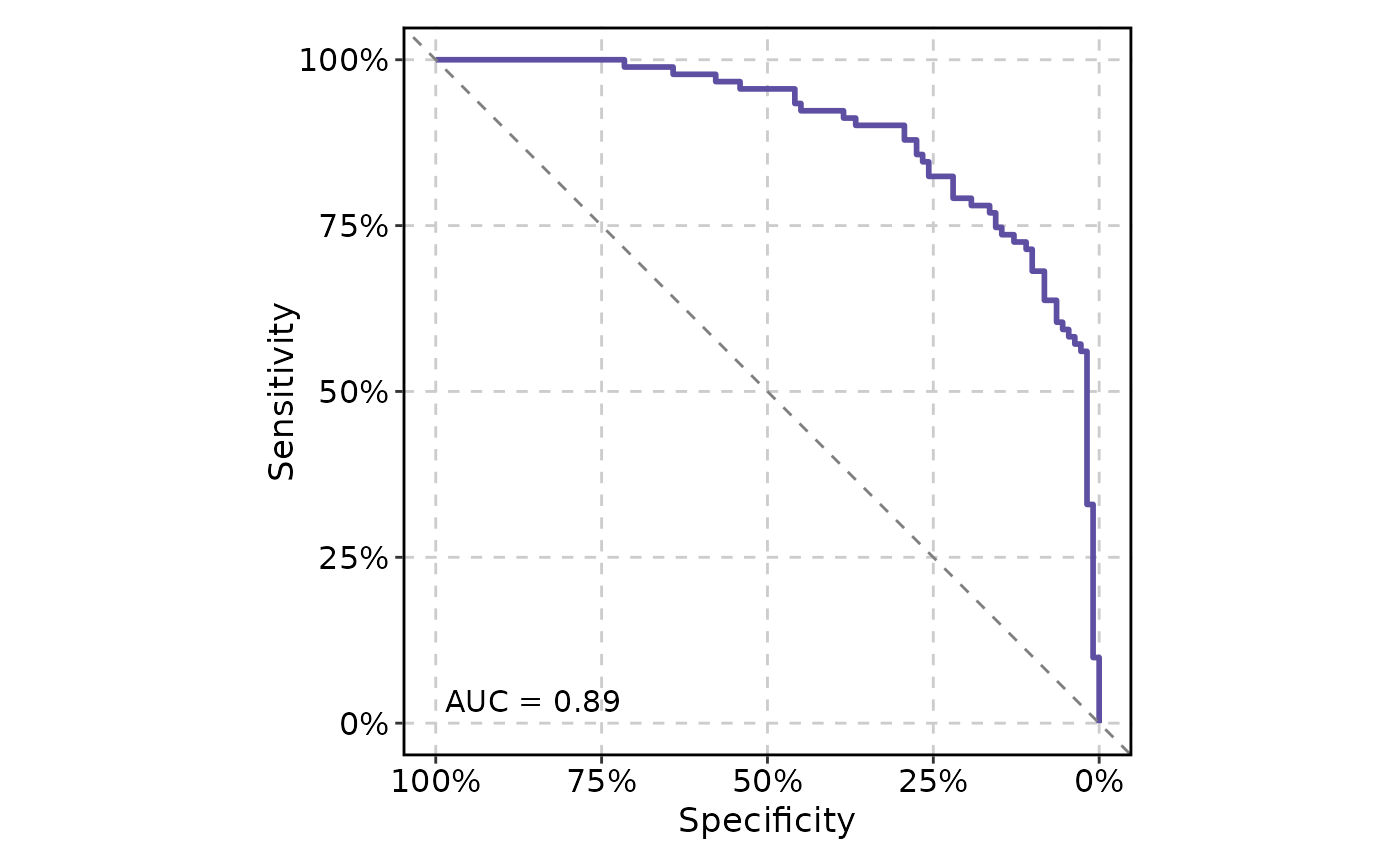 # Reverse the x-axis and display the axes as percentages
ROCCurve(data, truth_by = "D", score_by = "M1", x_axis_reverse = TRUE, percent = TRUE)
# Reverse the x-axis and display the axes as percentages
ROCCurve(data, truth_by = "D", score_by = "M1", x_axis_reverse = TRUE, percent = TRUE)
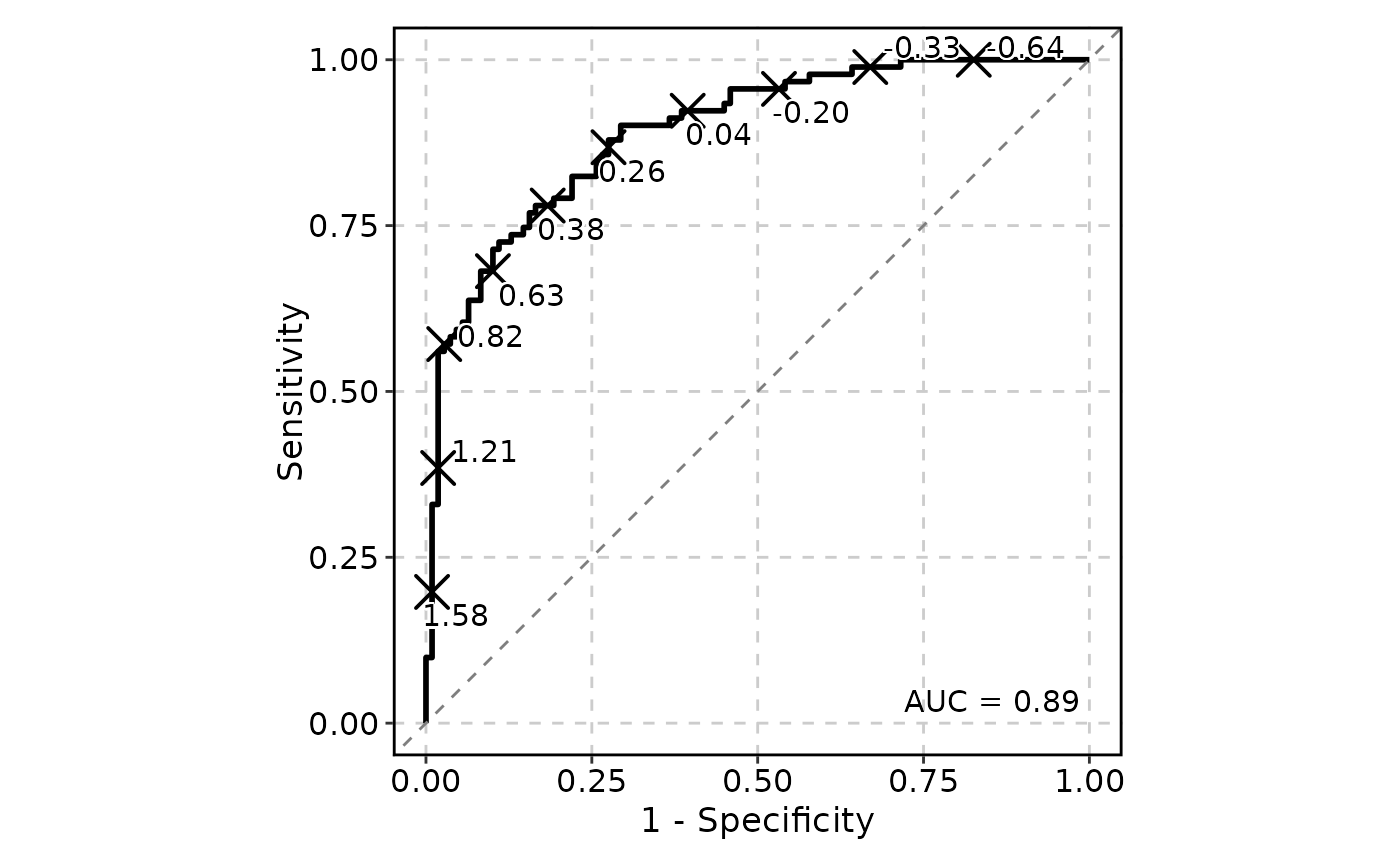 # Pass additional arguments to geom_roc and make the curve black
ROCCurve(data, truth_by = "D", score_by = "M1", n_cuts = 10, palcolor = "black")
# Pass additional arguments to geom_roc and make the curve black
ROCCurve(data, truth_by = "D", score_by = "M1", n_cuts = 10, palcolor = "black")
 # Add confidence intervals
ROCCurve(data, truth_by = "D", score_by = "M1", ci = list(sig.level = .01))
# Add confidence intervals
ROCCurve(data, truth_by = "D", score_by = "M1", ci = list(sig.level = .01))
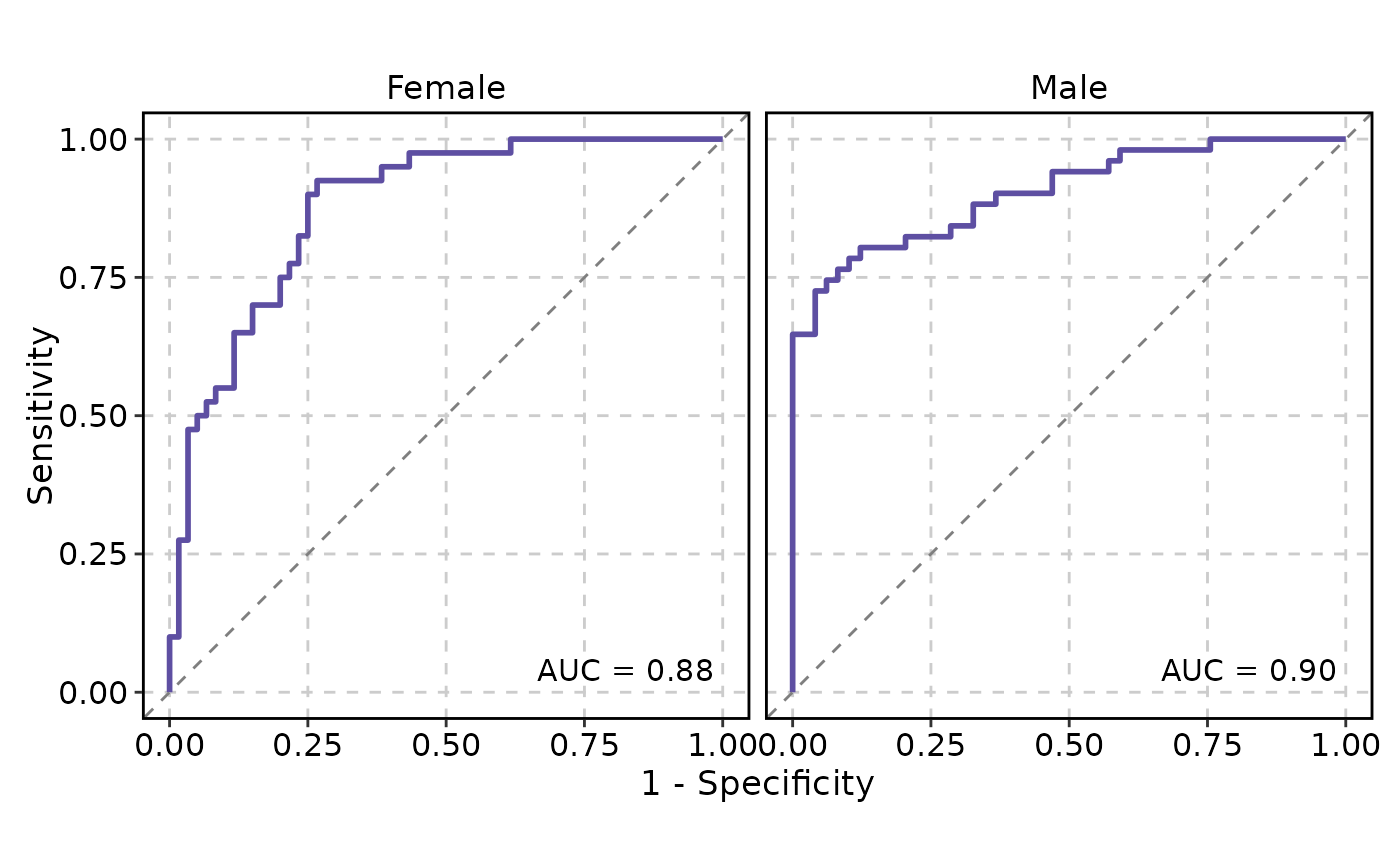 # Facet by a column
ROCCurve(data, truth_by = "D", score_by = "M1", facet_by = "gender")
# Facet by a column
ROCCurve(data, truth_by = "D", score_by = "M1", facet_by = "gender")
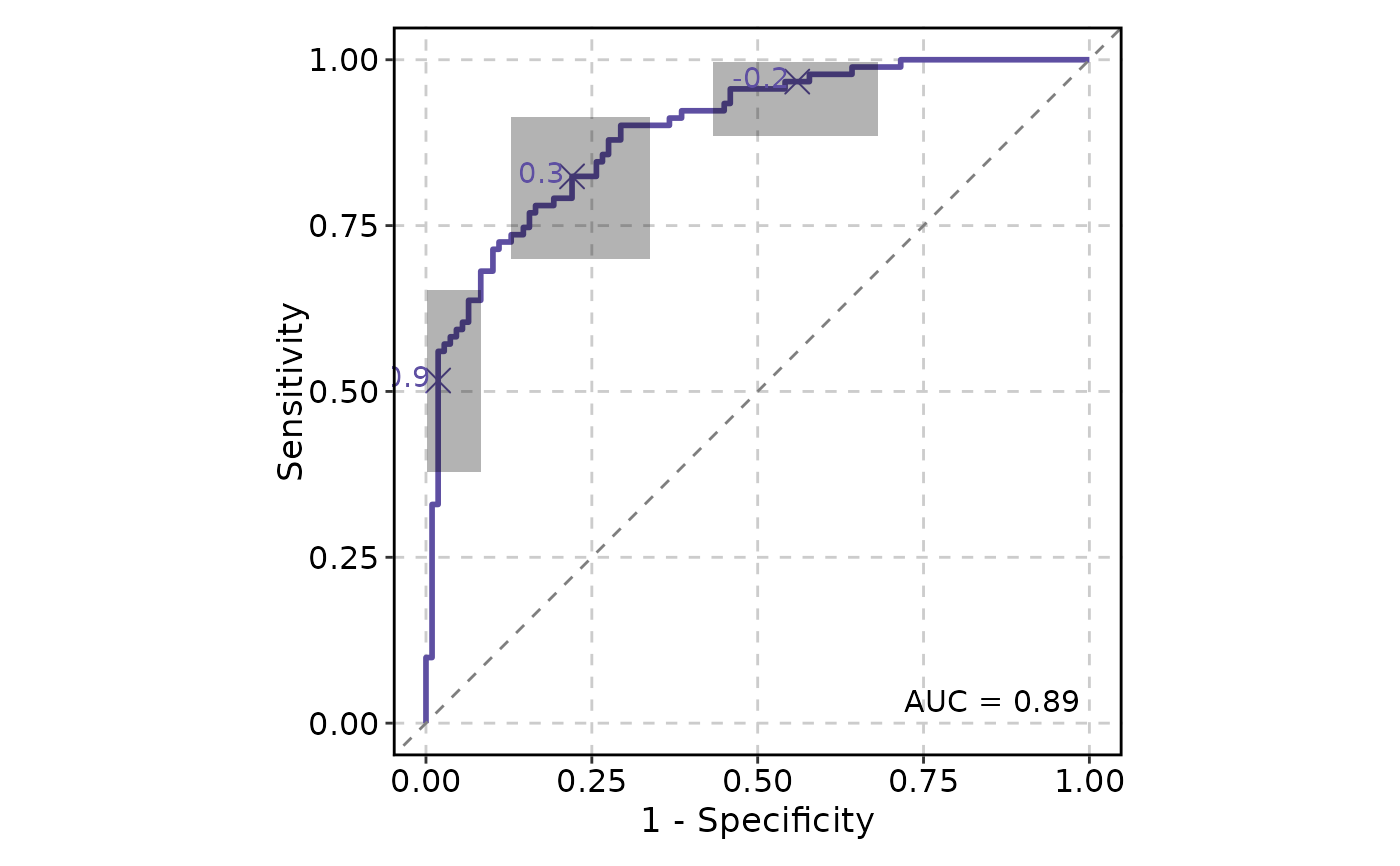
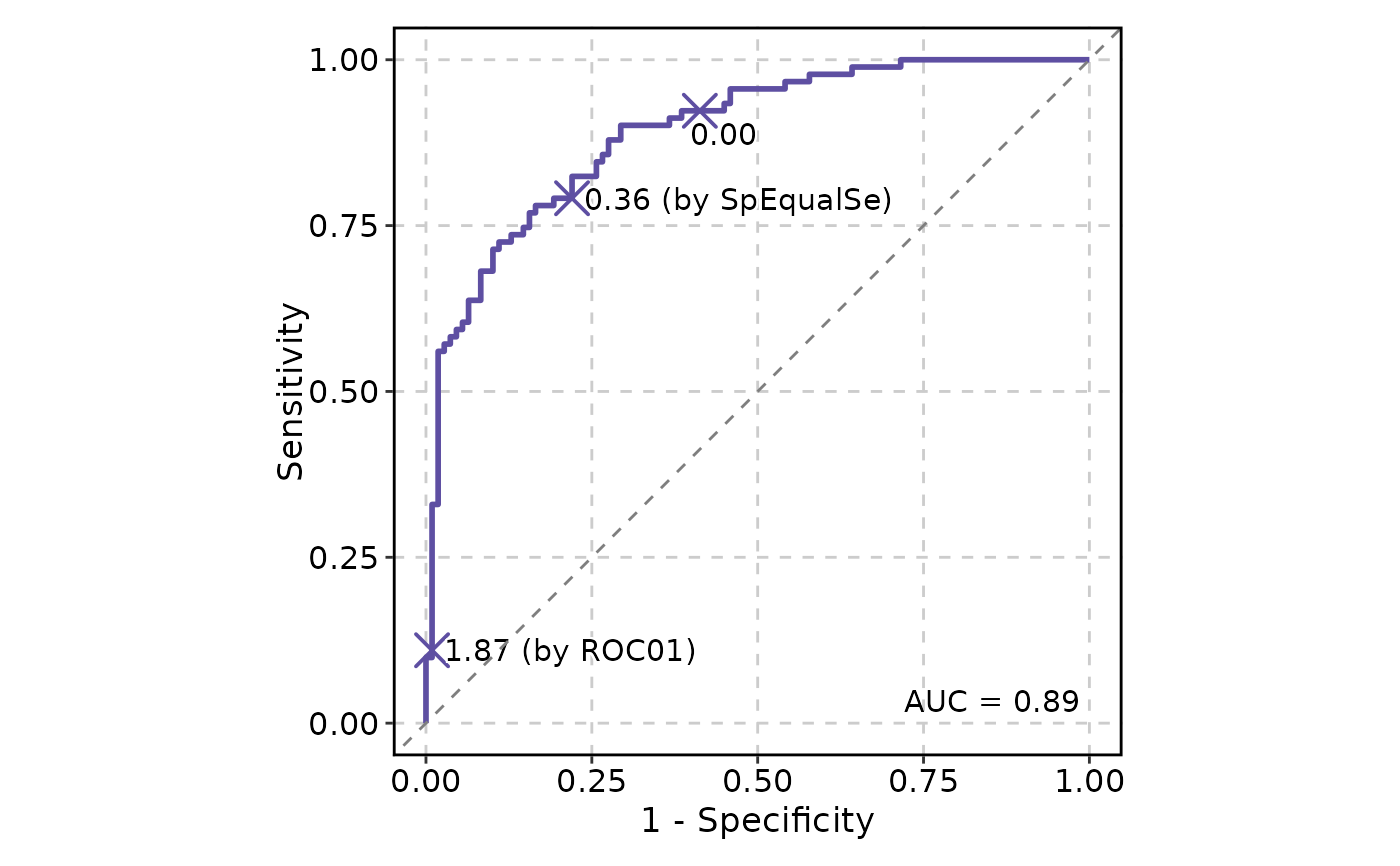 # Show cutoffs
ROCCurve(data, truth_by = "D", score_by = "M1", cutoffs_at = c(0, "ROC01", "SpEqualSe"))
# Show cutoffs
ROCCurve(data, truth_by = "D", score_by = "M1", cutoffs_at = c(0, "ROC01", "SpEqualSe"))
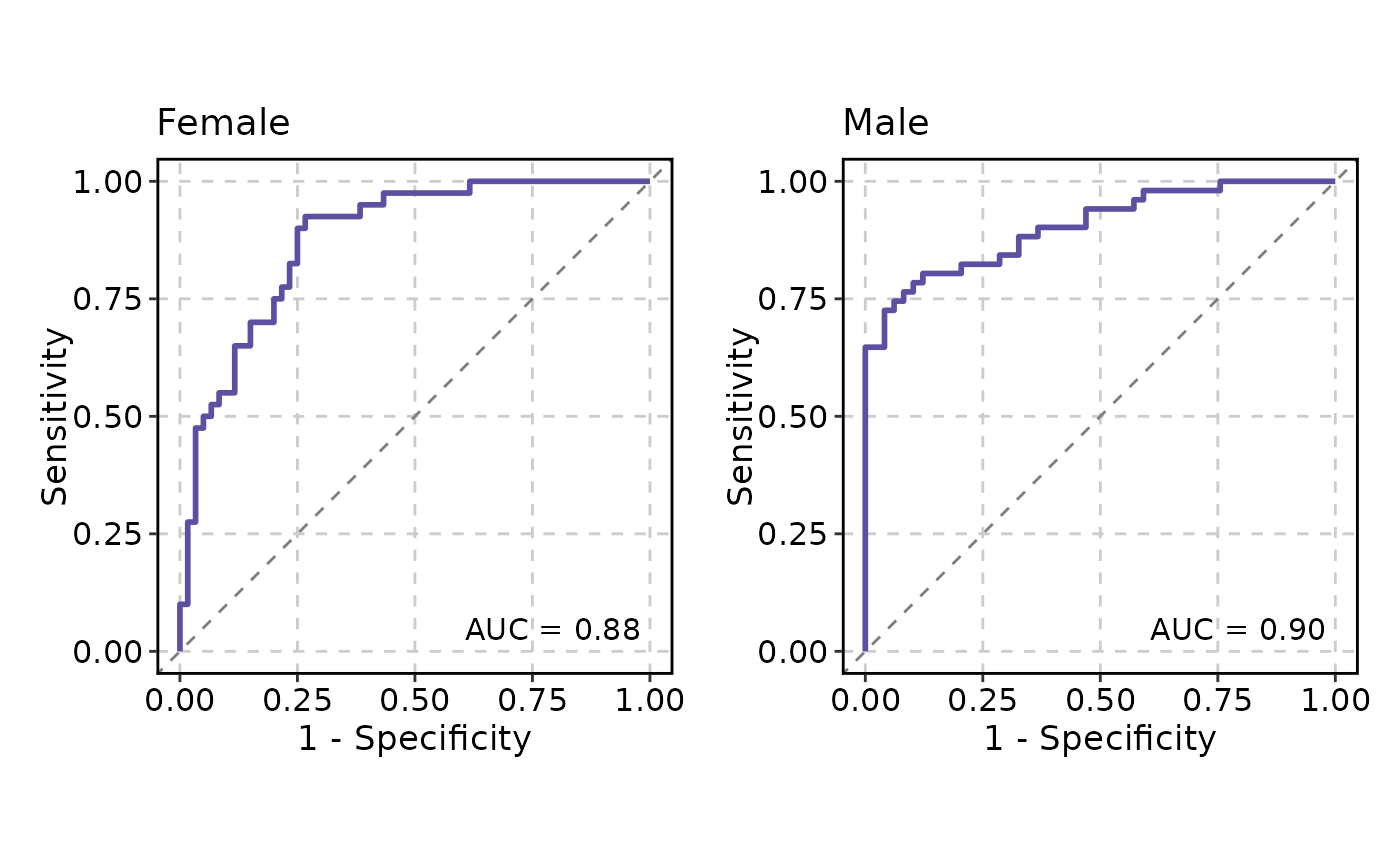 # Split by a column
p <- ROCCurve(data, truth_by = "D", score_by = "M1", split_by = "gender",
cutoffs_at = c(0.2, "MaxSpSe"))
p
# Split by a column
p <- ROCCurve(data, truth_by = "D", score_by = "M1", split_by = "gender",
cutoffs_at = c(0.2, "MaxSpSe"))
p
 # Retrieve the AUC values
attr(p, "auc")
#> PANEL COORD group AUC gender
#> 1 1 1 1 0.8779167 Female
#> 2 1 1 1 0.9039616 Male
# Retrieve the cutoffs
attr(p, "cutoffs")
#> cutoff x y label ..group specificity
#> 1 0.2 0.2833333 0.9250000 0.200 0.7166667
#> 2 0.359521377967435 0.2333333 0.8000000 0.360 (by MaxSpSe) 0.7666667
#> 3 0.2 0.3265306 0.8823529 0.200 0.6734694
#> 4 0.344386035694676 0.2040816 0.8235294 0.344 (by MaxSpSe) 0.7959184
#> sensitivity gender
#> 1 0.9250000 Female
#> 2 0.8000000 Female
#> 3 0.8823529 Male
#> 4 0.8235294 Male
# Retrieve the AUC values
attr(p, "auc")
#> PANEL COORD group AUC gender
#> 1 1 1 1 0.8779167 Female
#> 2 1 1 1 0.9039616 Male
# Retrieve the cutoffs
attr(p, "cutoffs")
#> cutoff x y label ..group specificity
#> 1 0.2 0.2833333 0.9250000 0.200 0.7166667
#> 2 0.359521377967435 0.2333333 0.8000000 0.360 (by MaxSpSe) 0.7666667
#> 3 0.2 0.3265306 0.8823529 0.200 0.6734694
#> 4 0.344386035694676 0.2040816 0.8235294 0.344 (by MaxSpSe) 0.7959184
#> sensitivity gender
#> 1 0.9250000 Female
#> 2 0.8000000 Female
#> 3 0.8823529 Male
#> 4 0.8235294 Male