
Draws a network graph from a links (edge list) data frame and an optional
nodes (vertex metadata) data frame. The graph is constructed via
igraph, laid out with igraph layout algorithms, and
rendered with ggraph. Supports directed or
undirected edges, variable link widths/linetypes/colours, node
sizes/shapes/colours/fills, community detection with enclosure marks,
automatic node labels, and a wide range of layout options.
When links (and optionally nodes) contain a
split_by column, separate sub-plots are generated for each split
level and combined via patchwork. Unlike most
other plot types, Network operates on two data frames; splitting
may affect both.
Usage
Network(
  links,
  nodes = NULL,
  split_by = NULL,
  split_by_sep = "_",
  split_nodes = FALSE,
  from = NULL,
  from_sep = "_",
  to = NULL,
  to_sep = "_",
  node_by = NULL,
  node_by_sep = "_",
  link_weight_by = 2,
  link_weight_name = NULL,
  link_type_by = "solid",
  link_type_name = NULL,
  node_size_by = 15,
  node_size_name = NULL,
  node_color_by = "black",
  node_color_name = NULL,
  node_shape_by = 21,
  node_shape_name = NULL,
  node_fill_by = "grey20",
  node_fill_name = NULL,
  link_alpha = 1,
  node_alpha = 0.95,
  node_stroke = 1.5,
  cluster_scale = c("fill", "color", "shape"),
  node_size_range = c(5, 20),
  link_weight_range = c(0.5, 5),
  link_arrow_offset = 20,
  link_curvature = 0,
  link_color_by = "from",
  link_color_name = NULL,
  palette = "Paired",
  palcolor = NULL,
  palreverse = FALSE,
  link_palette = ifelse(link_color_by %in% c("from", "to"), palette, "Set1"),
  link_palcolor = if (link_color_by %in% c("from", "to")) palcolor else NULL,
  directed = TRUE,
  layout = "circle",
  cluster = "none",
  add_mark = FALSE,
  mark_expand = ggplot2::unit(10, "mm"),
  mark_type = c("hull", "ellipse", "rect", "circle"),
  mark_alpha = 0.1,
  mark_linetype = 1,
  add_label = TRUE,
  label_size = 3,
  label_fg = "white",
  label_bg = "black",
  label_bg_r = 0.1,
  arrow = ggplot2::arrow(type = "closed", length = ggplot2::unit(0.1, "inches")),
  title = NULL,
  subtitle = NULL,
  xlab = NULL,
  ylab = NULL,
  aspect.ratio = 1,
  theme = "theme_this",
  theme_args = list(),
  legend.position = "right",
  legend.direction = "vertical",
  seed = 8525,
  combine = TRUE,
  nrow = NULL,
  ncol = NULL,
  byrow = TRUE,
  axes = NULL,
  axis_titles = axes,
  guides = NULL,
  design = NULL,
  ...
)
Arguments
- links
A data frame containing the edge list. Must contain the
fromandtocolumns specifying source and target node identifiers. Additional columns can be referenced by other parameters (e.g.,link_weight_by,link_type_by,link_color_by).- nodes
An optional data frame of node metadata. When provided, columns such as
node_size_by,node_color_by,node_shape_by, andnode_fill_bycan reference its columns. WhenNULL, the node set is inferred from the unique values in thefromandtocolumns. If a single character string starting with"@", the nodes data frame is extracted from the corresponding attribute oflinks(e.g."@nodes"extractsattr(links, "nodes")).- split_by
The column(s) to split data by and plot separately. When
combine = TRUE, the combined plot's data (p$data) contains the rows of every split, tagged with thesplit_bycolumn. For ggraph-based plots (e.g.Network,ClustreePlot), the node layout of every split is exposed with the split column, and the original link rows (also tagged with thesplit_bycolumn) are available as the"edges"attribute of the data.- split_by_sep
The separator for multiple split_by columns. See
split_by- split_nodes
A logical value. When
TRUEandsplit_byis provided, thenodesdata frame is split by the samesplit_bycolumn in addition to the links. Both data frames must have a column with the same name assplit_by. DefaultFALSE.- from
A character string specifying the column name in
linksfor the source node identifiers. Defaults to"from", or the first column oflinksif that column name does not exist. Multiple columns can be provided; they are concatenated withfrom_sep.- from_sep
A character string to join multiple
fromcolumns. Default"_". Ignored whenfromis a single column.- to
A character string specifying the column name in
linksfor the target node identifiers. Defaults to"to", or the second column oflinksif that column name does not exist. Multiple columns can be provided; they are concatenated withto_sep.- to_sep
A character string to join multiple
tocolumns. Default"_". Ignored whentois a single column.- node_by
A character string specifying the column name in
nodesfor the node identifiers. These must match the values in thefrom/tocolumns oflinks. Defaults to"name", or the first column ofnodesif that column name does not exist. Multiple columns can be provided; they are concatenated withnode_by_sep.- node_by_sep
A character string to join multiple
node_bycolumns. Default"_". Ignored whennode_byis a single column.- link_weight_by
A numeric value or a character string. If numeric, all edges receive that constant line width. If a column name, the edge line width is mapped to that column. Default
2.- link_weight_name
A character string for the link weight legend title. When
NULL(default), the column name fromlink_weight_byis used. Only relevant whenlink_weight_byis a column name.- link_type_by
A character string or a column name specifying the edge linetype. Can be
"solid","dashed","dotted", etc. If a column name fromlinksis supplied, the linetype is mapped to that column (with a version check for ggplot2 4.0.0, where mapping is unsupported and a warning is issued). Default"solid".- link_type_name
A character string for the link linetype legend title. When
NULL(default), the column name fromlink_type_byis used. Only relevant whenlink_type_byis a column name.- node_size_by
A numeric value or a character string. If numeric, all nodes receive that constant point size. If a column name, the size is mapped to that column. Default
15.- node_size_name
A character string for the node size legend title. When
NULL(default), the column name fromnode_size_byis used. Only relevant whennode_size_byis a column name.- node_color_by
A character string specifying the node colour. If a colour name or hex code (e.g.
"black"), all nodes receive that constant colour. If a column name fromnodesis supplied, the colour is mapped to that column. Default"black".- node_color_name
A character string for the node colour legend title. When
NULL(default), the column name fromnode_color_byis used. Only relevant whennode_color_byis a column name.- node_shape_by
A numeric value or a character string. If numeric, all nodes receive that constant shape (see
shape). If a column name, the shape is mapped to that column (cast to factor). Default21(filled circle with border).- node_shape_name
A character string for the node shape legend title. When
NULL(default), the column name fromnode_shape_byis used. Only relevant whennode_shape_byis a column name.- node_fill_by
A character string specifying the node fill colour. If a colour name or hex code (e.g.
"grey20"), all nodes receive that constant fill. If a column name fromnodesis supplied, the fill is mapped to that column. Default"grey20".- node_fill_name
A character string for the node fill legend title. When
NULL(default), the column name fromnode_fill_byis used. Only relevant whennode_fill_byis a column name.- link_alpha
A numeric value specifying the transparency (alpha) of the edge lines. Between
0(invisible) and1(opaque). Default1.- node_alpha
A numeric value specifying the fill transparency of the nodes. Only applies when
node_shape_byis one of the filled shapes (21–25). Default0.95.- node_stroke
A numeric value specifying the border stroke width of the node points. Default
1.5.- cluster_scale
A character string specifying which node aesthetic is overridden by cluster membership. One of
"fill","color", or"shape". The value is matched viamatch.arg; default is"fill".- node_size_range
A numeric vector of length 2 giving the minimum and maximum node size (in ggplot2 point units) when
node_size_byis a column name. Defaultc(5, 20).- link_weight_range
A numeric vector of length 2 giving the minimum and maximum edge line width (in mm) when
link_weight_byis a column name. Defaultc(0.5, 5).- link_arrow_offset
A numeric value (in points) specifying the offset distance for the arrow end cap from the target node. Prevents arrow heads from overlapping the node points. Only relevant when
directed = TRUE. Default20.- link_curvature
A numeric value controlling the curvature of the edges.
0(default) produces straight edges; positive values curve them away from the direct path.- link_color_by
A character string controlling how edge colour is determined. Options:
"from"(default) – colour follows the source node's fill or colour aesthetic."to"– colour follows the target node's fill or colour.A column name from
links– colour is mapped directly to that column.
- link_color_name
A character string for the edge colour legend title. Only used when
link_color_byis a column name (not"from"or"to"). WhenNULL(default), the column name is used.- palette
A character string specifying the palette to use. A named list or vector can be used to specify the palettes for different
split_byvalues.- palcolor
A character string specifying the color to use in the palette. A named list can be used to specify the colors for different
split_byvalues. If some values are missing, the values from the palette will be used (palcolor will be NULL for those values).- palreverse
A logical value indicating whether to reverse the palette. Default is FALSE.
- link_palette
A character string specifying the palette for edge colours when they are mapped. When
link_color_byis"from"or"to", defaults to the nodepalette. Otherwise defaults to"Set1".- link_palcolor
A character vector specifying custom colours for the edge palette. When
link_color_byis"from"or"to", defaults to the nodepalcolor. Otherwise defaults toNULL.- directed
A logical value. When
TRUE, edges are drawn with arrow heads and an end-cap offset. DefaultTRUE.- layout
A character string or an
igraph_layout_specobject specifying the node placement algorithm. Built-in shortcuts:"circle"(circular layout),"tree"(hierarchical tree),"grid"(grid layout). Any other string is prefixed with"layout_with_"and called as an igraph function (e.g."fr"for Fruchterman–Reingold,"kk"for Kamada–Kawai). Default"circle".- cluster
A character string specifying the community detection algorithm. One of
"none","fast_greedy","walktrap","edge_betweenness","infomap", or a custom clustering function from igraph. When not"none", cluster membership overrides the aesthetic selected bycluster_scale. Default"none".- add_mark
A logical value. When
TRUE(andcluster != "none"), an enclosure mark is drawn around each cluster's nodes. DefaultFALSE.- mark_expand
A
unitobject specifying the extra space around points within a cluster mark. Defaultunit(10, "mm").- mark_type
A character string specifying the mark geometry. One of
"hull","ellipse","rect", or"circle", corresponding to ggforce'sgeom_mark_hull,geom_mark_ellipse,geom_mark_rect, andgeom_mark_circle. The value is matched viamatch.arg; default is"hull".- mark_alpha
A numeric value for the fill transparency of cluster marks. Default
0.1.- mark_linetype
A numeric or character value specifying the border line type of the cluster marks. Default
1(solid).- add_label
A logical value. When
TRUE(default), node identifiers are drawn as repulsive text labels viageom_text_repel.- label_size
A numeric value for the font size of node labels. Scaled by the theme base size. Default
3.- label_fg
A character string specifying the text colour of node labels. Default
"white".- label_bg
A character string specifying the background colour of node labels. Default
"black".- label_bg_r
A numeric value specifying the background box radius (as a fraction of label height). Passed to
geom_text_repel'sbg.rargument. Default0.1.- arrow
A
arrowobject for the link arrow heads. Only used whendirected = TRUE. Default isarrow(type = "closed", length = unit(0.1, "inches")).- title
A character string specifying the title of the plot. A function can be used to generate the title based on the default title. This is useful when split_by is used and the title needs to be dynamic.
- subtitle
A character string specifying the subtitle of the plot.
- xlab
A character string specifying the x-axis label.
- ylab
A character string specifying the y-axis label.
- aspect.ratio
A numeric value specifying the aspect ratio of the plot.
- theme
A character string or a theme class (i.e. ggplot2::theme_classic) specifying the theme to use. Default is "theme_this".
- theme_args
A list of arguments to pass to the theme function.
- legend.position
A character string specifying the position of the legend. if
waiver(), for single groups, the legend will be "none", otherwise "right".- legend.direction
A character string specifying the direction of the legend.
- seed
The random seed to use. Default is 8525.
- combine
Whether to combine the plots into one when facet is FALSE. Default is TRUE.
- nrow
A numeric value specifying the number of rows in the facet.
- ncol
A numeric value specifying the number of columns in the facet.
- byrow
A logical value indicating whether to fill the plots by row.
- axes
A string specifying how axes should be treated. Passed to
patchwork::wrap_plots(). Only relevant whensplit_byis used andcombineis TRUE. Options are:'keep' will retain all axes in individual plots.
'collect' will remove duplicated axes when placed in the same run of rows or columns of the layout.
'collect_x' and 'collect_y' will remove duplicated x-axes in the columns or duplicated y-axes in the rows respectively.
- axis_titles
A string specifying how axis titltes should be treated. Passed to
patchwork::wrap_plots(). Only relevant whensplit_byis used andcombineis TRUE. Options are:'keep' will retain all axis titles in individual plots.
'collect' will remove duplicated titles in one direction and merge titles in the opposite direction.
'collect_x' and 'collect_y' control this for x-axis titles and y-axis titles respectively.
- guides
A string specifying how guides should be treated in the layout. Passed to
patchwork::wrap_plots(). Only relevant whensplit_byis used andcombineis TRUE. Options are:'collect' will collect guides below to the given nesting level, removing duplicates.
'keep' will stop collection at this level and let guides be placed alongside their plot.
'auto' will allow guides to be collected if a upper level tries, but place them alongside the plot if not.
- design
Specification of the location of areas in the layout, passed to
patchwork::wrap_plots(). Only relevant whensplit_byis used andcombineis TRUE. When specified,nrow,ncol, andbyroware ignored. Seepatchwork::wrap_plots()for more details.- ...
Additional arguments.
Value
A ggplot object (no split_by), a
patchwork object (combine = TRUE), or a named list of
ggplot objects (combine = FALSE), each with
height and width attributes in inches.
split_by workflow
When split_by is provided:
Column validation – The
split_bycolumn is validated inlinksviacheck_columns, force-converted to a factor, and empty levels are dropped.Node split – If
split_nodes = TRUEandnodesis provided, the samesplit_bycolumn is validated innodes. It must be identical in name to the linkssplit_byor an error is raised. Empty levels are also dropped.Data splitting – The
linksdata frame is split by thesplit_bylevels into a named list, preserving factor level order.Attach node splits – If
split_nodes = TRUE, thenodesdata frame is split identically. Each split's node data is attached as the"nodes"attribute on the corresponding links split.Dispatch to atomic –
NetworkAtomicis called for each split. Thenodesargument is passed as"@nodes"whensplit_nodes = TRUEso that it is extracted from the attribute. Iftitleis a function, it receives the split level name for dynamic title generation.Combination – Results are combined via
combine_plots()(whencombine = TRUE) or returned as a named list ofggplotobjects.Combined data – When
combine = TRUE, the combined plot'sdata(p$data) exposes the node layout of every split, each row tagged with thesplit_bylevel. The"graph"attribute carries a combined graph of all splits' nodes and links, and the original link rows (tagged with thesplit_bycolumn) are available in the"edges"attribute.
Examples
# \donttest{
# Create example data
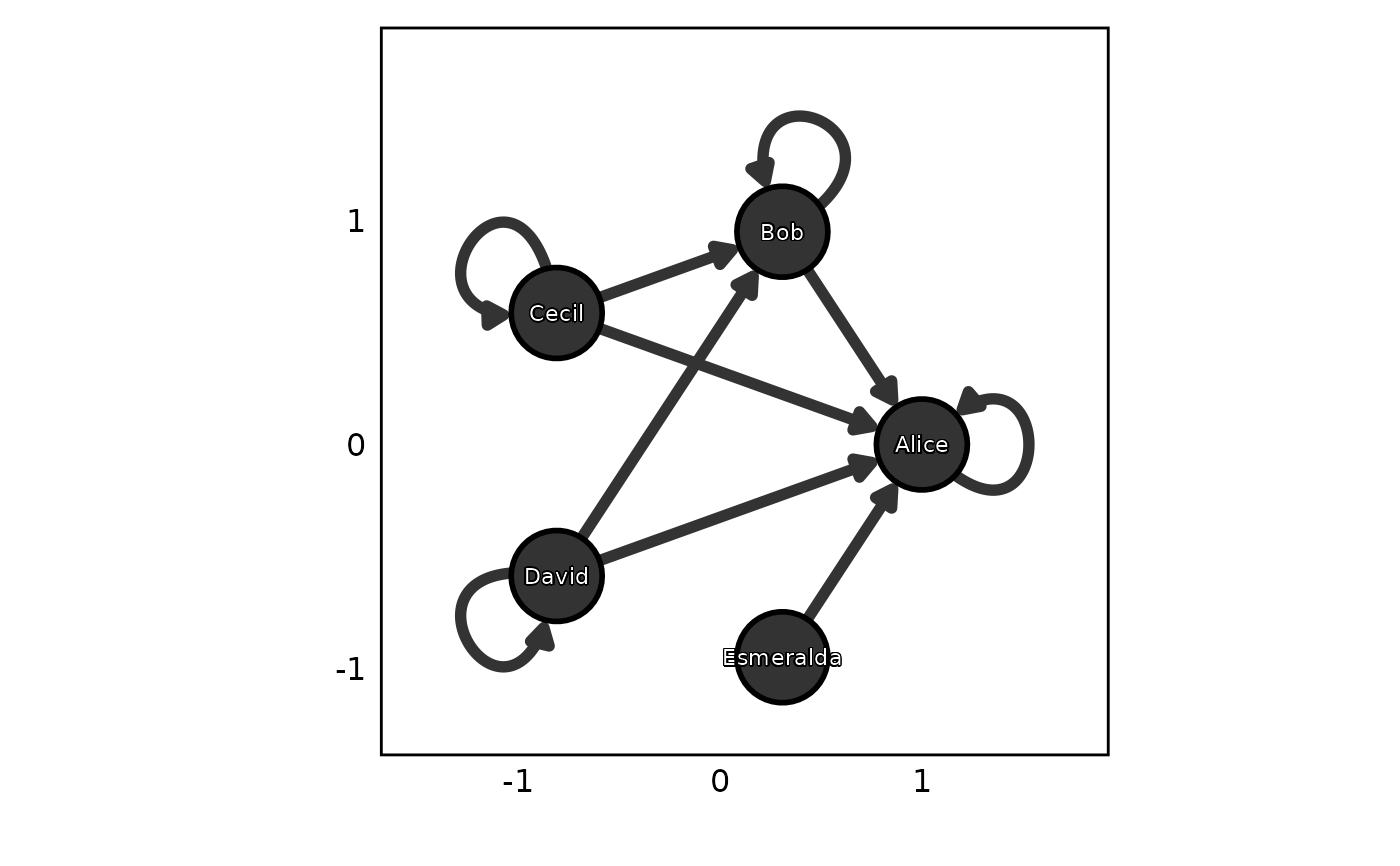
actors <- data.frame(
name = c("Alice", "Bob", "Cecil", "David", "Esmeralda"),
age = c(48, 33, 45, 34, 21),
shape = c(21, 22, 21, 22, 23),
gender = c("F", "M", "F", "M", "F")
)
relations <- data.frame(
from = c("Bob", "Cecil", "Cecil", "David", "David", "Esmeralda", "Bob", "Alice",
"Cecil", "David"),
to = c("Alice", "Bob", "Alice", "Alice", "Bob", "Alice", "Bob", "Alice", "Cecil",
"David"),
friendship = c(4, 5, 5, 2, 1, 1, 2, 1, 3, 4),
type = c(1, 1, 1, 1, 1, 2, 2, 2, 2, 2)
)
# Basic network
Network(relations, actors)
 # Blank theme with no coordinate axes
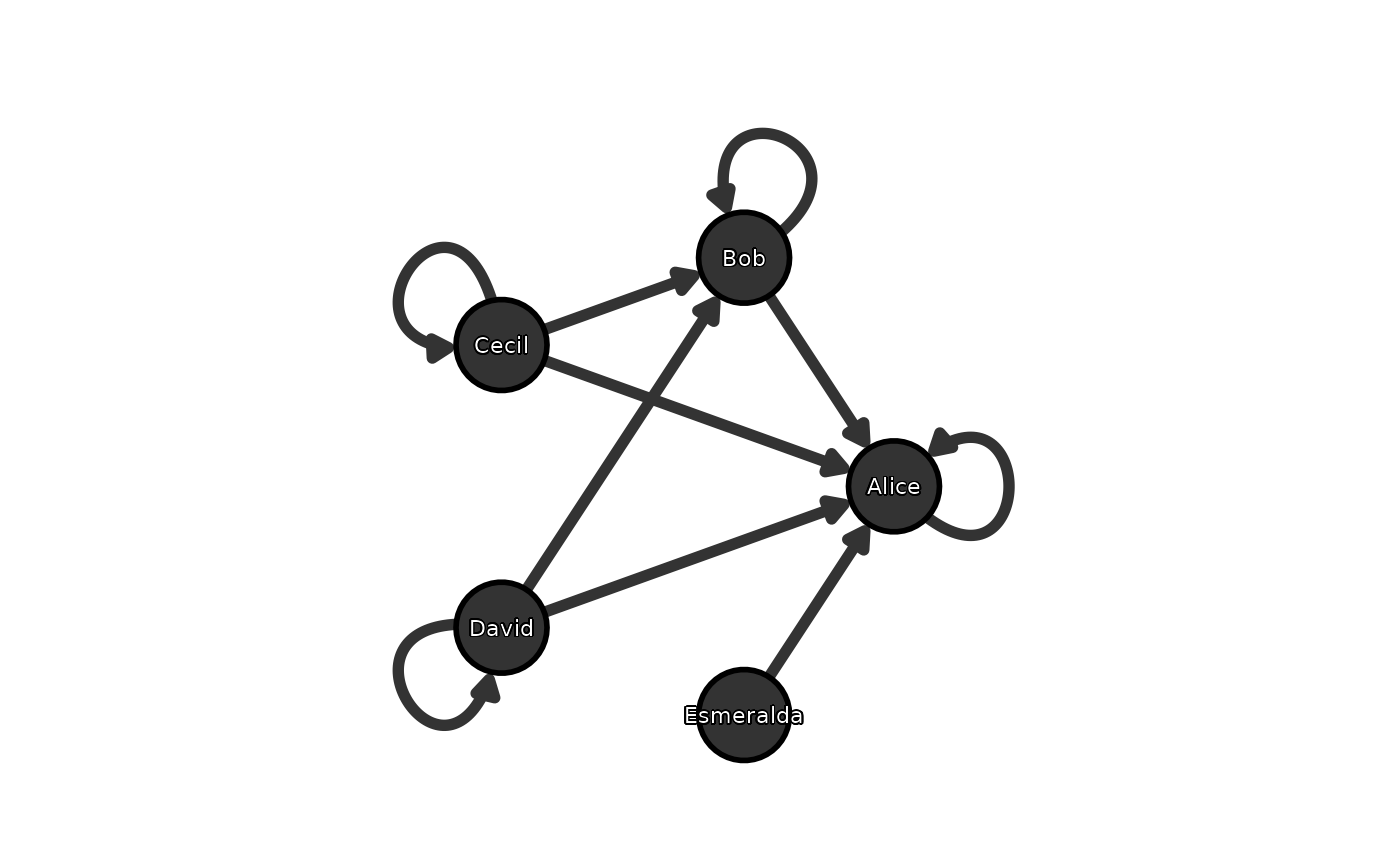
Network(relations, actors, theme = "theme_blank",
theme_args = list(add_coord = FALSE))
# Blank theme with no coordinate axes
Network(relations, actors, theme = "theme_blank",
theme_args = list(add_coord = FALSE))
 # Mapped aesthetics with custom layout
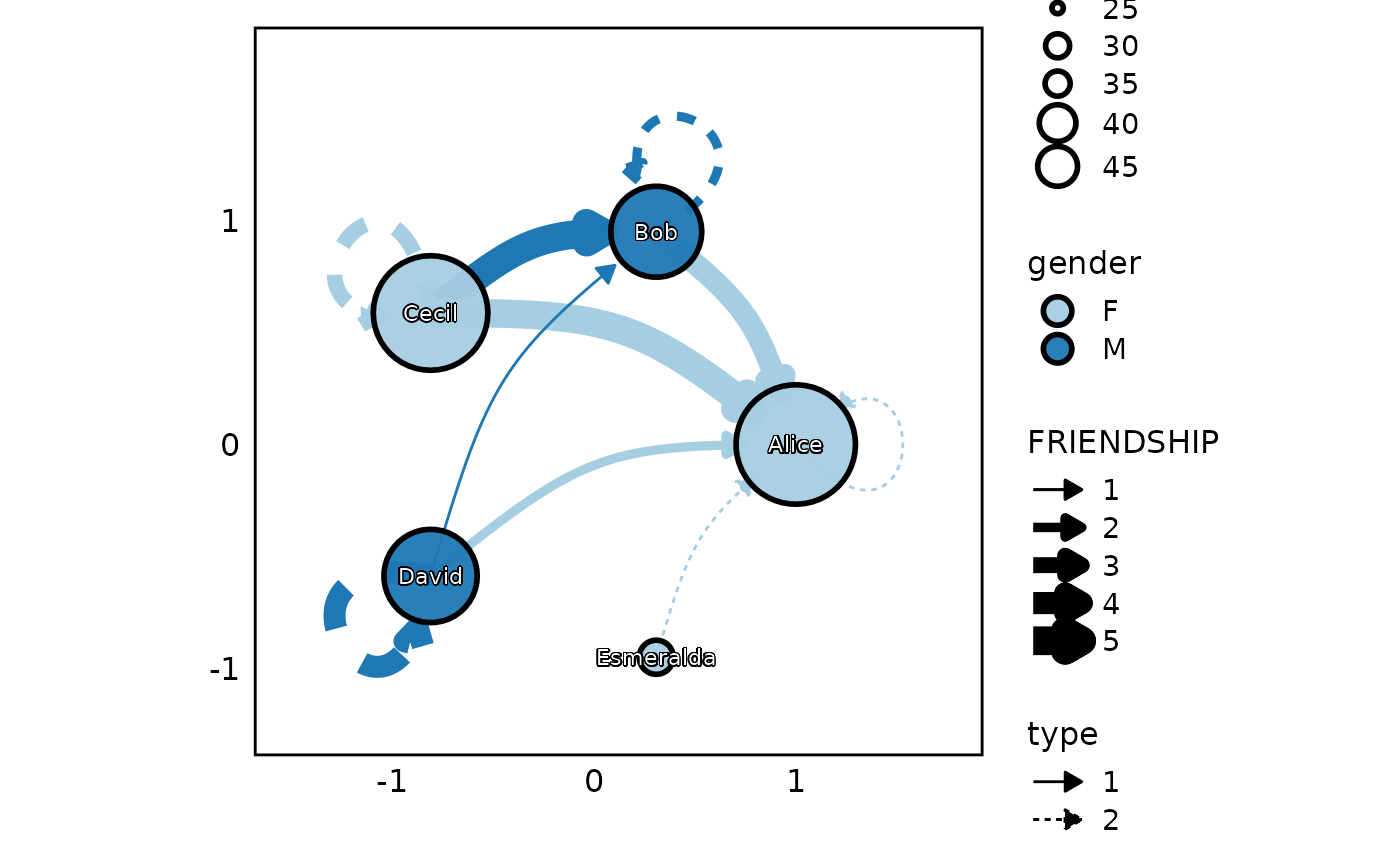
Network(relations, actors,
link_weight_by = "friendship",
node_size_by = "age",
link_weight_name = "FRIENDSHIP",
node_fill_by = "gender",
link_color_by = "to",
link_type_by = "type",
node_color_by = "black",
layout = "circle",
link_curvature = 0.2)
# Mapped aesthetics with custom layout
Network(relations, actors,
link_weight_by = "friendship",
node_size_by = "age",
link_weight_name = "FRIENDSHIP",
node_fill_by = "gender",
link_color_by = "to",
link_type_by = "type",
node_color_by = "black",
layout = "circle",
link_curvature = 0.2)
 # Tree layout with clustering and marks
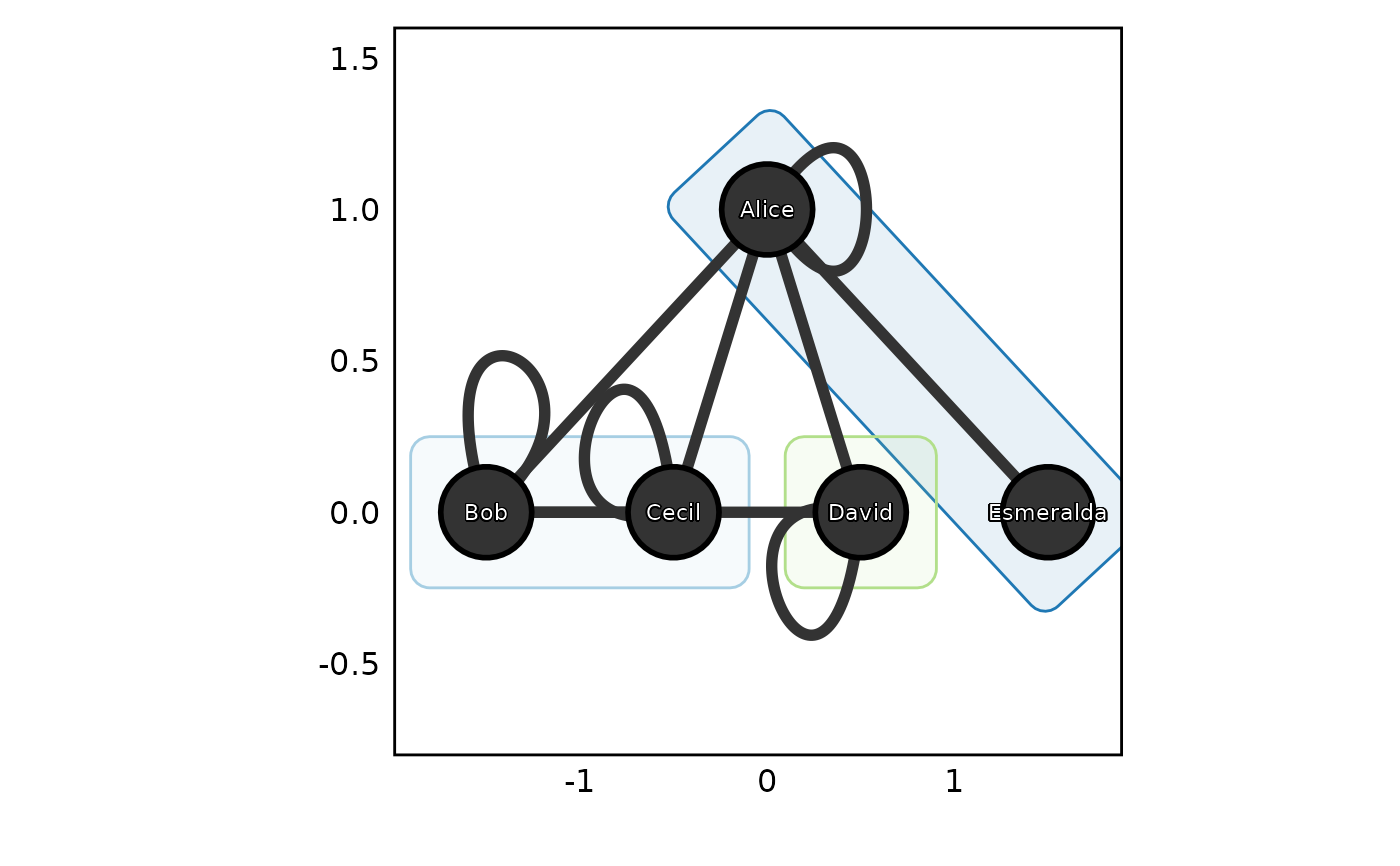
Network(relations, actors, layout = "tree",
directed = FALSE, cluster = "fast_greedy",
add_mark = TRUE)
# Tree layout with clustering and marks
Network(relations, actors, layout = "tree",
directed = FALSE, cluster = "fast_greedy",
add_mark = TRUE)
 # Split by a column
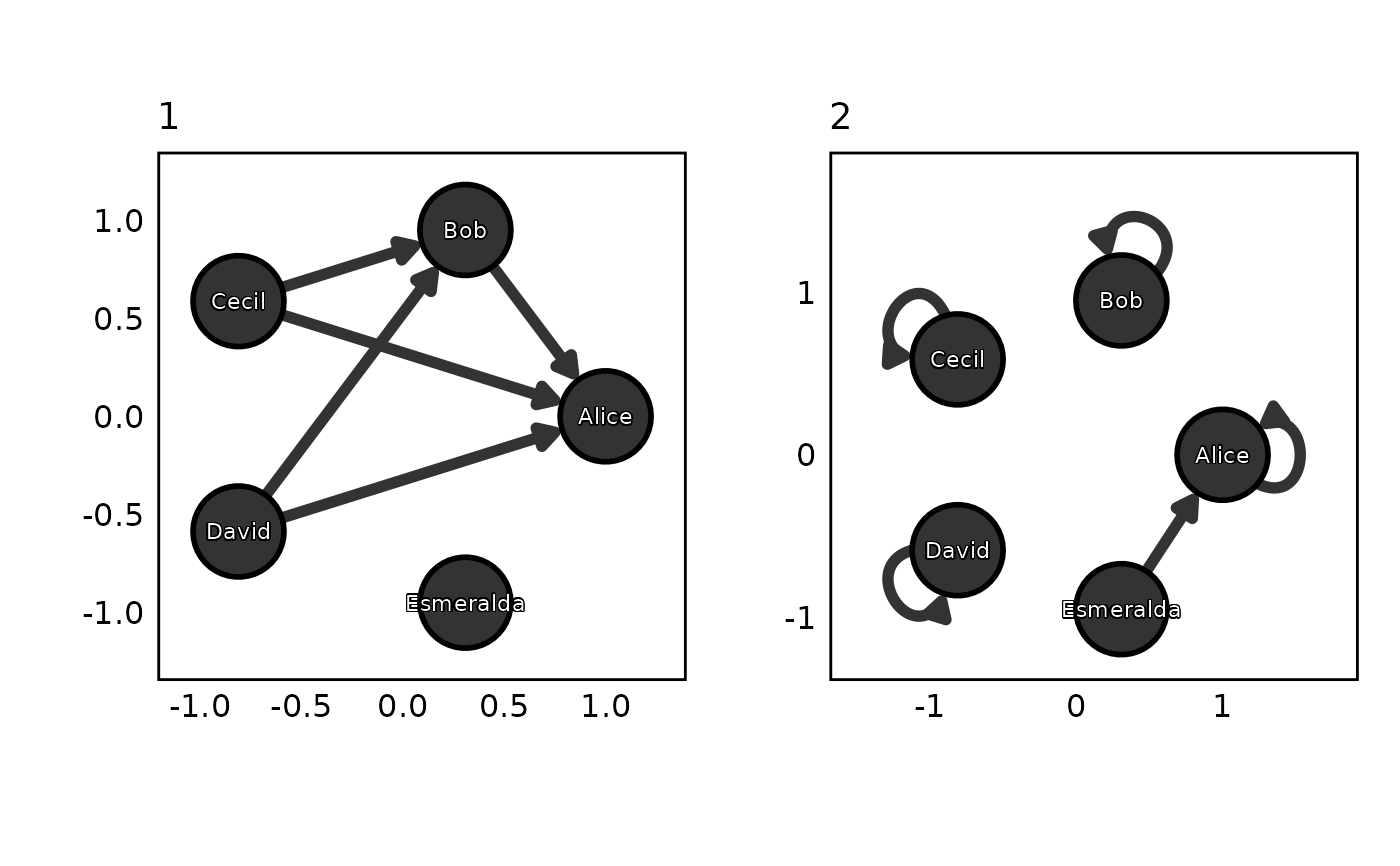
Network(relations, actors, split_by = "type")
# Split by a column
Network(relations, actors, split_by = "type")
 # }
# }