Draws a scatter plot of two numeric variables with a linear regression
line, optional correlation statistics, and point highlighting. This is
the public entry point that wraps CorPlotAtomic with
split_by support.
Key features include group-based colouring (group_by),
point highlighting by expression, rowname, or index,
annotation items (regression equation, R-squared, p-value,
Spearman/Pearson/Kendall rho, N), raster rendering for large
datasets, faceting (facet_by), and splitting
into separate sub-plots via split_by.
Usage
CorPlot(
  data,
  x,
  y,
  group_by = NULL,
  group_by_sep = "_",
  group_name = NULL,
  split_by = NULL,
  split_by_sep = "_",
  pt_size = 2,
  pt_shape = 16,
  raster = FALSE,
  alpha = 1,
  raster_dpi = c(512, 512),
  highlight = NULL,
  highlight_color = "black",
  highlight_size = 1,
  highlight_alpha = 1,
  highlight_stroke = 0.8,
  anno_items = c("eq", "r2", "p"),
  anno_size = 3,
  anno_fg = "black",
  anno_bg = "white",
  anno_bg_r = 0.1,
  anno_position = c("topleft", "topright", "bottomleft", "bottomright", "tl", "tr", "bl",
    "br"),
  add_smooth = TRUE,
  smooth_color = "red2",
  smooth_width = 1.5,
  smooth_se = FALSE,
  theme = "theme_this",
  theme_args = list(),
  palette = ifelse(is.null(group_by), "Spectral", "Paired"),
  palcolor = NULL,
  palreverse = FALSE,
  title = NULL,
  subtitle = NULL,
  xlab = NULL,
  ylab = NULL,
  facet_by = NULL,
  facet_scales = "fixed",
  facet_ncol = NULL,
  facet_nrow = NULL,
  facet_byrow = TRUE,
  aspect.ratio = 1,
  legend.position = waiver(),
  legend.direction = "vertical",
  seed = 8525,
  combine = TRUE,
  nrow = NULL,
  ncol = NULL,
  byrow = TRUE,
  axes = NULL,
  axis_titles = axes,
  guides = NULL,
  design = NULL,
  ...
)
Arguments
- data
A data frame.
- x
A character string specifying the column name of the data frame to plot for the x-axis.
- y
A character string specifying the column name of the data frame to plot for the y-axis.
- group_by
Columns to group the data for plotting For those plotting functions that do not support multiple groups, They will be concatenated into one column, using
group_by_sepas the separator- group_by_sep
The separator for multiple group_by columns. See
group_by- group_name
A character string used as the colour legend title. When
NULL, thegroup_bycolumn name is used.- split_by
The column(s) to split the data by and produce separate sub-plots. Multiple columns are concatenated with
split_by_sep.- split_by_sep
A character string to separate concatenated
split_bycolumns. Default"_".- pt_size
A numeric value specifying the size of the points. Default:
2.- pt_shape
A numeric value specifying the shape of the points (see
geom_point). Default:16(filled circle).- raster
A logical value. When
TRUE, usesscattermore::geom_scattermore()for efficient rendering of large datasets. Default:FALSE.- alpha
A numeric value specifying the transparency of the plot.
- raster_dpi
An integer vector of length 1 or 2 specifying the raster resolution in (width, height) pixels. When a single value is provided, it is recycled. Default:
c(512, 512).- highlight
Specifies which points to emphasise. Can be:
TRUE— highlight all points.A character expression (e.g.
'Species == "setosa"') — evaluated viadplyr::filter.A character vector — matched against rownames of the data.
A numeric vector — treated as row indices.
Default:
NULL(no highlighting).- highlight_color
A character string specifying the colour of the highlighted point borders. Default:
"black".- highlight_size
A numeric value specifying the size of the highlighted points (the inner fill). Default:
1.- highlight_alpha
A numeric value specifying the alpha transparency of the highlighted points. Default:
1.- highlight_stroke
A numeric value specifying the stroke width of the highlighted point borders. The outer layer size is
highlight_size + highlight_stroke. Default:0.8.- anno_items
A character vector specifying which statistics to display as text annotation. Available items:
"eq"(regression equation),"r2"(R-squared),"p"(p-value),"spearman","pearson","kendall","n"(observation count). Default:c("eq", "r2", "p").- anno_size
A numeric value specifying the font size of the annotation text (scaled by
base_size / 12). Default:3.- anno_fg
A character string specifying the colour of the annotation text. Default:
"black".- anno_bg
A character string specifying the background colour of the annotation text boxes. Default:
"white".- anno_bg_r
A numeric value specifying the corner radius of the annotation text background boxes. Default:
0.1.- anno_position
A character string specifying the corner position of the annotation text. One of
"topleft"(alias"tl"),"topright"("tr"),"bottomleft"("bl"),"bottomright"("br").- add_smooth
A logical value. When
TRUE(default), a linear regression line (geom_smooth(method = "lm")) is added.- smooth_color
A character string specifying the colour of the regression line. Default:
"red2".- smooth_width
A numeric value specifying the linewidth of the regression line. Default:
1.5.- smooth_se
A logical value. When
TRUE, a standard error band is drawn around the regression line. Default:FALSE.- theme
A character string or a theme class (i.e. ggplot2::theme_classic) specifying the theme to use. Default is "theme_this".
- theme_args
A list of arguments to pass to the theme function.
- palette
A character string specifying the palette to use. A named list or vector can be used to specify the palettes for different
split_byvalues.- palcolor
A character string specifying the color to use in the palette. A named list can be used to specify the colors for different
split_byvalues. If some values are missing, the values from the palette will be used (palcolor will be NULL for those values).- palreverse
A logical value indicating whether to reverse the palette. Default is FALSE.
- title
A character string specifying the title of the plot. A function can be used to generate the title based on the default title. This is useful when split_by is used and the title needs to be dynamic.
- subtitle
A character string specifying the subtitle of the plot.
- xlab
A character string specifying the x-axis label.
- ylab
A character string specifying the y-axis label.
- facet_by
A character string specifying the column name of the data frame to facet the plot. Otherwise, the data will be split by
split_byand generate multiple plots and combine them into one usingpatchwork::wrap_plots- facet_scales
Whether to scale the axes of facets. Default is "fixed" Other options are "free", "free_x", "free_y". See
ggplot2::facet_wrap- facet_ncol
A numeric value specifying the number of columns in the facet. When facet_by is a single column and facet_wrap is used.
- facet_nrow
A numeric value specifying the number of rows in the facet. When facet_by is a single column and facet_wrap is used.
- facet_byrow
A logical value indicating whether to fill the plots by row. Default is TRUE.
- aspect.ratio
A numeric value specifying the aspect ratio of the plot.
- legend.position
A character string specifying the position of the legend. if
waiver(), for single groups, the legend will be "none", otherwise "right".- legend.direction
A character string specifying the direction of the legend.
- seed
A numeric seed for reproducibility. Passed to
validate_common_args().- combine
Logical; when
TRUE(default), returns a combinedpatchworkobject. WhenFALSE, returns a named list of individualggplotobjects.- ncol, nrow
Integer number of columns / rows for the combined layout (passed to
wrap_plots).- byrow
Logical; fill the combined layout by row. Default
TRUE.- axes
A character string specifying how axes should be treated across the combined layout (passed to
wrap_plots).- axis_titles
A character string specifying how axis titles should be treated across the combined layout. Defaults to
axes.- guides
A character string specifying how guides (legends) should be collected across panels (passed to
combine_plots()).- design
A custom layout design for the combined plot (passed to
combine_plots()).- ...
Additional arguments.
Value
A ggplot object (when split_by is NULL),
a patchwork object (when combine = TRUE), or a named
list of ggplot objects (when combine = FALSE), each
with height and width attributes in inches.
split_by workflow
When split_by is provided:
The
split_bycolumn is validated viacheck_columns()withforce_factor = TRUE. Empty levels are dropped (droplevels()).The data frame is split by
split_by(preserving level order). Ifsplit_byisNULL, the data is wrapped in a single-element list with name"...".Per-split
palette,palcolor,legend.position, andlegend.directionare resolved viacheck_palette(),check_palcolor(), andcheck_legend().CorPlotAtomic()is called for each split. Whentitleis a function, it receives the split level name and can generate dynamic titles.Results are combined via
combine_plots()(whencombine = TRUE) or returned as a named list.
Examples
# \donttest{
data(iris)
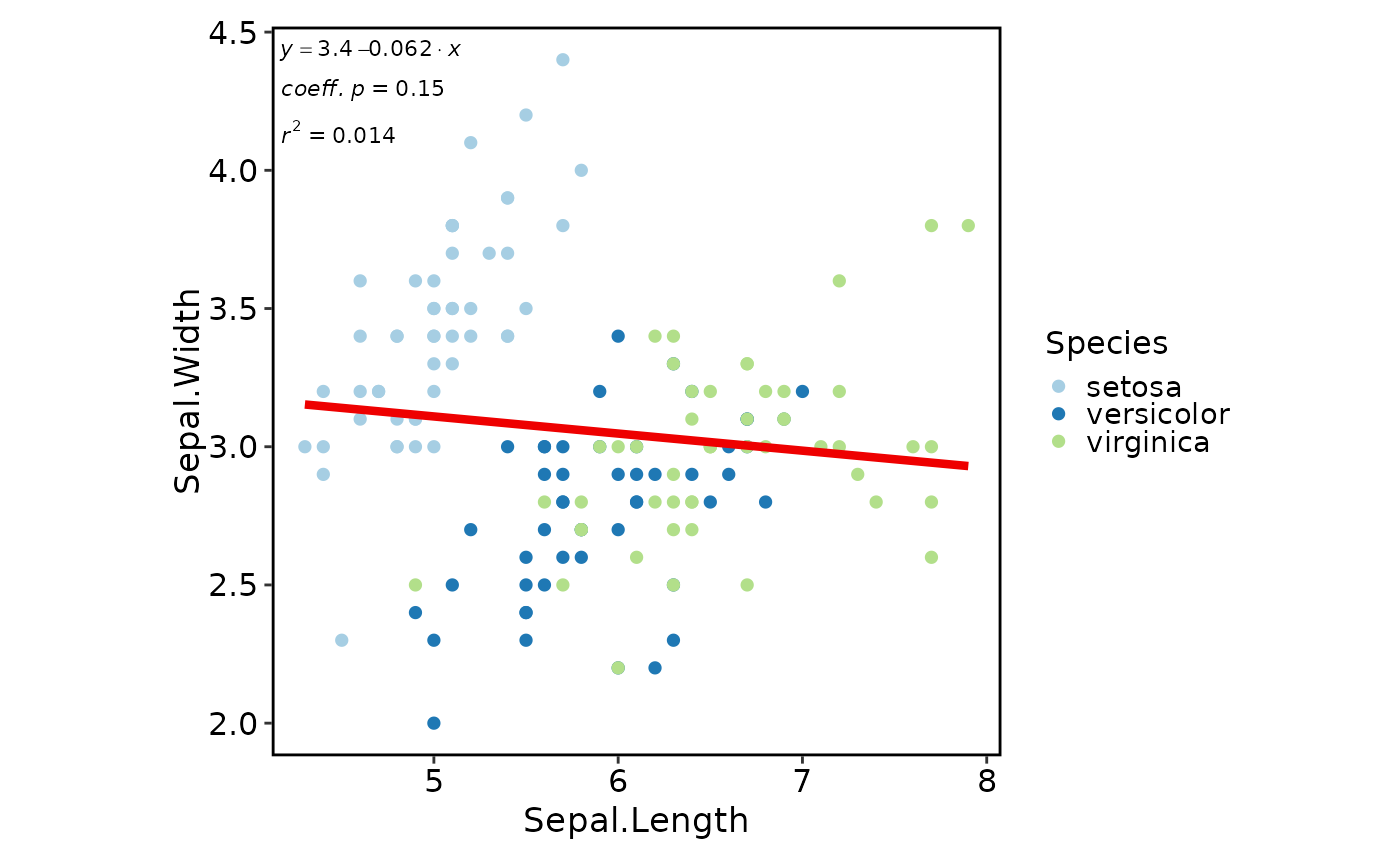
# Basic scatter with group colours
CorPlot(iris, "Sepal.Length", "Sepal.Width", group_by = "Species")
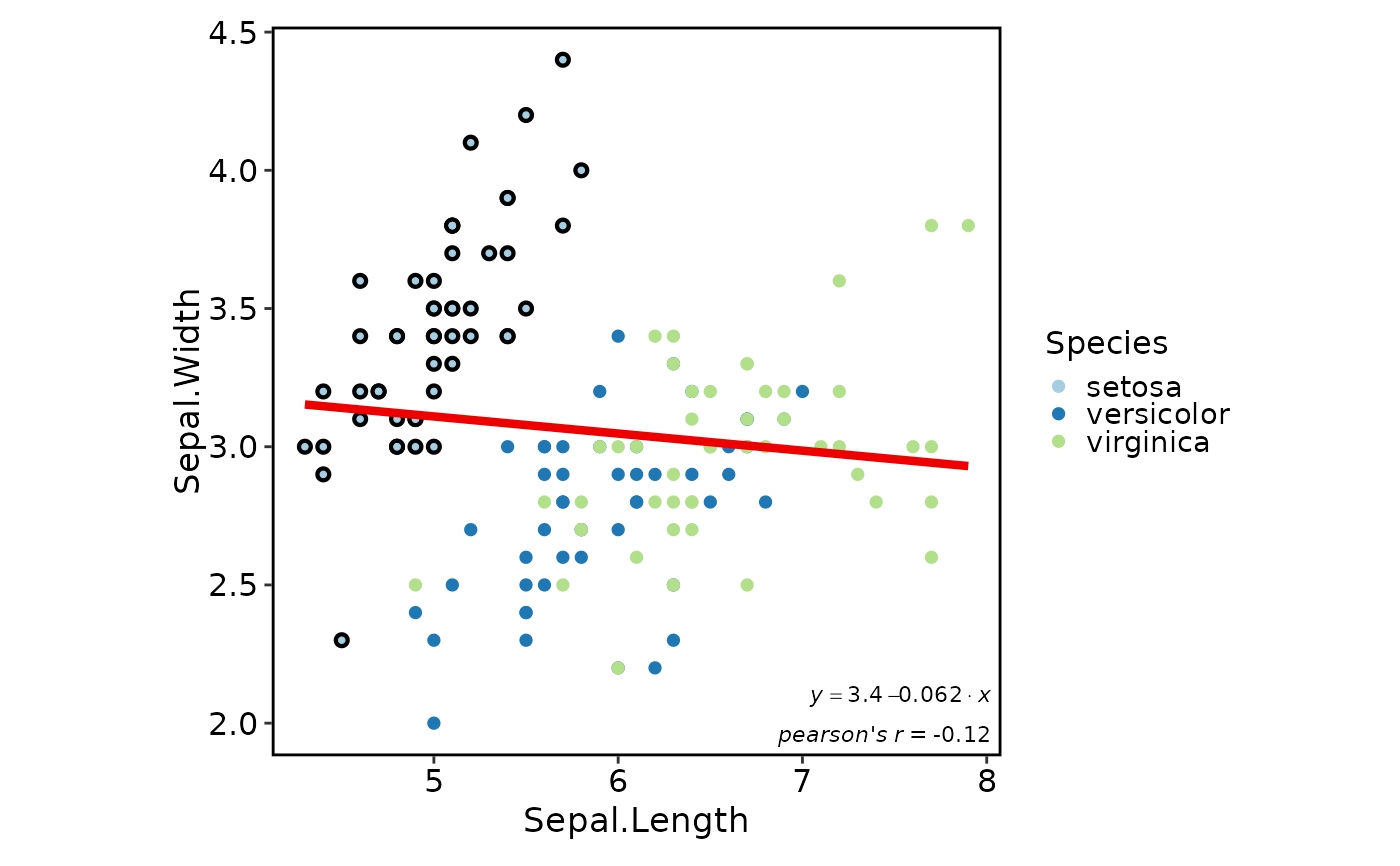
 # Highlight a specific group with custom stroke
CorPlot(iris, "Sepal.Length", "Sepal.Width", group_by = "Species",
highlight = 'Species == "setosa"', highlight_stroke = 1.5,
anno_items = c("eq", "pearson"), anno_position = "bottomright")
# Highlight a specific group with custom stroke
CorPlot(iris, "Sepal.Length", "Sepal.Width", group_by = "Species",
highlight = 'Species == "setosa"', highlight_stroke = 1.5,
anno_items = c("eq", "pearson"), anno_position = "bottomright")
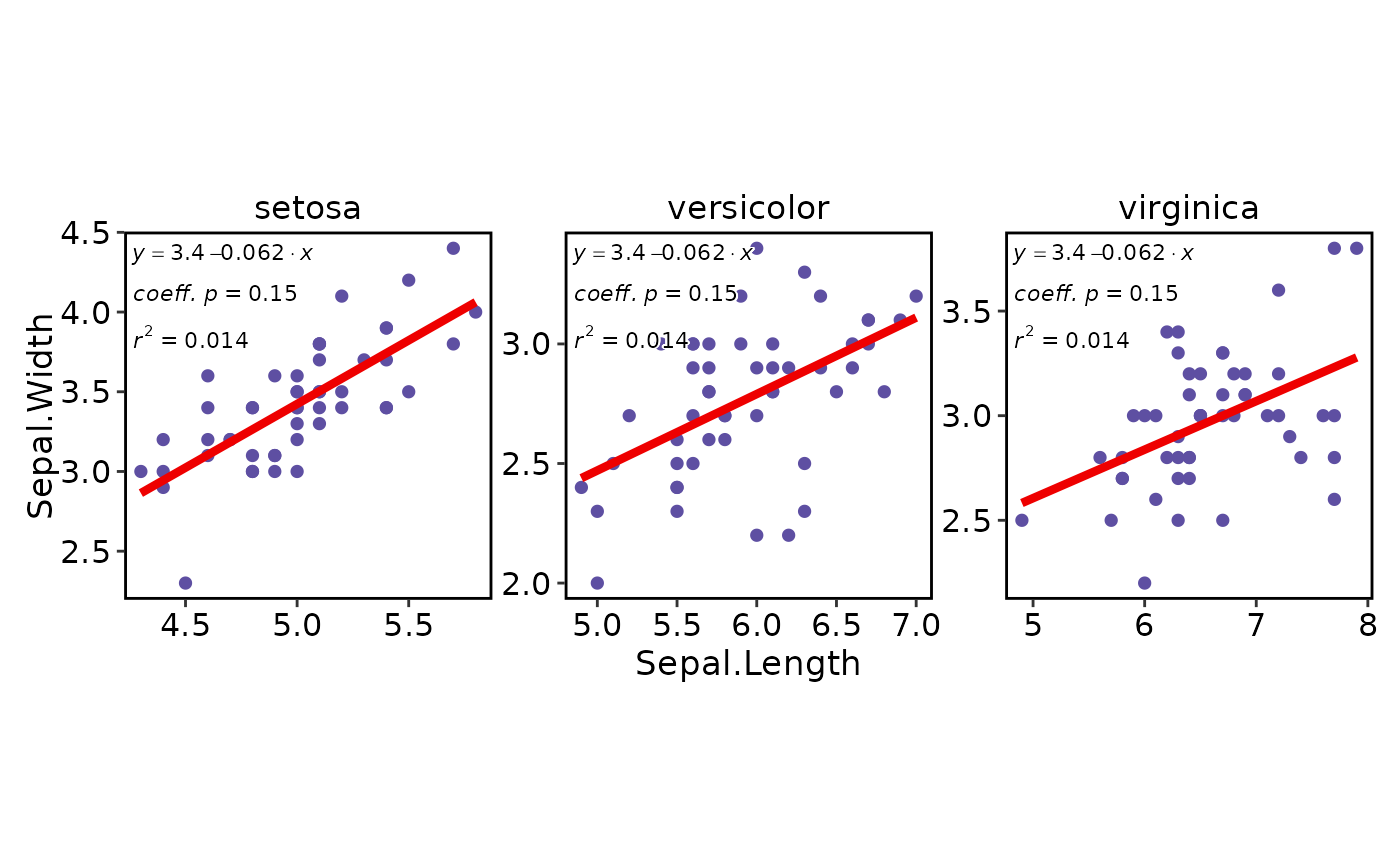
 # Faceted by species
CorPlot(iris, "Sepal.Length", "Sepal.Width", facet_by = "Species",
facet_scales = "free")
# Faceted by species
CorPlot(iris, "Sepal.Length", "Sepal.Width", facet_by = "Species",
facet_scales = "free")
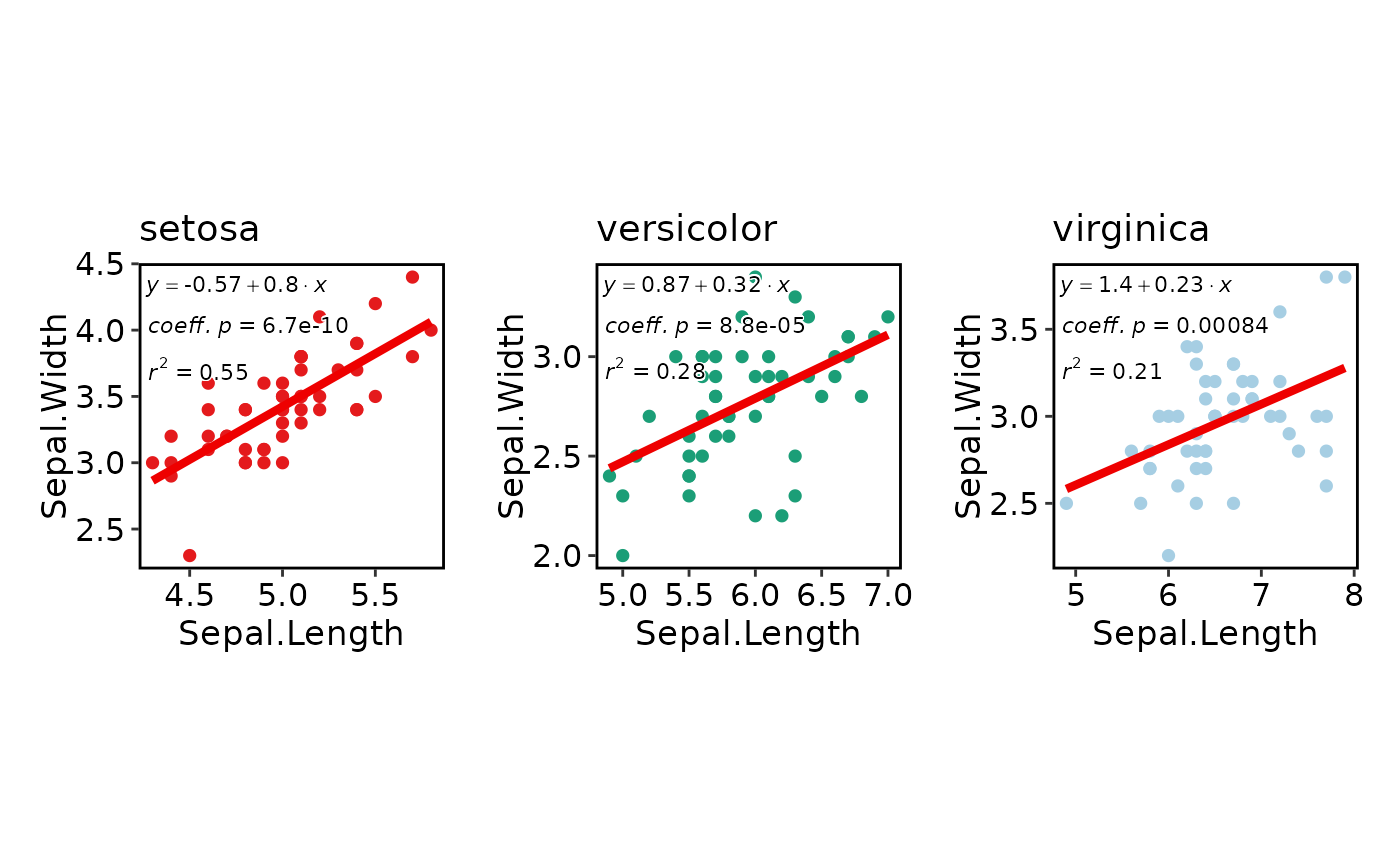
 # Per-split palettes
CorPlot(iris, "Sepal.Length", "Sepal.Width", split_by = "Species",
palette = c(setosa = "Set1", versicolor = "Dark2", virginica = "Paired"))
# Per-split palettes
CorPlot(iris, "Sepal.Length", "Sepal.Width", split_by = "Species",
palette = c(setosa = "Set1", versicolor = "Dark2", virginica = "Paired"))
 # }
# }