Draws a stacked area plot showing how one or more groups' numeric values (or counts) accumulate across the progression of a discrete x-axis variable. Each group is rendered as a filled area stacked from baseline, making it easy to compare both individual magnitudes and the total across categories.
The function supports count aggregation (omit y to plot
observation counts per x-category), proportion scaling
(scale_y = TRUE normalises each x position to 100\
colour control, faceting, and splitting into separate sub-plots via
split_by.
Usage
AreaPlot(
  data,
  x,
  y = NULL,
  x_sep = "_",
  split_by = NULL,
  split_by_sep = "_",
  group_by = NULL,
  group_by_sep = "_",
  group_name = NULL,
  scale_y = FALSE,
  theme = "theme_this",
  theme_args = list(),
  palette = "Paired",
  palcolor = NULL,
  palreverse = FALSE,
  alpha = 1,
  facet_by = NULL,
  facet_scales = "fixed",
  facet_ncol = NULL,
  facet_nrow = NULL,
  facet_byrow = TRUE,
  x_text_angle = 0,
  aspect.ratio = 1,
  legend.position = waiver(),
  legend.direction = "vertical",
  title = NULL,
  subtitle = NULL,
  xlab = NULL,
  ylab = NULL,
  keep_na = FALSE,
  keep_empty = FALSE,
  seed = 8525,
  combine = TRUE,
  nrow = NULL,
  ncol = NULL,
  byrow = TRUE,
  axes = NULL,
  axis_titles = axes,
  guides = NULL,
  design = NULL,
  ...
)
Arguments
- data
A data frame.
- x
A character string specifying the column name of the data frame to plot for the x-axis.
- y
A character string specifying the column name of the data frame to plot for the y-axis.
- x_sep
A character string used to join multiple
xcolumns. Default"_". Ignored whenxis a single column.- split_by
The column(s) to split the data by and produce separate sub-plots. Multiple columns are concatenated with
split_by_sep.- split_by_sep
A character string to separate concatenated
split_bycolumns. Default"_".- group_by
Columns to group the data for plotting For those plotting functions that do not support multiple groups, They will be concatenated into one column, using
group_by_sepas the separator- group_by_sep
The separator for multiple group_by columns. See
group_by- group_name
A character string used as the fill legend title. When
NULL, thegroup_bycolumn name is used.- scale_y
A logical value. When
TRUE, y-values are scaled to proportions within each (x,facet_by) group so that each x position stacks to 1.0. The y-axis labels switch from numeric to percent format automatically.- theme
A character string or a theme class (i.e. ggplot2::theme_classic) specifying the theme to use. Default is "theme_this".
- theme_args
A list of arguments to pass to the theme function.
- palette
A character string specifying the palette to use. A named list or vector can be used to specify the palettes for different
split_byvalues.- palcolor
A character string specifying the color to use in the palette. A named list can be used to specify the colors for different
split_byvalues. If some values are missing, the values from the palette will be used (palcolor will be NULL for those values).- palreverse
A logical value indicating whether to reverse the palette. Default is FALSE.
- alpha
A numeric value specifying the transparency of the plot.
- facet_by
A character string specifying the column name of the data frame to facet the plot. Otherwise, the data will be split by
split_byand generate multiple plots and combine them into one usingpatchwork::wrap_plots- facet_scales
Whether to scale the axes of facets. Default is "fixed" Other options are "free", "free_x", "free_y". See
ggplot2::facet_wrap- facet_ncol
A numeric value specifying the number of columns in the facet. When facet_by is a single column and facet_wrap is used.
- facet_nrow
A numeric value specifying the number of rows in the facet. When facet_by is a single column and facet_wrap is used.
- facet_byrow
A logical value indicating whether to fill the plots by row. Default is TRUE.
- x_text_angle
A numeric value specifying the angle of the x-axis text.
- aspect.ratio
A numeric value specifying the aspect ratio of the plot.
- legend.position
A character string specifying the position of the legend. if
waiver(), for single groups, the legend will be "none", otherwise "right".- legend.direction
A character string specifying the direction of the legend.
- title
A character string specifying the title of the plot. A function can be used to generate the title based on the default title. This is useful when split_by is used and the title needs to be dynamic.
- subtitle
A character string specifying the subtitle of the plot.
- xlab
A character string specifying the x-axis label.
- ylab
A character string specifying the y-axis label.
- keep_na
A logical value or a character to replace the NA values in the data. It can also take a named list to specify different behavior for different columns. If TRUE or NA, NA values will be replaced with NA. If FALSE, NA values will be removed from the data before plotting. If a character string is provided, NA values will be replaced with the provided string. If a named vector/list is provided, the names should be the column names to apply the behavior to, and the values should be one of TRUE, FALSE, or a character string. Without a named vector/list, the behavior applies to categorical/character columns used on the plot, for example, the
x,group_by,fill_by, etc.- keep_empty
One of FALSE, TRUE and "level". It can also take a named list to specify different behavior for different columns. Without a named list, the behavior applies to the categorical/character columns used on the plot, for example, the
x,group_by,fill_by, etc.FALSE(default): Drop empty factor levels from the data before plotting.TRUE: Keep empty factor levels and show them as a separate category in the plot."level": Keep empty factor levels, but do not show them in the plot. But they will be assigned colors from the palette to maintain consistency across multiple plots. Alias:levels
- seed
A numeric seed for reproducibility. Passed to
validate_common_args().- combine
Logical; when
TRUE(default), returns a combinedpatchworkobject. WhenFALSE, returns a named list of individualggplotobjects.- ncol, nrow
Integer number of columns / rows for the combined layout (passed to
wrap_plots).- byrow
Logical; fill the combined layout by row. Default
TRUE(passed towrap_plots).- axes
A character string specifying how axes should be treated across the combined layout (passed to
wrap_plots).- axis_titles
A character string specifying how axis titles should be treated across the combined layout. Defaults to
axes.- guides
A character string specifying how guides (legends) should be collected across panels. Default
"collect"(passed tocombine_plots()).- design
A custom layout design for the combined plot (passed to
combine_plots()).- ...
Additional arguments.
Value
A ggplot object, a patchwork object, or a named list
of ggplot objects (when combine = FALSE), each with
height and width attributes in inches.
split_by workflow
When split_by is provided:
check_keep_na()andcheck_keep_empty()normalise thekeep_na/keep_emptyarguments for all columns (x,split_by,group_by,facet_by).The
split_bycolumn is validated and its NA / empty levels are processed viaprocess_keep_na_empty(). It is then removed from the per-columnkeep_na/keep_emptylists.The data frame is split by
split_by(preserving level order). Ifsplit_byisNULL, the data is wrapped in a single-element list with name"...".Per-split
palette,palcolor,legend.position, andlegend.directionare resolved viacheck_palette(),check_palcolor(), andcheck_legend().AreaPlotAtomic()is called for each split. Iftitleis a function, it receives the split level name and can generate dynamic titles.Results are combined via
combine_plots()(whencombine = TRUE) or returned as a named list.
Examples
# \donttest{
set.seed(8525)
data <- data.frame(
x = rep(c("A", "B", "C", "D"), 2),
y = c(1, 3, 6, 4, 2, 5, 7, 8),
group = rep(c("F1", "F2"), each = 4),
split = rep(c("X", "Y"), 4)
)
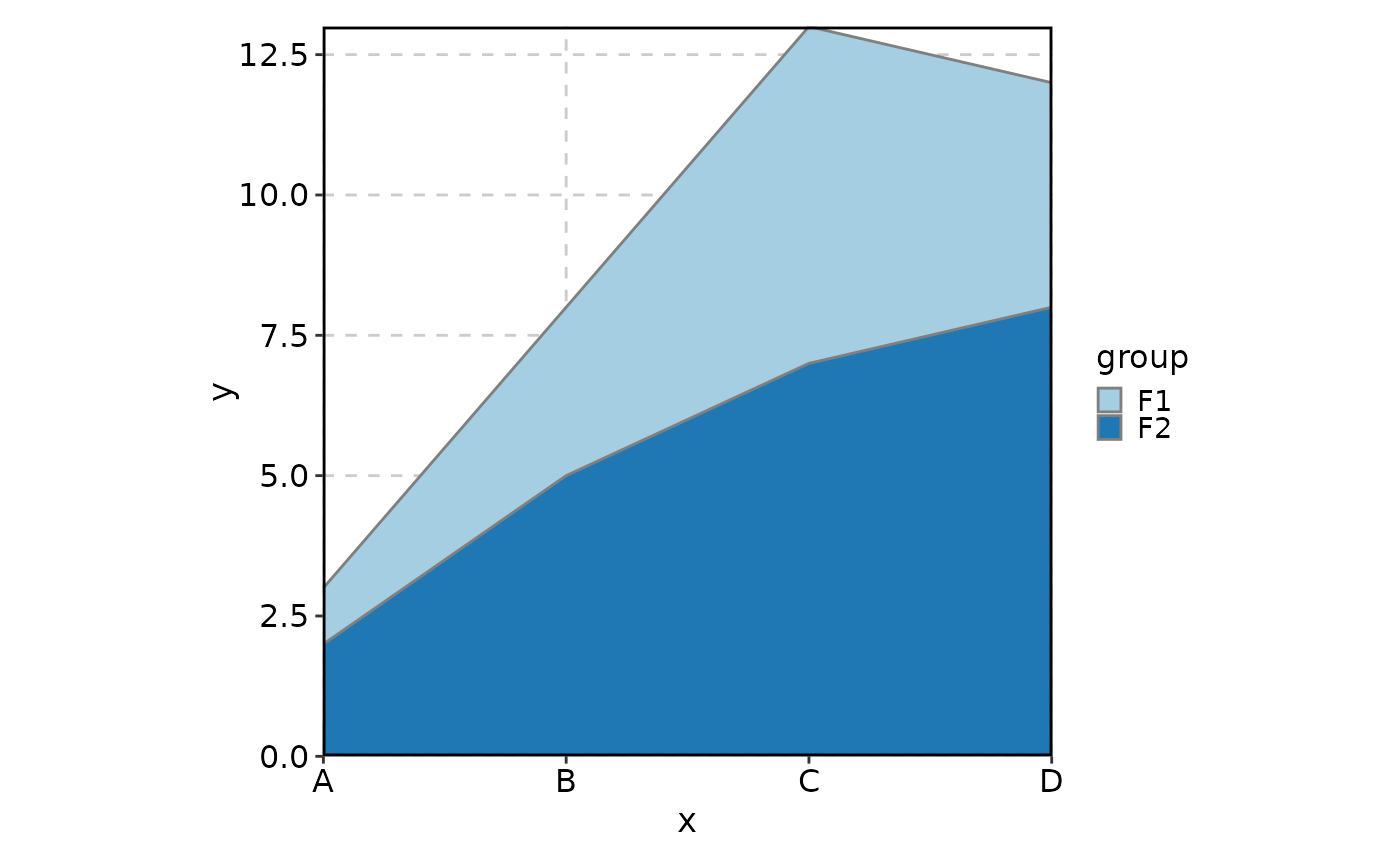
# Basic stacked area
AreaPlot(data, x = "x", y = "y", group_by = "group")
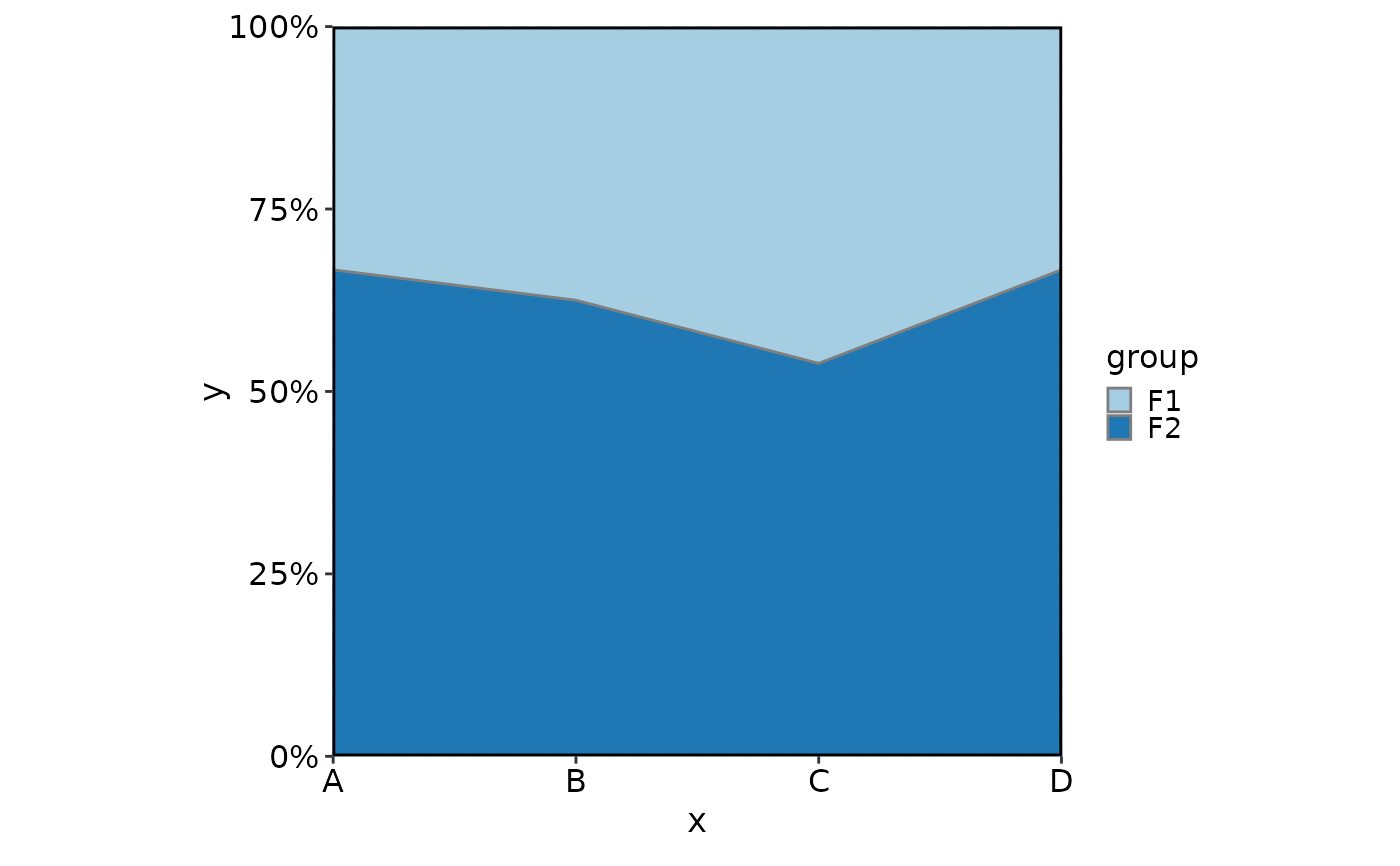
 # Scaled to proportions
AreaPlot(data, x = "x", y = "y", group_by = "group",
scale_y = TRUE)
# Scaled to proportions
AreaPlot(data, x = "x", y = "y", group_by = "group",
scale_y = TRUE)
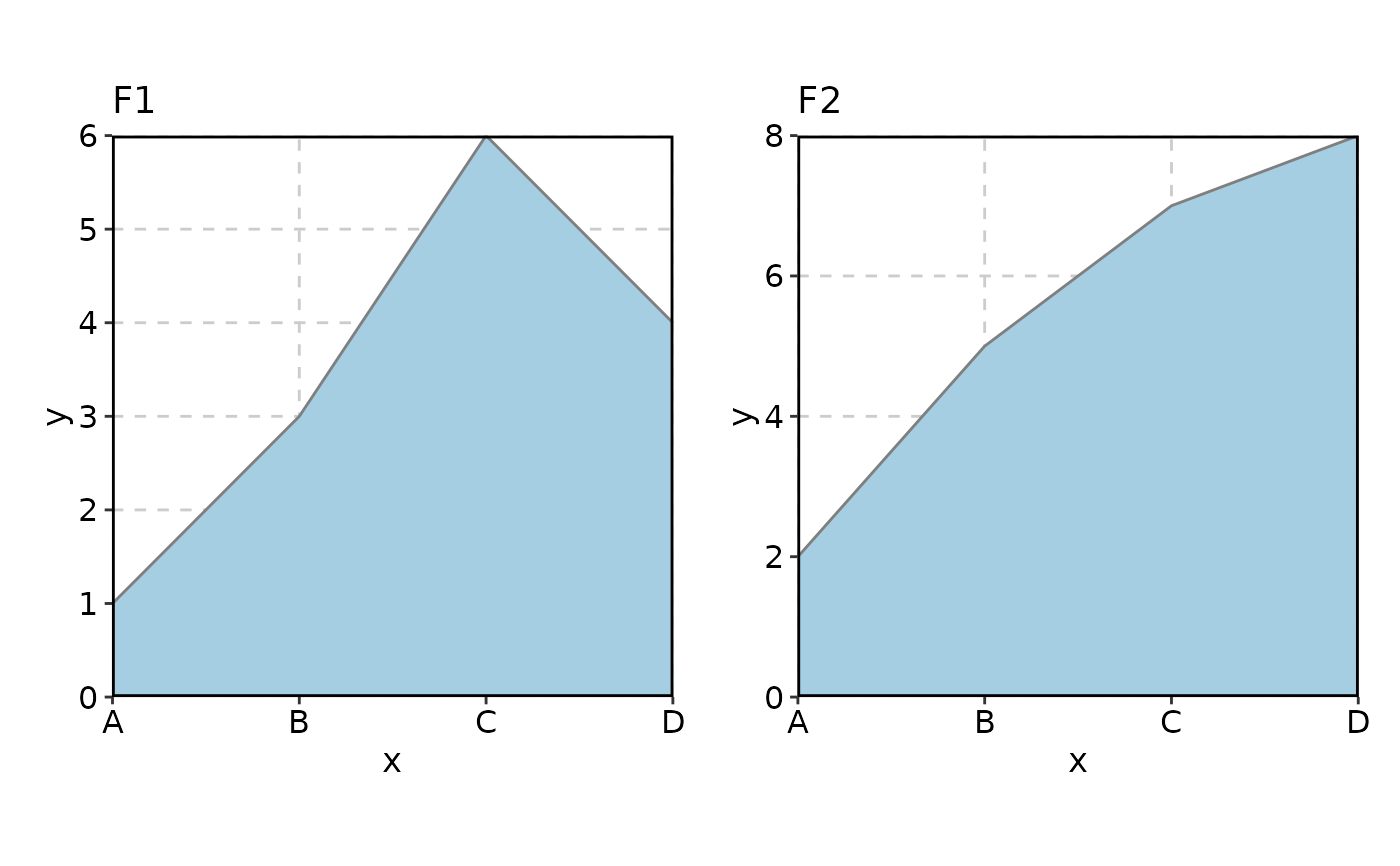
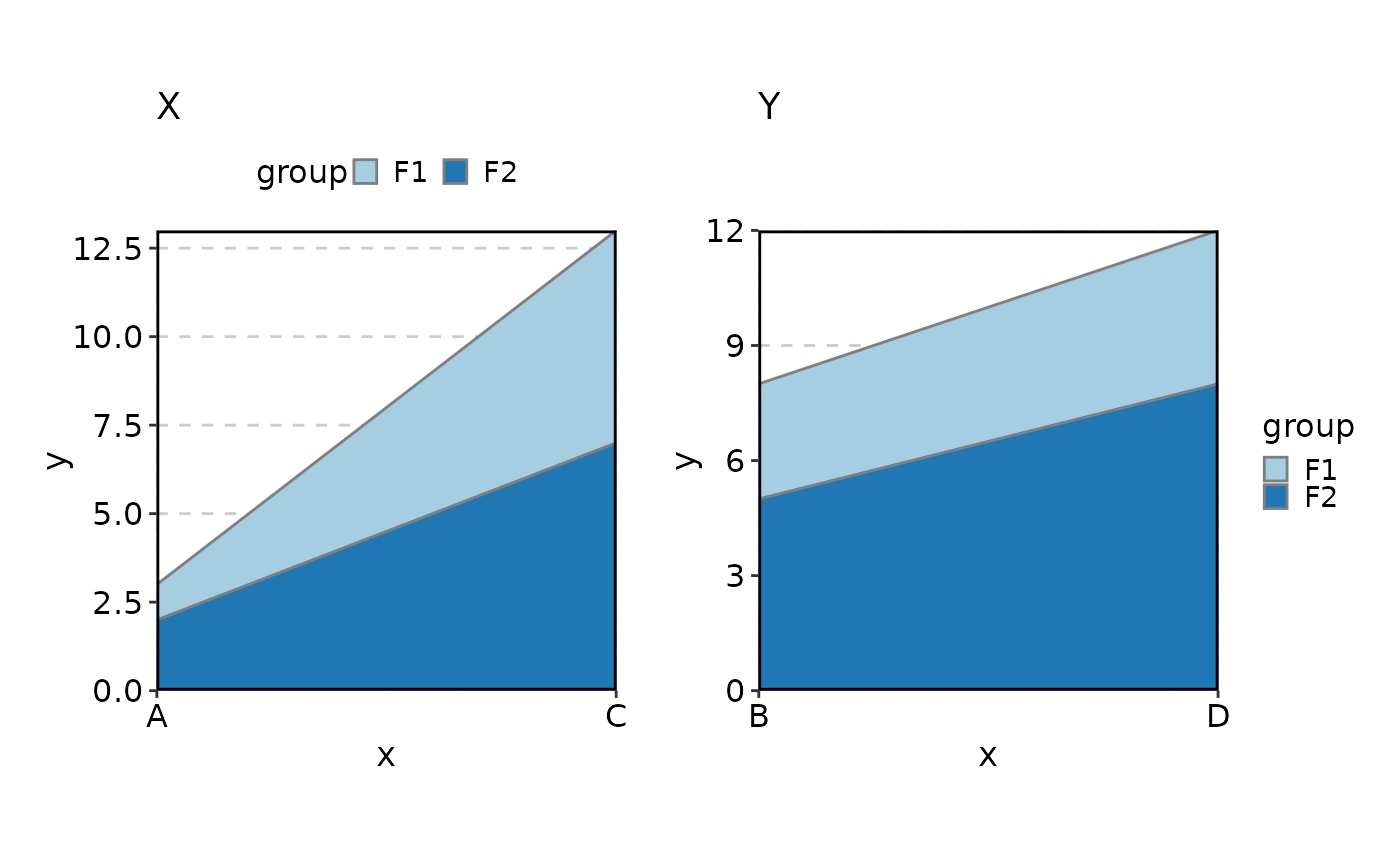
 # Split into sub-plots (no group_by — single-colour fill)
AreaPlot(data, x = "x", y = "y", split_by = "group")
# Split into sub-plots (no group_by — single-colour fill)
AreaPlot(data, x = "x", y = "y", split_by = "group")
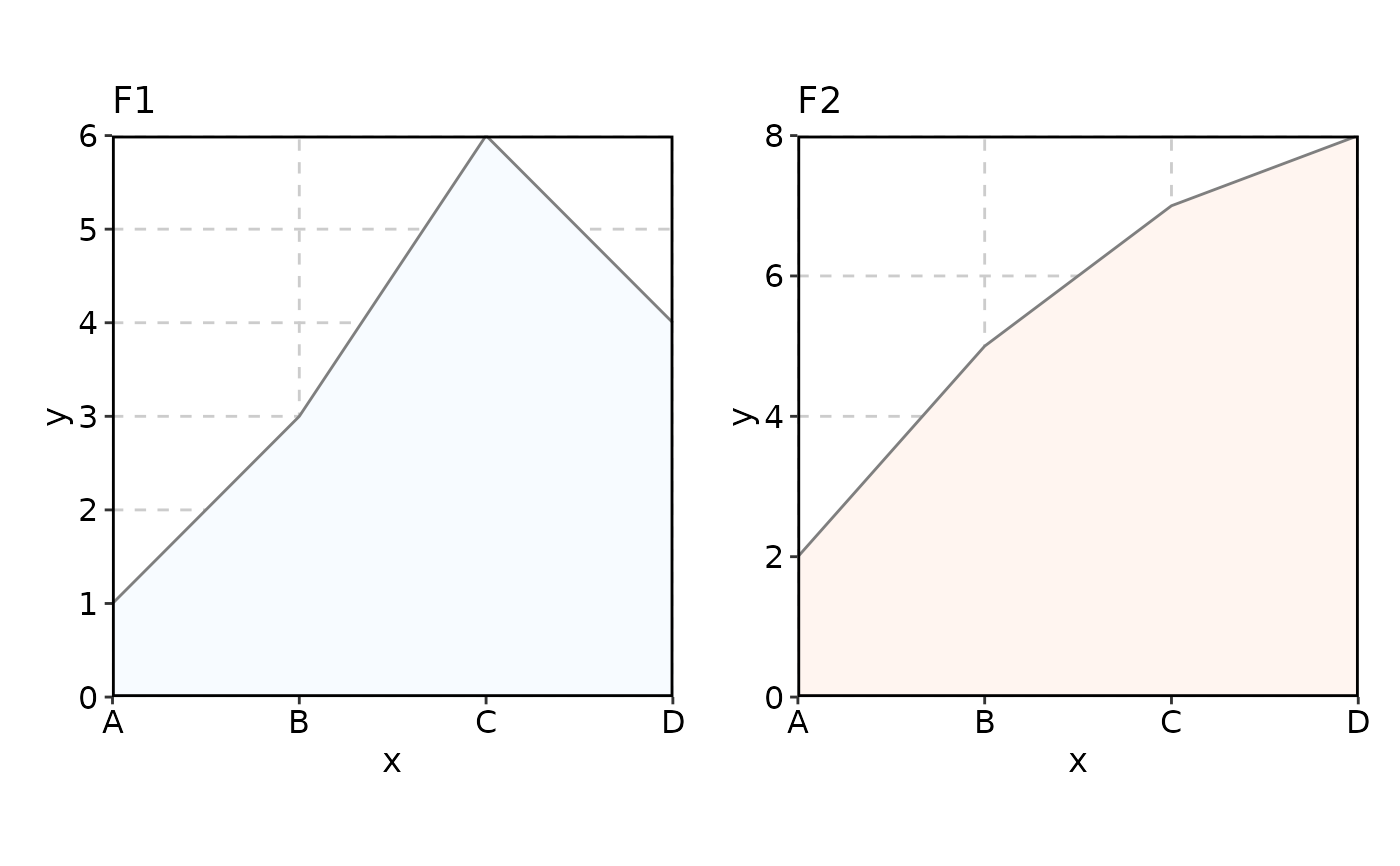
 # Per-split palettes
AreaPlot(data, x = "x", y = "y", split_by = "group",
palette = c(F1 = "Blues", F2 = "Reds"))
# Per-split palettes
AreaPlot(data, x = "x", y = "y", split_by = "group",
palette = c(F1 = "Blues", F2 = "Reds"))
 # Per-split legend positioning
AreaPlot(data, x = "x", y = "y", group_by = "group",
split_by = "split",
legend.direction = c(X = "horizontal", Y = "vertical"),
legend.position = c(X = "top", Y = "right"))
# Per-split legend positioning
AreaPlot(data, x = "x", y = "y", group_by = "group",
split_by = "split",
legend.direction = c(X = "horizontal", Y = "vertical"),
legend.position = c(X = "top", Y = "right"))
 # How keep_na and keep_empty work
data <- data.frame(
x = factor(rep(c("A", NA, "C", "D"), 3),
levels = c("A", "B", "C", "D")),
y = c(1, 3, 6, 4, 2, 5, 7, 8, 4, 2, 3, 5),
group = factor(sample(rep(c("F1", NA, "F3"), each = 4)),
levels = c("F1", "F2", "F3")),
split = factor(sample(rep(c("X", "Y", NA), 4)),
levels = c("X", "Y", "Z")),
facet = factor(sample(rep(c("M", "N", NA), 4)),
levels = c("M", "N", "O"))
)
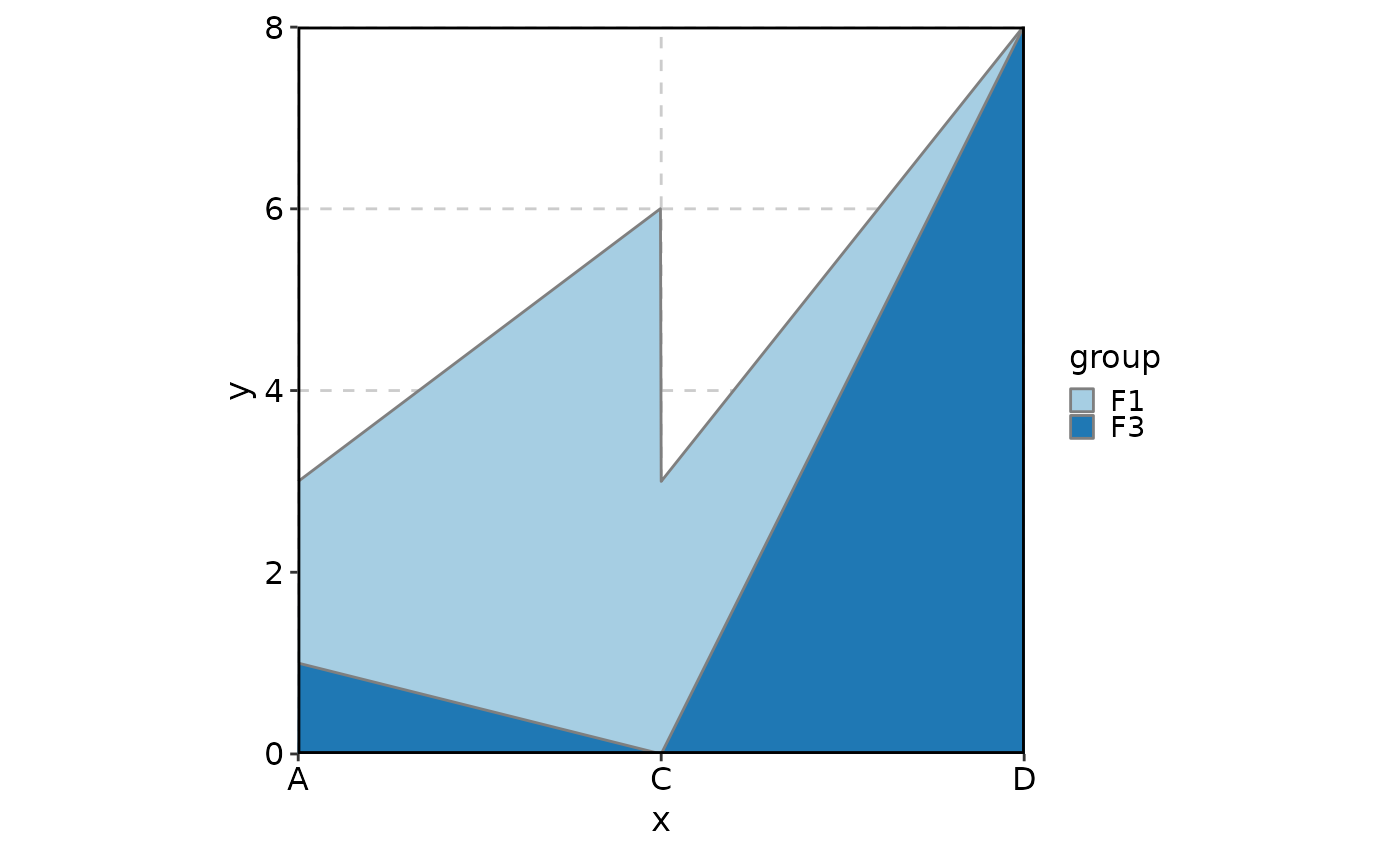
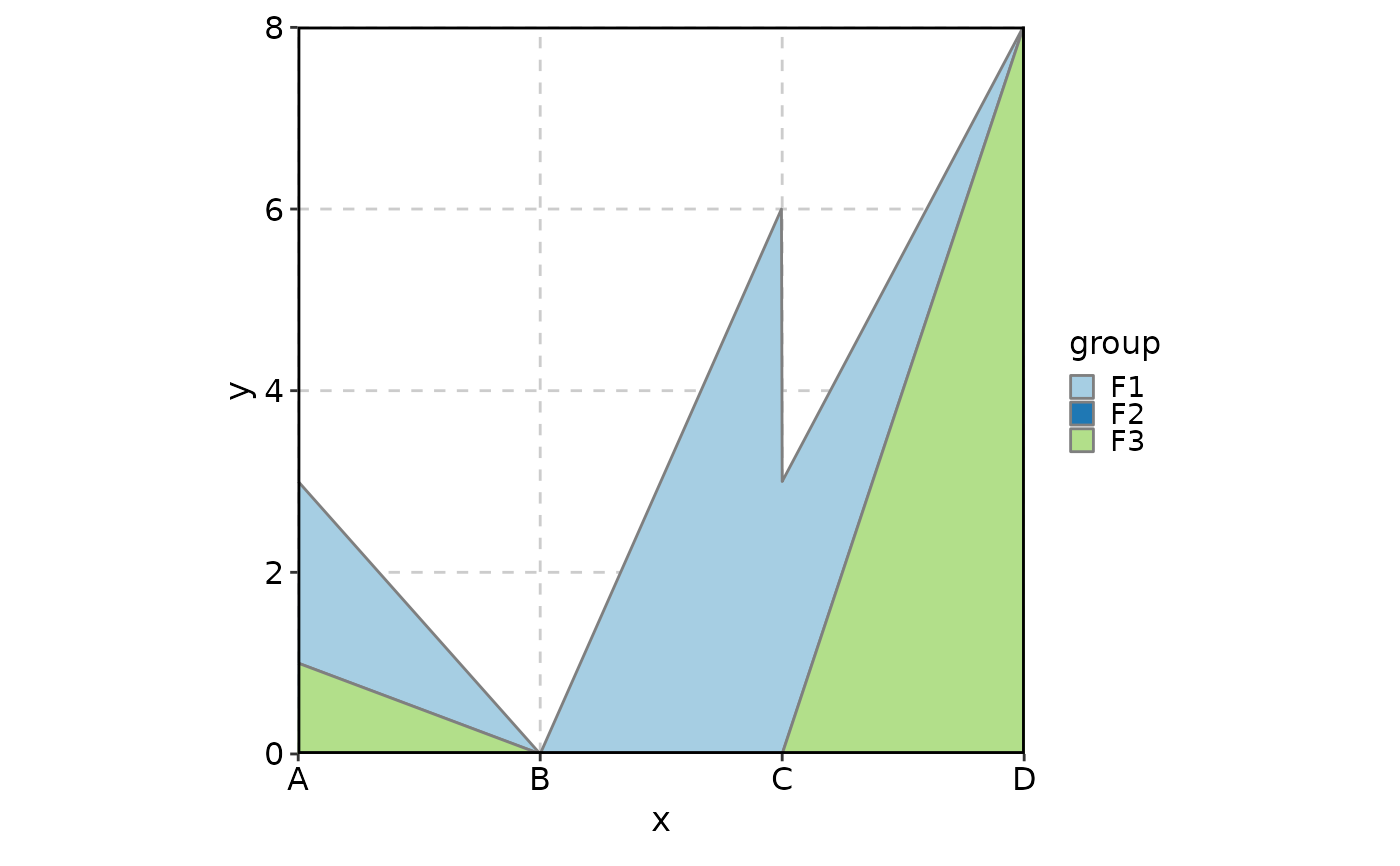
# Default: NA and empty levels dropped
AreaPlot(data, x = "x", y = "y", group_by = "group")
# How keep_na and keep_empty work
data <- data.frame(
x = factor(rep(c("A", NA, "C", "D"), 3),
levels = c("A", "B", "C", "D")),
y = c(1, 3, 6, 4, 2, 5, 7, 8, 4, 2, 3, 5),
group = factor(sample(rep(c("F1", NA, "F3"), each = 4)),
levels = c("F1", "F2", "F3")),
split = factor(sample(rep(c("X", "Y", NA), 4)),
levels = c("X", "Y", "Z")),
facet = factor(sample(rep(c("M", "N", NA), 4)),
levels = c("M", "N", "O"))
)
# Default: NA and empty levels dropped
AreaPlot(data, x = "x", y = "y", group_by = "group")
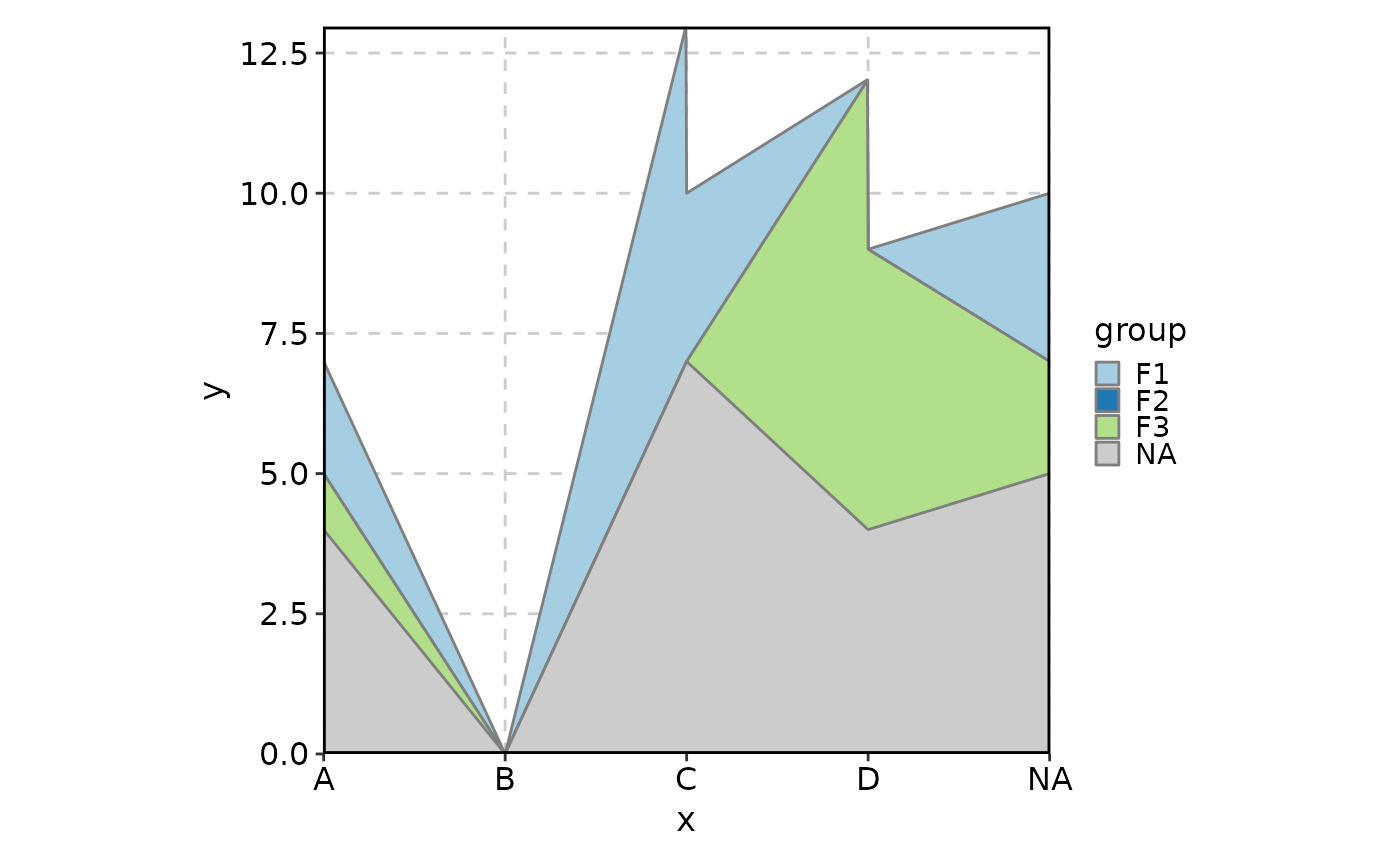
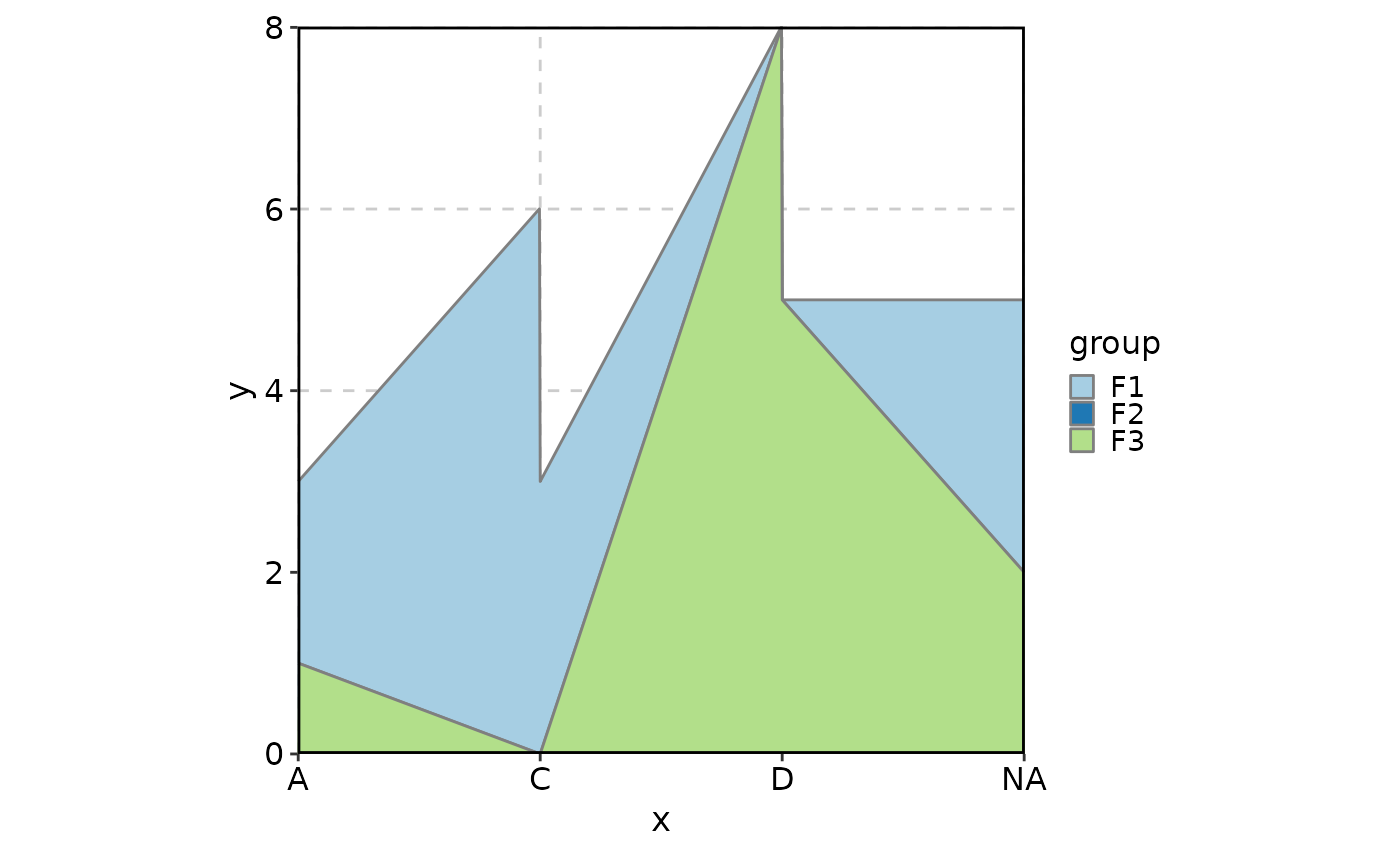
 # Keep NA and empty levels
AreaPlot(data, x = "x", y = "y", group_by = "group",
keep_na = TRUE, keep_empty = TRUE)
# Keep NA and empty levels
AreaPlot(data, x = "x", y = "y", group_by = "group",
keep_na = TRUE, keep_empty = TRUE)
 # Keep NA, assign empty levels colours but don't show them
AreaPlot(data, x = "x", y = "y", group_by = "group",
keep_na = TRUE, keep_empty = "level")
# Keep NA, assign empty levels colours but don't show them
AreaPlot(data, x = "x", y = "y", group_by = "group",
keep_na = TRUE, keep_empty = "level")
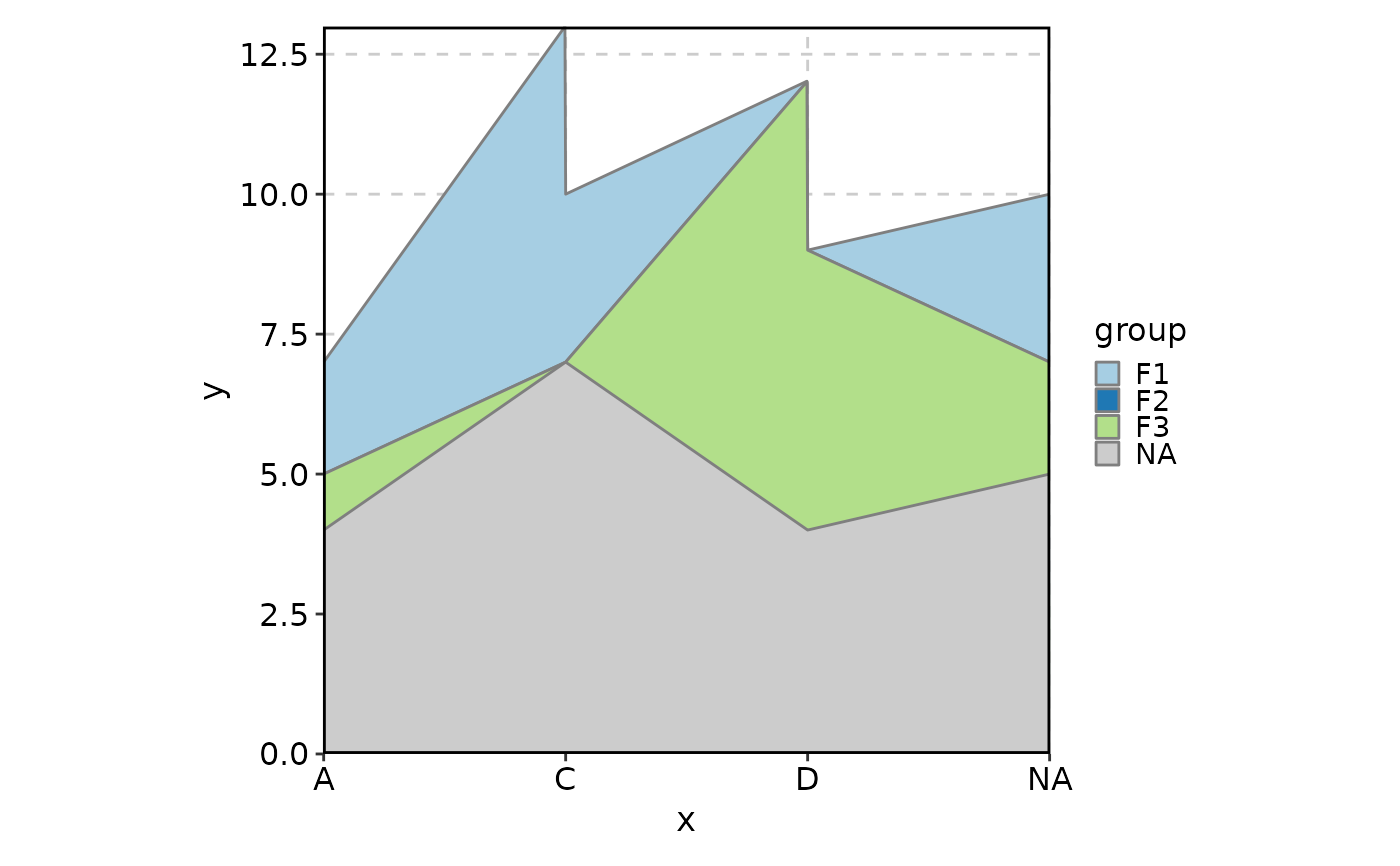 # Drop NA, keep empty levels
AreaPlot(data, x = "x", y = "y", group_by = "group",
keep_na = FALSE, keep_empty = TRUE)
# Drop NA, keep empty levels
AreaPlot(data, x = "x", y = "y", group_by = "group",
keep_na = FALSE, keep_empty = TRUE)
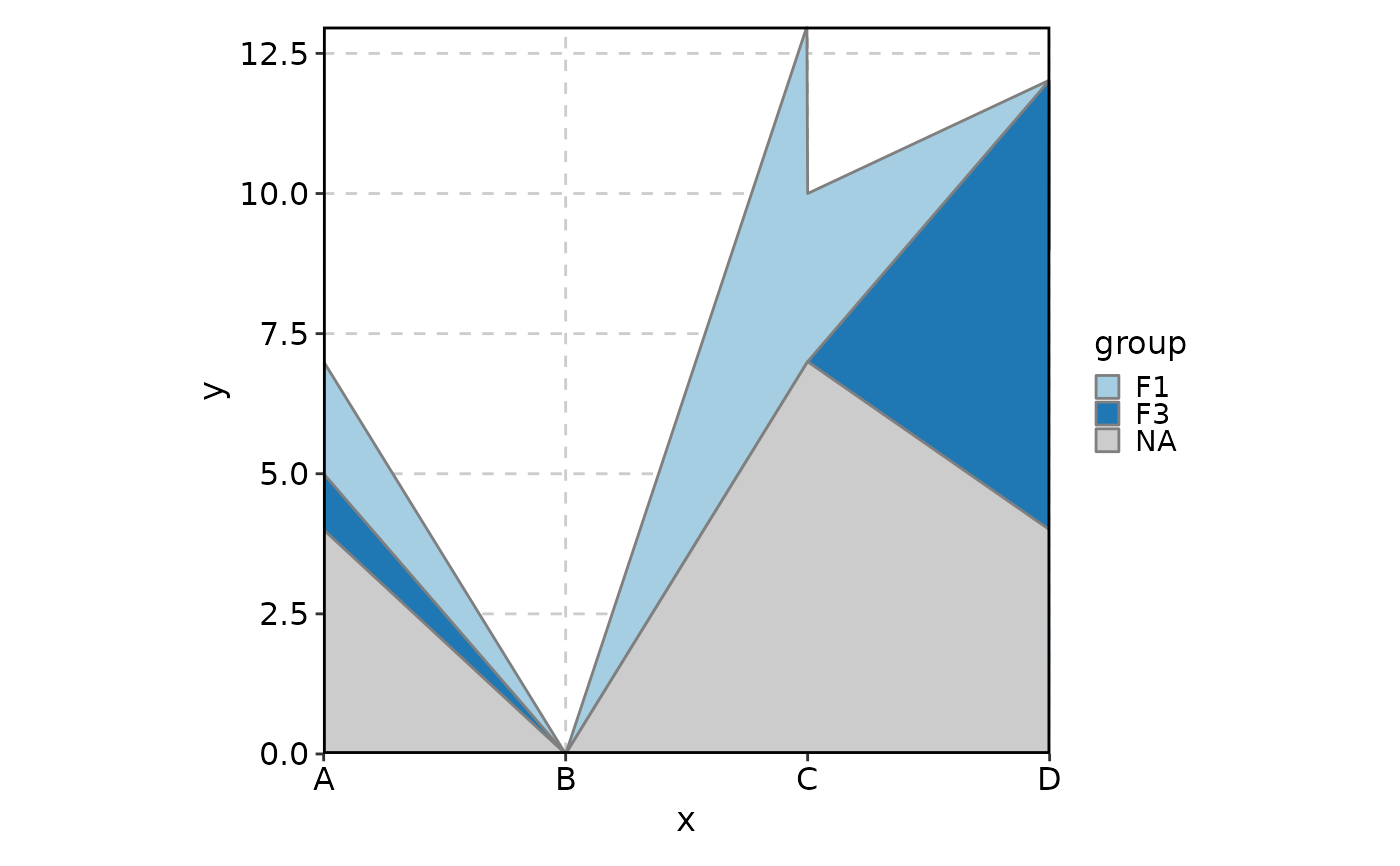
 # Per-column keep_na / keep_empty via named lists
AreaPlot(data, x = "x", y = "y", group_by = "group",
keep_na = list(x = TRUE, group = FALSE),
keep_empty = list(x = FALSE, group = TRUE))
# Per-column keep_na / keep_empty via named lists
AreaPlot(data, x = "x", y = "y", group_by = "group",
keep_na = list(x = TRUE, group = FALSE),
keep_empty = list(x = FALSE, group = TRUE))
 AreaPlot(data, x = "x", y = "y", group_by = "group",
keep_na = list(x = FALSE, group = TRUE),
keep_empty = list(x = TRUE, group = FALSE))
AreaPlot(data, x = "x", y = "y", group_by = "group",
keep_na = list(x = FALSE, group = TRUE),
keep_empty = list(x = TRUE, group = FALSE))
 # }
# }