SampleInfo
List sample information and perform statistics
This process is the entrance of the pipeline. It just pass by input file and list
the sample information in the report.
To specify the input file in the configuration file, use the following
[SampleInfo.in]
infile = [ "path/to/sample_info.txt" ]
Or with pipen-board, find the SampleInfo process and click the Edit button.
Then you can specify the input file here

Multiple input files are supported by the underlying pipeline framework. However,
we recommend to run it with a different pipeline instance with configuration files.
For the content of the input file, please see details
here.
You can add some columns to the input file while doing the statistics or you can
even pass them on to the next processes. See envs.mutaters and
envs.save_mutated.
But if you are adding a factor (categorical) column with desired levels, the order
can't be guaranteed, because we are saving them to a text file, where we can't
guarantee the order of the levels. If you want to add a factor column with desired
levels, you can set envs.mutaters of the SeuratPreparing process to mutate the
column.
Once the pipeline is finished, you can see the sample information in the report

Note that the required RNAData (if not loaded from a Seurat object) and
TCRData/BCRData columns are not shown in the report.
They are used to specify the paths of the scRNA-seq and scTCR-seq/scBCR-seq
data, respectively.
Also note that when RNAData is loaded from a Seurat object (specified in the
LoadingRNAFromSeurat process), the metadata provided in this process will not be
integrated into the Seurat object in the downstream processes. To incoporate
these meta information into the Seurat object, please provide them in the
Seurat object itself or use the envs.mutaters of the SeuratPreparing process
to mutate the metadata of the Seurat object. But the meta information provided in
this process can still be used in the statistics and plots in the report.
You may also perform some statistics on the sample information, for example,
number of samples per group. See next section for details.
Tip
This is the start process of the pipeline. Once you change the parameters for
this process, the whole pipeline will be re-run.
If you just want to change the parameters for the statistics, and use the
cached (previous) results for other processes, you can set cache at
pipeline level to "force" to force the pipeline to use the cached results
and cache of SampleInfo to false to force the pipeline to re-run the
SampleInfo process only.
cache = "force"

[SampleInfo]
cache = false
Input
infile(required): The input file to list sample information The input file should be a csv/tsv file with header.
Required whenLoadingRNAFromSeuratis not used in the pipeline. This is optional ifLoadingRNAFromSeuratis used in the pipeline and no VDJ data is provided. The input file should have the following columns.- Sample: A unique id for each sample.
- TCRData/BCRData: The directory for single-cell TCR/BCR data for this
sample.
Specifically, it should contain filtered_contig_annotations.csv or all_contig_annotations.csv from cellranger. - RNAData: The directory for single-cell RNA data for this sample.
Specifically, it should be able to be read bySeurat::Read10X()orSeurat::Read10X_h5()orSeuratDisk::LoadLoom().
See also https://satijalab.org/seurat/reference/read10x. - Other columns are optional and will be treated as metadata for
each sample.
- Sample: A unique id for each sample.
Output
outfile: Default:{{in.infile | basename}}.
The output file with sample information, with mutated columns ifenvs.save_mutatedis True.
The basename of the output file will be the same as the input file.
The file name of each plot will be slugified from the case name.
Each plot has 3 formats: pdf, png and code.zip, which contains the data and R code to reproduce the plot.
Environment Variables
sep: Default:.
The separator of the input file.mutaters(type=json): Default:{}.
A dict of mutaters to mutate the data frame.
The key is the column name and the value is the R expression to mutate the column. The dict will be transformed to a list in R and passed todplyr::mutate.
You may also usepaired()to identify paired samples. The function takes following arguments:df: The data frame. Use.if the function is called in a dplyr pipe.id_col: The column name indffor the ids to be returned in the final output.compare_col: The column name indfto compare the values for each id inid_col.idents: The values incompare_colto compare. It could be either an an integer or a vector. If it is an integer, the number of values incompare_colmust be the same as the integer for theidto be regarded as paired. If it is a vector, the values incompare_colmust be the same as the values inidentsfor theidto be regarded as paired.uniq: Whether to return unique ids or not. Default isTRUE.
IfFALSE, you can mutate the meta data frame with the returned ids. Non-paired ids will beNA.
save_mutated(flag): Default:False.
Whether to save the mutated columns.exclude_cols(auto): Default:TCRData,BCRData,RNAData.
The columns to exclude in the table in the report.
Could be a list or a string separated by comma.defaults(ns): The default parameters forenvs.stats.plot_type: Default:bar.
The type of the plot.
See the supported plot types here:
https://pwwang.github.io/plotthis/reference/index.html The plot_type should be lower case and the plot function used inplotthisshould be used. The mapping from plot_type to the plot function is likebar -> BarPlot,box -> BoxPlot, etc.more_formats(list): Default:[].
The additional formats to save the plot.
By default, the plot will be saved in png, which is also used to display in the report. You can add more formats to save the plot.
For example,more_formats = ["pdf", "svg"].save_code(flag): Default:False.
Whether to save the R code to reproduce the plot.
The data used to plot will also be saved.subset: An expression to subset the data frame before plotting.
The expression should be a string of R expression that will be passed todplyr::filter. For example,subset = "Sample == 'A'".section: The section name in the report.
In case you want to group the plots in the report.devpars(ns): The device parameters for the plot.width(type=int): The width of the plot.height(type=int): The height of the plot.res(type=int): Default:100.
The resolution of the plot.
descr: The description of the plot, shown in the report.<more>: You can add more parameters to the defaults.
These parameters will be expanded to theenvs.statsfor each case, and passed to individual plot functions.
stats(type=json): Default:{}.
The statistics to perform.
The keys are the case names and the values are the parameters inheirted fromenvs.defaults.
Examples
Example data
| Sample | Age | Sex | Diagnosis |
|---|---|---|---|
| C1 | 62 | F | Colitis |
| C2 | 71.2 | F | Colitis |
| C3 | 56.2 | M | Colitis |
| C4 | 61.5 | M | Colitis |
| C5 | 72.8 | M | Colitis |
| C6 | 78.4 | M | Colitis |
| C7 | 61.6 | F | Colitis |
| C8 | 49.5 | F | Colitis |
| NC1 | 43.6 | M | NoColitis |
| NC2 | 68.1 | M | NoColitis |
| NC3 | 70.5 | F | NoColitis |
| NC4 | 63.7 | M | NoColitis |
| NC5 | 58.5 | M | NoColitis |
| NC6 | 49.3 | F | NoColitis |
| CT1 | 21.4 | F | Control |
| CT2 | 61.7 | M | Control |
| CT3 | 50.5 | M | Control |
| CT4 | 43.4 | M | Control |
| CT5 | 70.6 | F | Control |
| CT6 | 44.3 | M | Control |
| CT7 | 50.2 | M | Control |
| CT8 | 61.5 | F | Control |
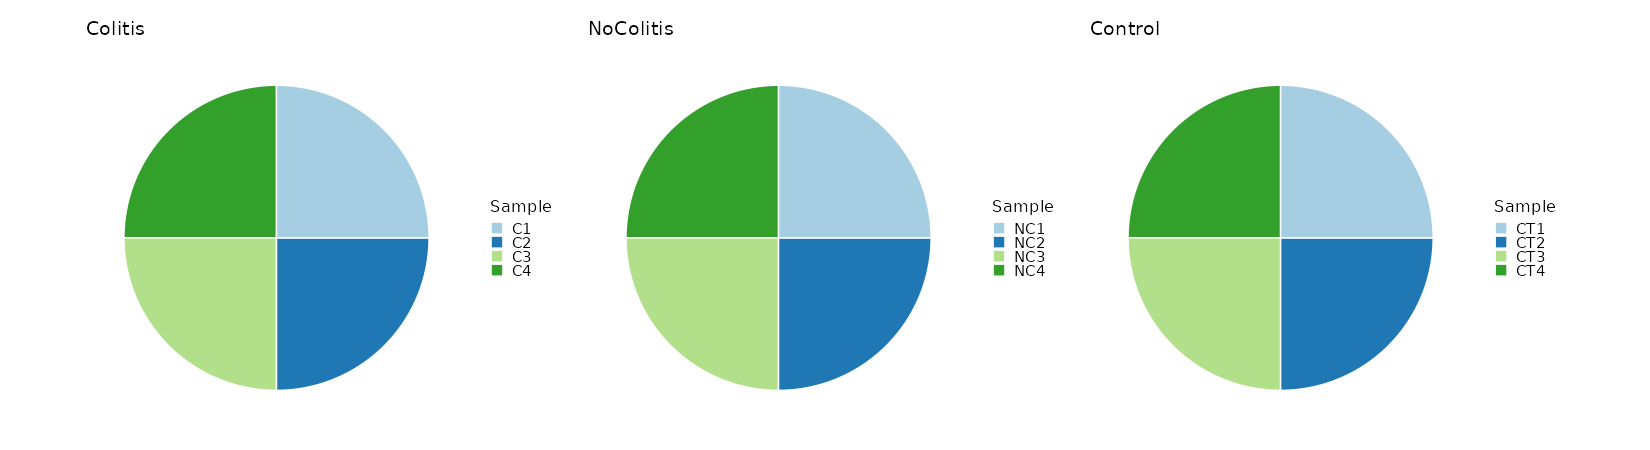
Count the number of samples per Diagnosis
[SampleInfo.envs.stats."N_Samples_per_Diagnosis (pie)"]
plot_type = "pie"
x = "sample"
split_by = "Diagnosis"
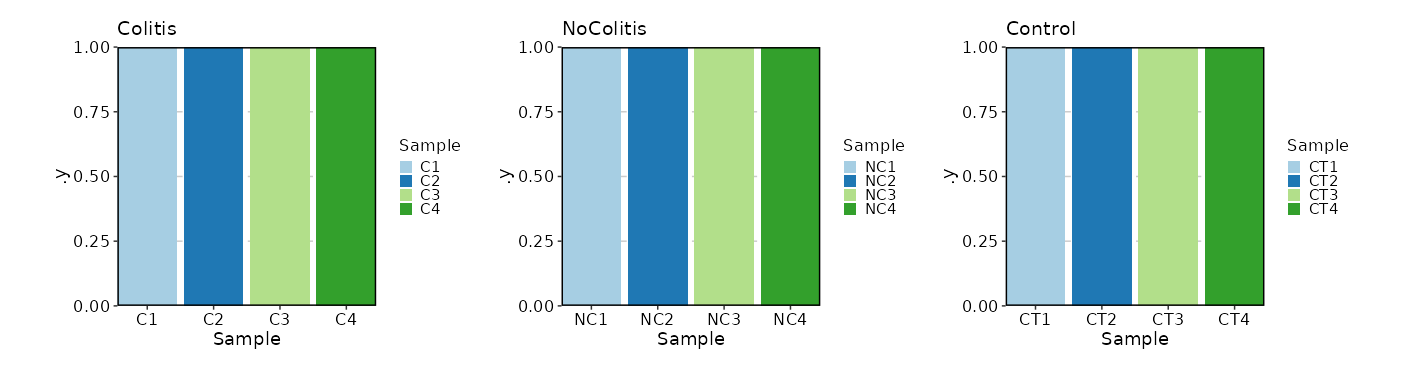
What if we want a bar plot instead of a pie chart?
[SampleInfo.envs.stats."N_Samples_per_Diagnosis (bar)"]
plot_type = "bar"
x = "Sample"
split_by = "Diagnosis"
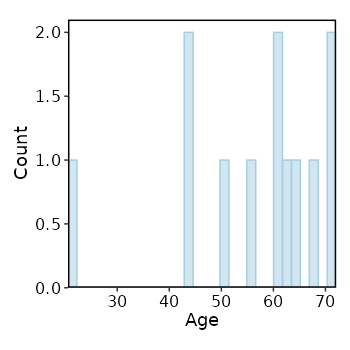
Explore Age distribution
The distribution of Age of all samples
[SampleInfo.envs.stats."Age_distribution (histogram)"]
plot_type = "histogram"
x = "Age"
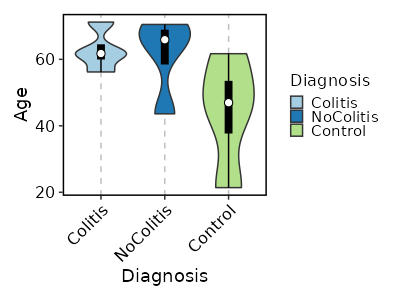
How about the distribution of Age in each Diagnosis, and make it
violin + boxplot?
[SampleInfo.envs.stats."Age_distribution_per_Diagnosis (violin + boxplot)"]
y = "Age"
x = "Diagnosis"
plot_type = "violin"
add_box = true
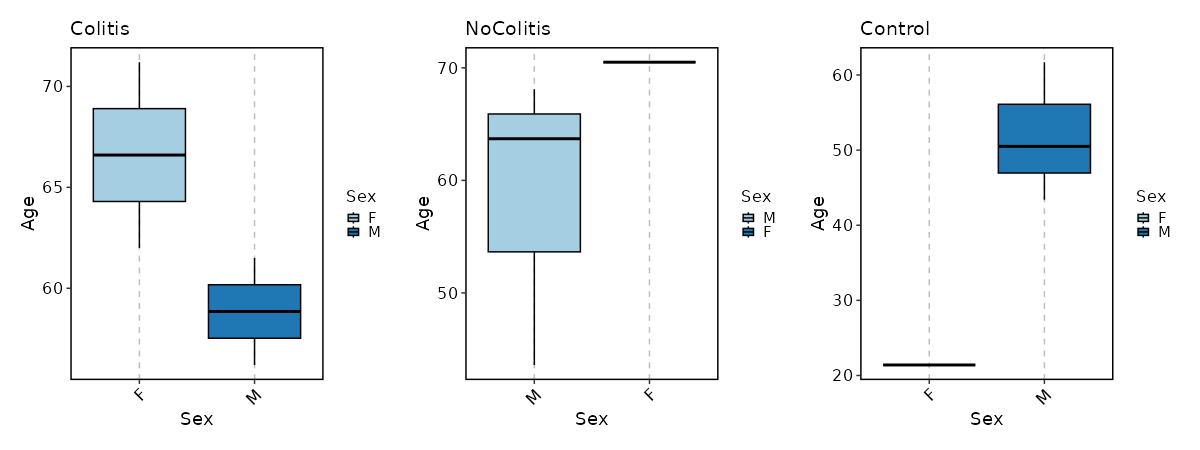
How about Age distribution per Sex in each Diagnosis?
[SampleInfo.envs.stats."Age_distribution_per_Sex_in_each_Diagnosis (boxplot)"]
y = "Age"
x = "Sex"
split_by = "Diagnosis"
plot_type = "box"
ncol = 3
devpars = {height = 450}