TOrBCellSelection
Separate T and non-T cells and select T cells; or separate B and non-B cells and select B cells.
If all of your cells are T/B cells, do not set any configurations for this process.
In such a case, SeuratClusteringOfAllCells should
not be used, and SeuratClustering will be clustering all
of the cells, which are all T/B cells.
There are two ways to separate T and non-T cells; or B and non-B cells:
- Use the an expression indicator directly from the metadata.
- Use the expression values of indicator genes, and the clonotype percentage
of the clusters.
You can also use indicator gene expression values only to select T/B cells by
setting envs.ignore_vdj to true.
Input
srtobj: Seurat object file in RDS/qs2immdata: Immune repertoire data file in RDS/qs2
Output
outfile: Default:{{in.srtobj | stem}}.qs.
Seurat object file in qs2 formatoutdir: Default:details.
Output directory with details
Environment Variables
ignore_vdj(flag): Default:False.
Ignore VDJ information for T/B cell selection.
Use only the expression values of indicator genes if True.
In this case, theClonotype_Pctcolumn does not exist in the metadata.
If you want to usek-meansto select T/B cells, you must have more than 1 indicator gene, and the first indicator gene inenvs.indicator_genesmust be a positive marker, which will be used to select the cluster with higher expression values as T/B cells.selector: The expression passed totidyseurat::mutate(is_TCell = ...)to indicate whether a cell is a T cell, or a file containing the cell barcodes regarding as T cells (beginning withfile://).
For example,Clonotype_Pct > 0.25to indicate cells with clonotype percentage > 25% are T cells.
Ifindicator_genesis provided, the expression values can also be used in the expression. For example,Clonotype_Pct > 0.25 & CD3E > 0.
Ifselectoris not provided, a kmeans clustering will be performed on the expression values ofindicator_genesandClonotype_Pct, with K=2, and the cluster with higher clonotype percentage will be selected as T/B cells.
With a file is provided, the column name of the cell barcodes can be provided after the path to the file, separated by#. For example,file://path/to/cell_barcodes.txt#cell_barcodeto indicate the cell barcodes are in the columncell_barcodeof the file.
If the column name is not provided, the file is assumed to have only one column without a header, and the cell barcodes will be read from the first column.-
indicator_genes(list): Default:['CD3E'].
A list of indicator genes whose expression values and clonotype percentage will be used to determine T/B cells.
The markers could be either positive, such asCD3E,CD3D,CD3G, or negative, such asCD19,CD14,CD68, for T cells. For B cells, markers such asCD19,MS4A1(CD20),CD79A,CD79Bcould be used. -
kmeans(type=json): Default:{'nstart': 25}.
The parameters forkmeansclustering.
Other arguments forstats::kmeanscan be provided here. If there are dots in the argument names, replace them with-.
Examples
Use T cell indicator directly
If you have a metadata like this:
| id | Clonotype_Pct | seurat_clusters |
|---|---|---|
| 1 | 0.1 | 1 |
| 2 | 0.3 | 2 |
| 3 | 0.5 | 3 |
With the configuration below:
[TOrBCellSelection.envs]
selector = "Clonotype_Pct > 0.25"
The T cells will be selected as:
| id | Clonotype_Pct | seurat_clusters | is_TCell |
|---|---|---|---|
| 1 | 0.1 | 1 | FALSE |
| 2 | 0.3 | 2 | TRUE |
| 3 | 0.5 | 3 | TRUE |
Use indicator genes
Let's say we set the indicator genes to ["CD3D", "CD3E", "CD3G"].
The mean expression values will be calculated for each cluster:
| id | Clonotype_Pct | seurat_clusters | CD3D | CD3E | CD3G |
|---|---|---|---|---|---|
| 1 | 0.1 | 1 | 0.1 | 0.0 | 0.1 |
| 2 | 0.3 | 2 | 1.2 | 1.3 | 0.6 |
| 3 | 0.5 | 3 | 1.5 | 0.8 | 0.9 |
Then a kmeans clustering will be performed on the mean expression values of
the indicator genes, together with Clonotype_Pct, with K=2.
| id | Clonotype_Pct | seurat_clusters | CD3D | CD3E | CD3G | is_TCell |
|---|---|---|---|---|---|---|
| 1 | 0.1 | 1 | 0.1 | 0.0 | 0.1 | FALSE |
| 2 | 0.3 | 2 | 1.2 | 1.3 | 0.6 | TRUE |
| 3 | 0.5 | 3 | 1.5 | 0.8 | 0.9 | TRUE |

The cluster with higher clonoype percentage will be selected as T/B cells
(is_selected = TRUE), and sent to
SeuratClustering for
further clustering and downstream analysis.
Details of the selection
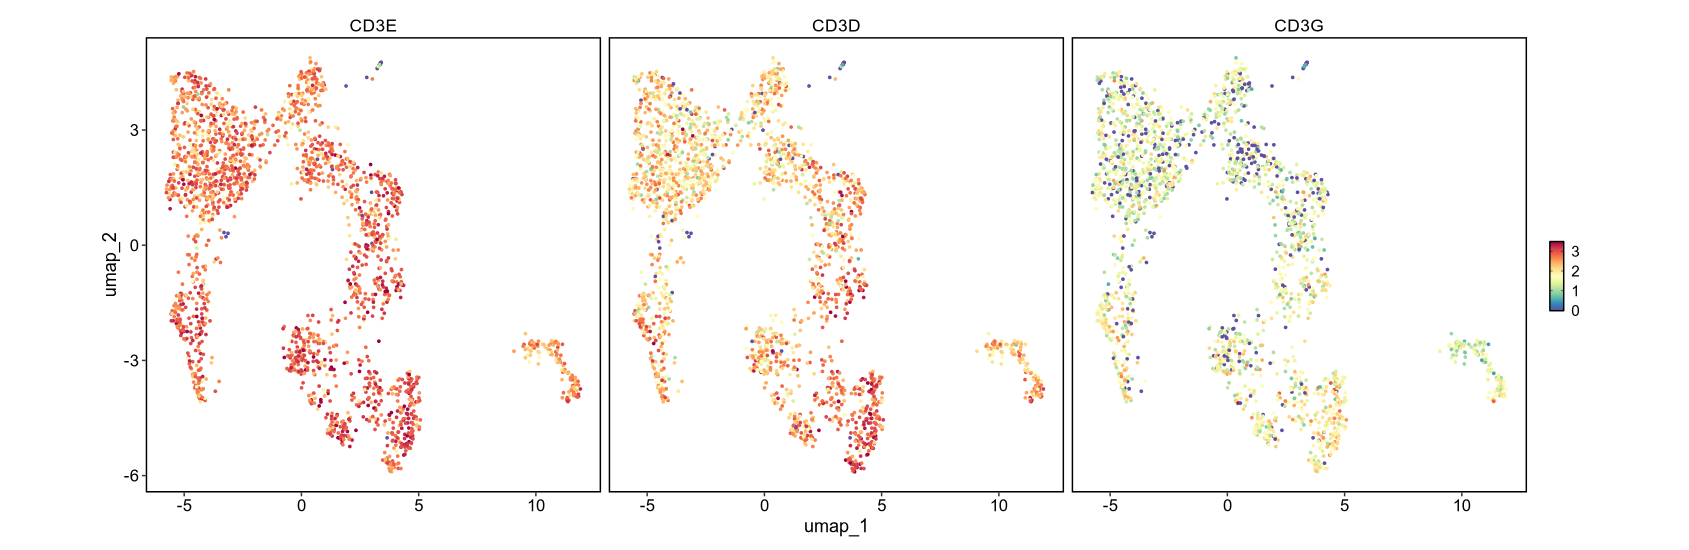
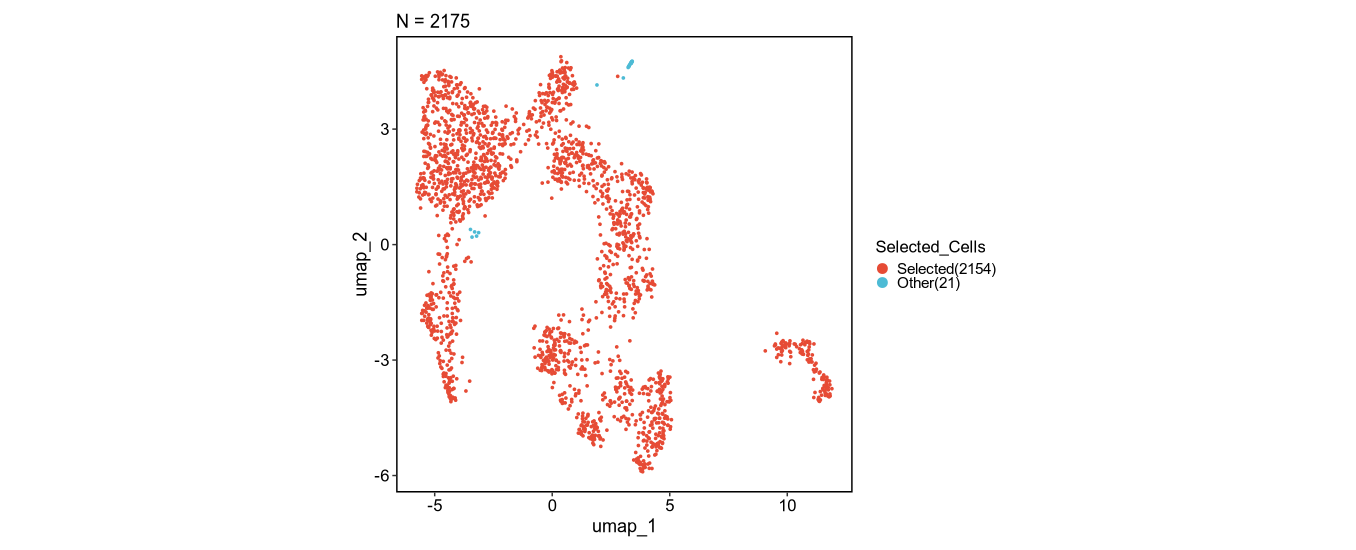
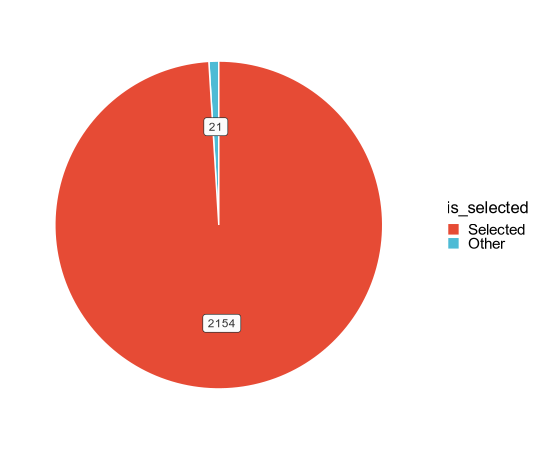
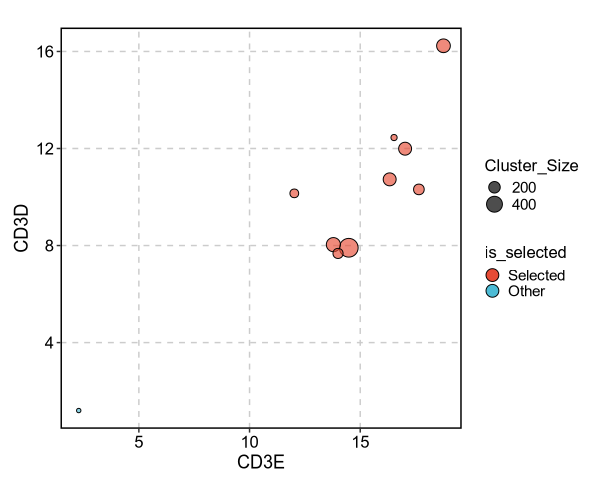
More details are saved in the details output directory, for example
the indicator gene expression plots and the selected cells:
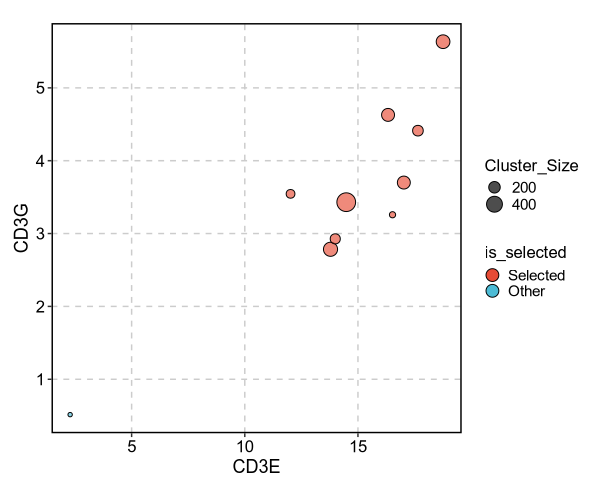
The same plots are available when the cells are selected from a file of
cell barcodes:
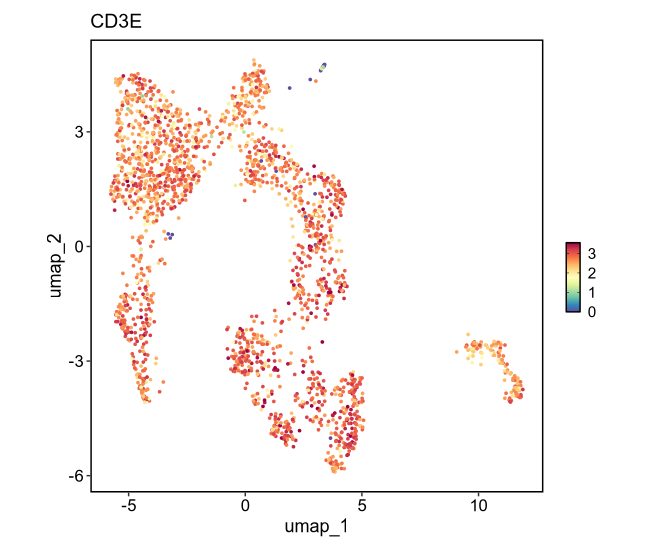
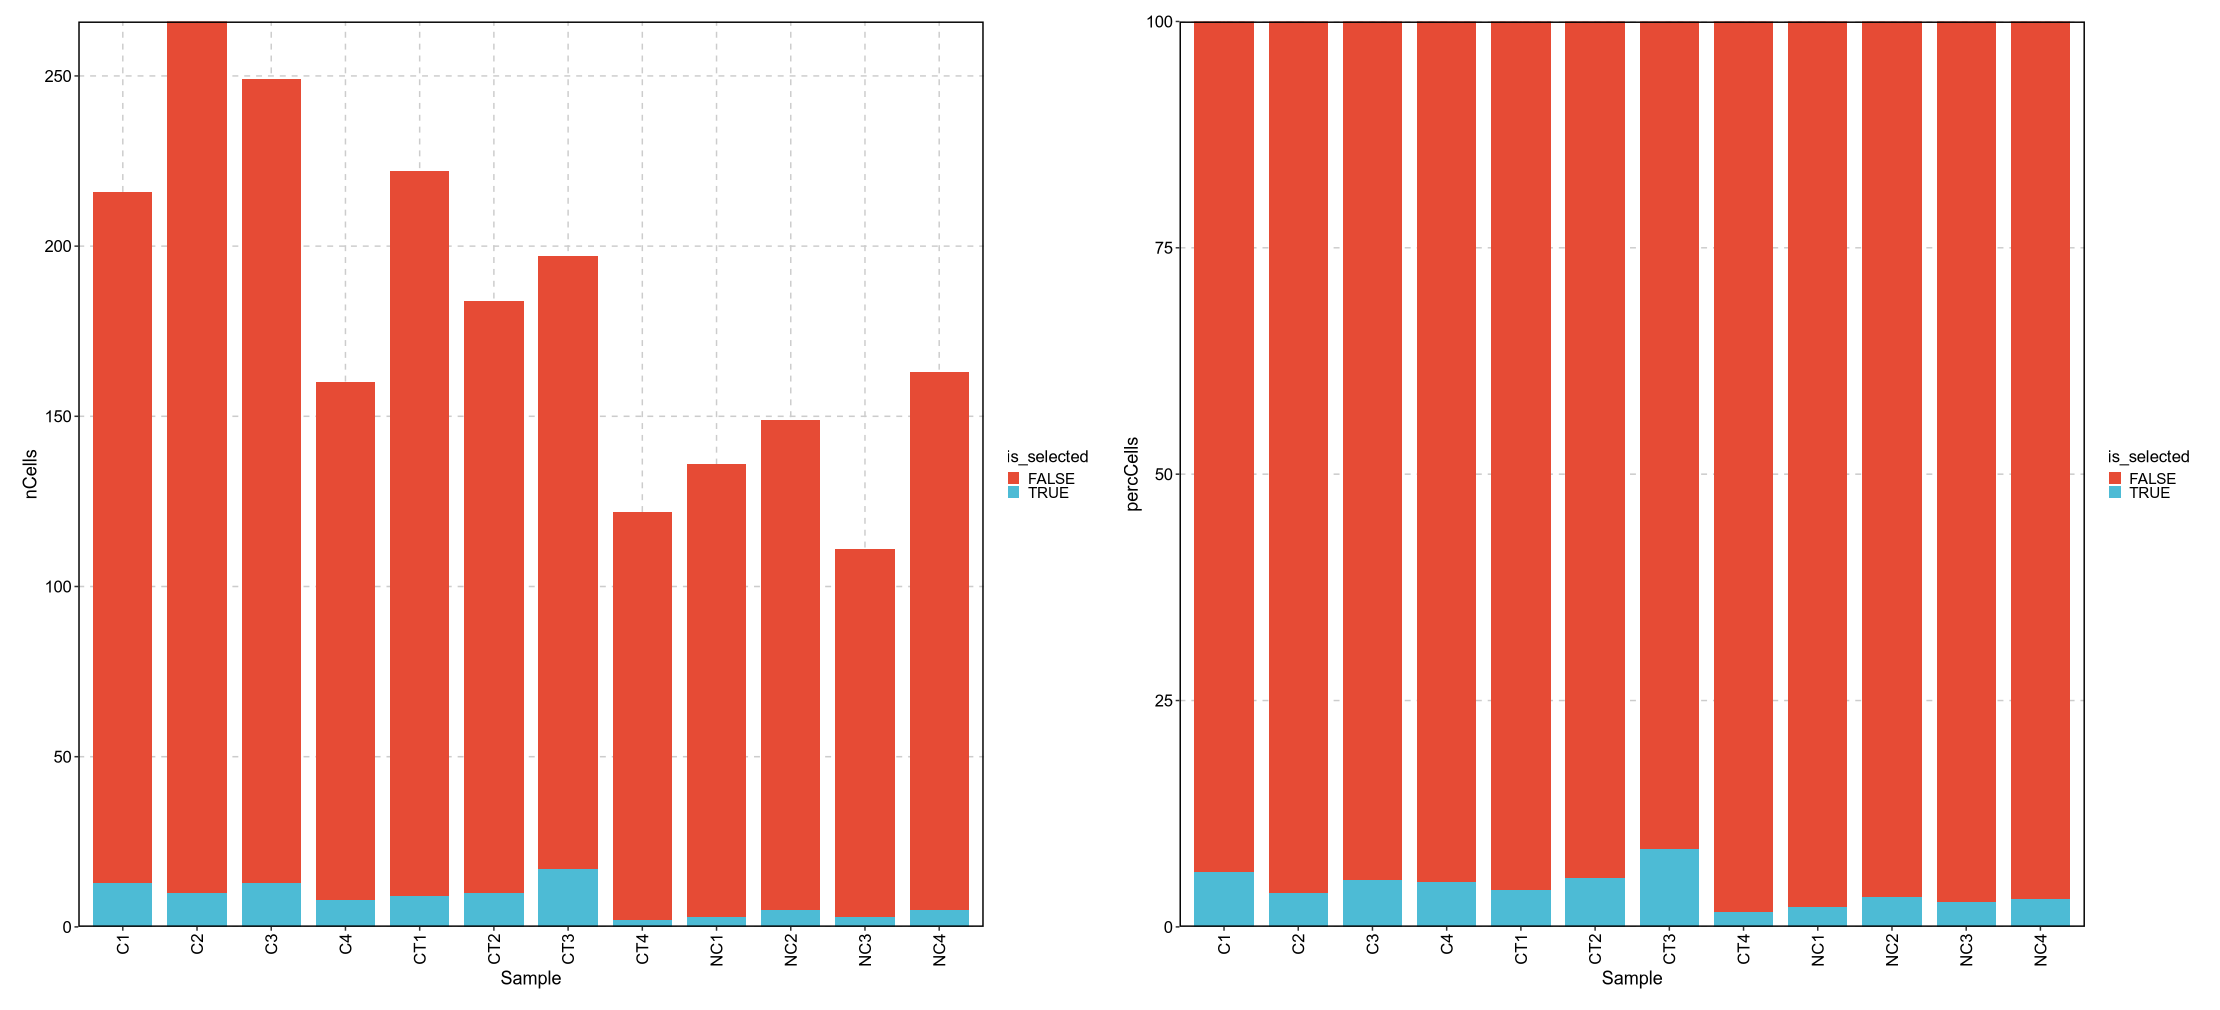
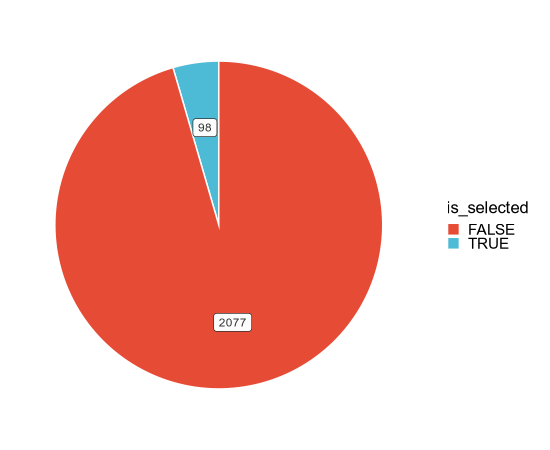
Description
Separates T from non-T cells (or B from non-B cells) and keeps the T/B
cells for the downstream analysis. The selection uses the expression
values of envs.indicator_genes and, unless envs.ignore_vdj is set,
the clonotype percentage of the clusters; when no envs.selector is
given, stats::kmeans (R, with K=2) separates the two groups. This is
not a wrapper of an upstream analysis tool: the process is immunopipe's
own, extending an immunopipe class and running immunopipe's own R script
(immunopipe/scripts/TOrBCellSelection.R).
Base class
immunopipe.inhouse.TOrBCellSelection - an immunopipe class rather than
a biopipen one.
Deviations
The four parameters are immunopipe's own and are used as the base class
declares them; this process overrides none of them and adds none.