Showing data types under column names when printing pandas data frames
One of the features that I like about dplyr/tidyr is that the data types are always visible when you print a data frame/tibble out:
> library(tidyr)
> table1
# A tibble: 6 x 4
  country      year  cases population
  <chr>       <int>  <int>      <int>
1 Afghanistan  1999    745   19987071
2 Afghanistan  2000   2666   20595360
3 Brazil       1999  37737  172006362
4 Brazil       2000  80488  174504898
5 China        1999 212258 1272915272
6 China        2000 213766 1280428583
But in python (pandas), you only see this:
>>> from datar.all import options
>>> from datar.datasets import table1
>>> options(frame_format_patch=False)
>>> table1
       country  year   cases  population
0  Afghanistan  1999     745    19987071
1  Afghanistan  2000    2666    20595360
2       Brazil  1999   37737   172006362
3       Brazil  2000   80488   174504898
4        China  1999  212258  1272915272
5        China  2000  213766  1280428583
If you want to see the data types:
>>> table1.dtypes
country       object
year           int64
cases          int64
population     int64
dtype: object
Then how can we display those dtypes under the column names just as dplyr/tidyr does for tibbles? Here is the expected result:
>>> options(frame_format_patch=True)
>>> table1
       country    year   cases  population
      <object> <int64> <int64>     <int64>
0  Afghanistan    1999     745    19987071
1  Afghanistan    2000    2666    20595360
2       Brazil    1999   37737   172006362
3       Brazil    2000   80488   174504898
4        China    1999  212258  1272915272
5        China    2000  213766  1280428583
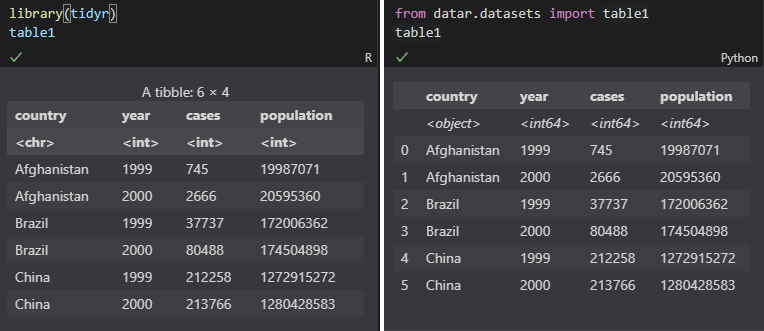
It looks like this when a data frame is shown in Jupyter Notebook:
It's sometimes confusing if the data types are invisible. For example:
>>> table1['year'] = table1['year'].astype(str)
>>> table1['cases'] = table1['cases'].astype(str)
>>> table1['sum'] = table1['year'] + table1['cases']
>>> table1['sum_expected'] = table1['year'].astype(int) + table1['cases'].astype(int)
>>> table1
       country     year    cases  population         sum  sum_expected
      <object> <object> <object>     <int64>    <object>       <int64>
0  Afghanistan     1999      745    19987071     1999745          2744
1  Afghanistan     2000     2666    20595360    20002666          4666
2       Brazil     1999    37737   172006362   199937737         39736
3       Brazil     2000    80488   174504898   200080488         82488
4        China     1999   212258  1272915272  1999212258        214257
5        China     2000   213766  1280428583  2000213766        215766
In such an intended case, we clearly know why the numbers are not adding up, as they are not any of the numeric types.
To implement this, attaching the dtypes to the column names was the inital thought. However, when it comes complicated when the column names have multiple levels (MultiIndex object). So then the idea became to insert the dtypes to the first row of the values.
Digging into the source code of pandas DataFrameFormatter, the format_col is a good place to inject the dtypes:
def format_col(self, i: int) -> List[str]:
    """Format column, add dtype ahead"""
    frame = self.tr_frame
    formatter = self._get_formatter(i)
+   dtype = frame.iloc[:, i].dtype.name

+   return [f'<{dtype}>'] + format_array(
-   return format_array(
        frame.iloc[:, i]._values,
        formatter,
        float_format=self.float_format,
        na_rep=self.na_rep,
        space=self.col_space.get(frame.columns[i]),
        decimal=self.decimal,
        leading_space=self.index,
    )
Then, for the index, we also need to inject a place holder on the same row of the dtypes:
def get_strcols(self) -> List[List[str]]:
    """
    Render a DataFrame to a list of columns (as lists of strings).
    """
    strcols = self._get_strcols_without_index()

    if self.index:
        #           dtype
+       str_index = [""] + self._get_formatted_index(self.tr_frame)
-       str_index = self._get_formatted_index(self.tr_frame)
        strcols.insert(0, str_index)

    return strcols
For HTMLFormatter, we also need to increase the nrows of a data frame by 1 for the dtypes, for both regular and hierarchical rows, add some styles for the first row, where the dtypes are showing. Fortunately, the write_tr(...) method allows us to pass tags, which will be added to the HTML tags later on. So we can set the following tags for the dtype rows:
style="font-style: italic;"
This will make the dtypes show in italic.