Getting Started
%%capture

import numpy
from plotnine import *
from plotnine_prism import *

%run nb_helpers.py
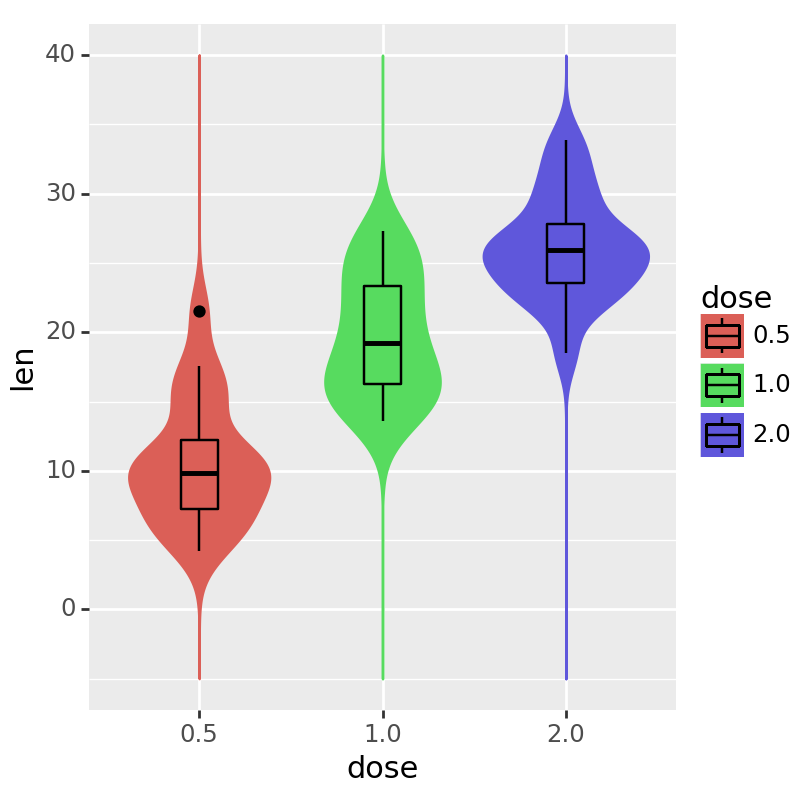
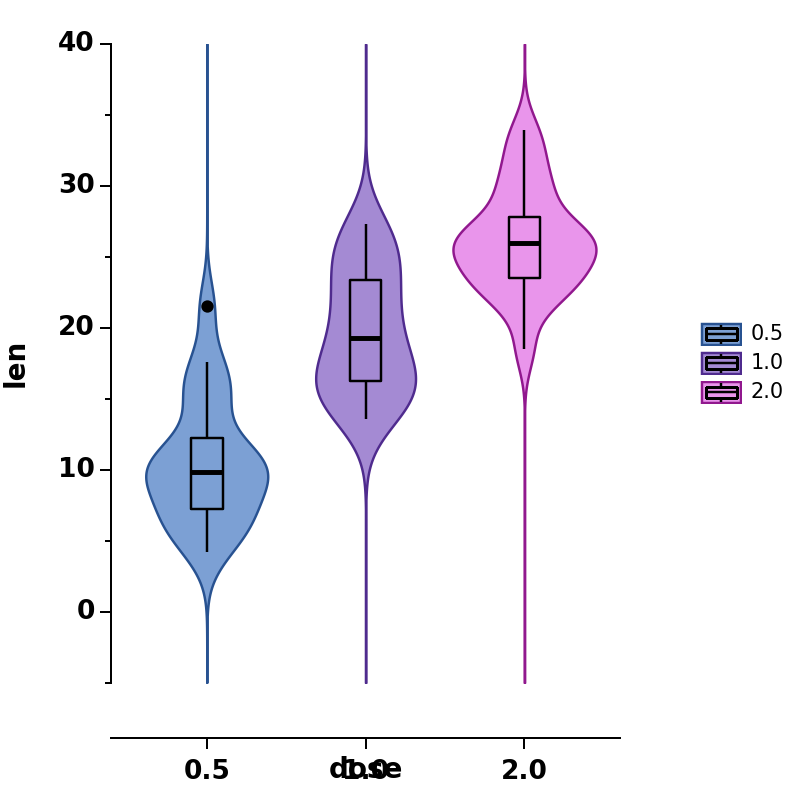
# compare theme_grey() to theme_prism()
p1 = (
    ggplot(ToothGrowth, aes(x="dose", y="len"))
    + stat_summary(
        aes(fill="dose"),
        na_rm=True,
        geom="col",
        fun_y=numpy.mean,
        colour="black",
        size=0.9,
    )
    + scale_y_continuous(limits=[0, 30], expand=[0, 0])
)

p2 = p1 + theme_prism(base_size=12)

print(p1, p2)


# compare some of the available theme palettes
p3 = p1 + theme_prism(palette="mustard_field", base_size=12)
p4 = p1 + theme_prism(palette="flames", base_size=12)

print(p3, p4)
# compare some colour and fill palettes with default theme_prism()
p = (
    ggplot(ToothGrowth, aes(x="supp", y="len"))
    + geom_boxplot(aes(colour="supp", fill="supp"))
    + theme_prism(base_size=12)
)

p1 = (
    p
    + scale_colour_prism(palette="floral")
    + scale_fill_prism(palette="floral")
)

p2 = (
    p
    + scale_colour_prism(palette="flames")
    + scale_fill_prism(palette="flames")
)

print(p1, p2)


# try using the same palette for colour, fill, and theme
p = ggplot(ToothGrowth, aes(x="supp", y="len")) + geom_boxplot(
    aes(colour="supp", fill="supp")
)

p3 = (
    p
    + theme_prism(palette="candy_bright")
    + scale_colour_prism(palette="candy_bright")
    + scale_fill_prism(palette="candy_bright")
)

p4 = (
    p
    + theme_prism(palette="neon")
    + scale_colour_prism(palette="neon")
    + scale_fill_prism(palette="neon")
)

print(p3, p4)


# compare ggplot2 default shape order with ggprism default shape order
p1 = (
    ggplot(msleep, aes(x = "sleep_rem", y = "sleep_total")) +
    geom_point(aes(shape = "vore"), size = 3) +
    theme_prism() +
    theme(axis_title_y = element_blank())
)

p2 = p1 + scale_shape_prism()

print(p1, p2)


# show the 4 different axis guides included in plotnine_prism
p = (
    ggplot(ToothGrowth, aes(x="dose", y="len"))
    + geom_jitter(aes(shape="dose"), width=0.2, size=2)
    + scale_shape_prism()
    + theme_prism()
    # + theme(legend_position="none")
)

p1 = p + scale_y_continuous(limits=[0, 40], guide=guide_prism())
p2 = p + scale_y_continuous(limits=[0, 40], guide=guide_prism_minor())
p3 = p + scale_y_continuous(limits=[0, 40], guide=guide_prism_offset())
p4 = p + scale_y_continuous(limits=[0, 40], guide=guide_prism_offset_minor())

print(p1, p2, p3, p4)


