SeuratClusterStats
Statistics of the clustering.
Including the number/fraction of cells in each cluster, the gene expression values
and dimension reduction plots. It's also possible to perform stats on
TCR clones/clusters or other metadata for each T-cell cluster.
Input
srtobj: The seurat object loaded bySeuratClustering
Output
outdir: Default:{{in.srtobj | stem}}.cluster_stats.
The output directory.
Different types of plots will be saved in different subdirectories.
For example,clustreeplots will be saved inclustreessubdirectory.
For each case inenvs.clustrees, both the png and pdf files will be saved.
Environment Variables
mutaters(type=json): Default:{}.
The mutaters to mutate the metadata to subset the cells.
The mutaters will be applied in the order specified.
You can also use the clone selectors to select the TCR clones/clusters.
See https://pwwang.github.io/scplotter/reference/clone_selectors.html.
You can also use key<newcol>:identto set the<newcol>as the default ident for the stats.
See also https://pwwang.github.io/biopipen.utils.R/reference/MutateSeuratMeta.htmlcache(type=auto): Default:/tmp.
Whether to cache the plots.
Currently only plots for features are supported, since creating the those plots can be time consuming.
IfTrue, the plots will be cached in the job output directory, which will be not cleaned up when job is rerunning.clustrees_defaults(ns): The parameters for the clustree plots.devpars(ns): The device parameters for the clustree plot.res(type=int): Default:100.
The resolution of the plots.height(type=int): The height of the plots.width(type=int): The width of the plots.
more_formats(type=list): Default:[].
The formats to save the plots other thanpng.save_code(flag): Default:False.
Whether to save the code to reproduce the plot.prefix(type=auto): Default:True.
string indicating columns containing clustering information.
The trailing dot is not necessary and will be added automatically.
WhenTRUE, clustrees will be plotted when there isFindClustersorFindClusters.*in theobj@commands.
The latter is generated bySeuratSubClustering.
This will be ignored whenenvs.clustreesis specified (the prefix of each case must be specified separately).<more>: Other arguments passed toscplotter::ClustreePlot.
See https://pwwang.github.io/scplotter/reference/ClustreePlot.html
clustrees(type=json): Default:{}.
The cases for clustree plots.
Keys are the names of the plots and values are the dicts inherited fromenv.clustrees_defaultsexceptprefix.
There is no default case forclustrees.stats_defaults(ns): The default parameters forstats.
This is to do some basic statistics on the clusters/cells. For more comprehensive analysis, see https://pwwang.github.io/scplotter/reference/CellStatPlot.html.
The parameters from the cases can overwrite the default parameters.subset: An expression to subset the cells, will be passed totidyrseurat::filter().devpars(ns): The device parameters for the clustree plot.res(type=int): Default:100.
The resolution of the plots.height(type=int): The height of the plots.width(type=int): The width of the plots.
descr: The description of the plot, showing in the report.more_formats(type=list): Default:[].
The formats to save the plots other thanpng.save_code(flag): Default:False.
Whether to save the code to reproduce the plot.save_data(flag): Default:False.
Whether to save the data used to generate the plot.<more>: Other arguments passed toscplotter::CellStatPlot.
See https://pwwang.github.io/scplotter/reference/CellStatPlot.html.
stats(type=json): Default:{'Number of cells in each cluster (Bar Chart)': Diot({'plot_type': 'bar', 'x_text_angle': 90}), 'Number of cells in each cluster by Sample (Bar Chart)': Diot({'plot_type': 'bar', 'group_by': 'Sample', 'x_text_angle': 90})}.
The number/fraction of cells to plot.
Keys are the names of the plots and values are the dicts inherited fromenv.stats_defaults.ngenes_defaults(ns): The default parameters forngenes.
The default parameters to plot the number of genes expressed in each cell.more_formats(type=list): Default:[].
The formats to save the plots other thanpng.subset: An expression to subset the cells, will be passed totidyrseurat::filter().devpars(ns): The device parameters for the plots.res(type=int): Default:100.
The resolution of the plots.height(type=int): Default:800.
The height of the plots.width(type=int): Default:1000.
The width of the plots.
add_box: Default:True.
ngenes(type=json): Default:{'Number of genes expressed in each cluster': Diot({})}.
The number of genes expressed in each cell.
Keys are the names of the plots and values are the dicts inherited fromenv.ngenes_defaults.features_defaults(ns): The default parameters forfeatures.features(type=auto): The features to plot.
It can be either a string with comma separated features, a list of features, a file path withfile://prefix with features (one per line), or an integer to use the top N features fromVariantFeatures(srtobj).
It can also be a dict with the keys as the feature group names and the values as the features, which is used for heatmap to group the features.order_by(type=auto): The order of the clusters to show on the plot.
An expression passed todplyr::arrange()on the grouped meta data frame (byident).
For example, you can order the clusters by the activation score of the cluster:desc(mean(ActivationScore, na.rm = TRUE)), suppose you have a columnActivationScorein the metadata.
You may also specify the literal order of the clusters by a list of strings (at least two).subset: An expression to subset the cells, will be passed totidyrseurat::filter().devpars(ns): The device parameters for the plots.res(type=int): Default:100.
The resolution of the plots.height(type=int): The height of the plots.width(type=int): The width of the plots.
descr: The description of the plot, showing in the report.more_formats(type=list): Default:[].
The formats to save the plots other thanpng.save_code(flag): Default:False.
Whether to save the code to reproduce the plot.save_data(flag): Default:False.
Whether to save the data used to generate the plot.<more>: Other arguments passed toscplotter::FeatureStatPlot.
See https://pwwang.github.io/scplotter/reference/FeatureStatPlot.html
features(type=json): Default:{}.
The plots for features, include gene expressions, and columns from metadata.
Keys are the titles of the cases and values are the dicts inherited fromenv.features_defaults.dimplots_defaults(ns): The default parameters fordimplots.
You can also setdimsto[1, 2, 3]to make a 3D dimensional reduction plot.
Note that the defaultn.componentsforRunUMAPis 2, so if you want to make a 3D UMAP plot, you need to setn.componentsto 3 inRunUMAPparameters inSeuratSubClusteringorSeuratClustering.group_by: The identity to use.split_by: The column name in metadata to split the cells into different plots.subset: An expression to subset the cells, will be passed totidyrseurat::filter().devpars(ns): The device parameters for the plots.res(type=int): Default:100.
The resolution of the plots.height(type=int): The height of the plots.width(type=int): The width of the plots.
reduction(choice): Default:dim.
Which dimensionality reduction to use.dim: Ifidentis from subclustering,<group_by>.<reduction>will be used.
Otherwise,scplotter:::default_dimreduc(obj)will be used to determine the default dimensionality reduction to use based on the reductions available in the object.auto: Same asdimumap: UseSeurat::UMAPPlot.tsne: UseSeurat::TSNEPlot.pca: UseSeurat::PCAPlot.
<more>: See https://pwwang.github.io/scplotter/reference/CellDimPlot.html
dimplots(type=json): Default:{'Dimensional reduction plot': Diot({'label': True}), 'VDJ Presence': Diot({'group_by': 'VDJ_Presence'})}.
The dimensional reduction plots.
Keys are the titles of the plots and values are the dicts inherited fromenv.dimplots_defaults. It can also have other parameters fromscplotter::CellDimPlot.
Examples
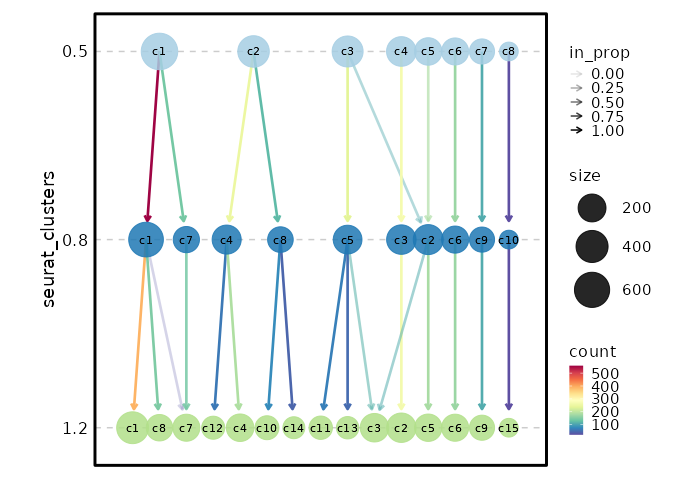
Clustree Plot
[SeuratClusterStats.envs.clustrees."Clustree Plot"]
prefix = "seurat_clusters"
devpars = {height = 500}
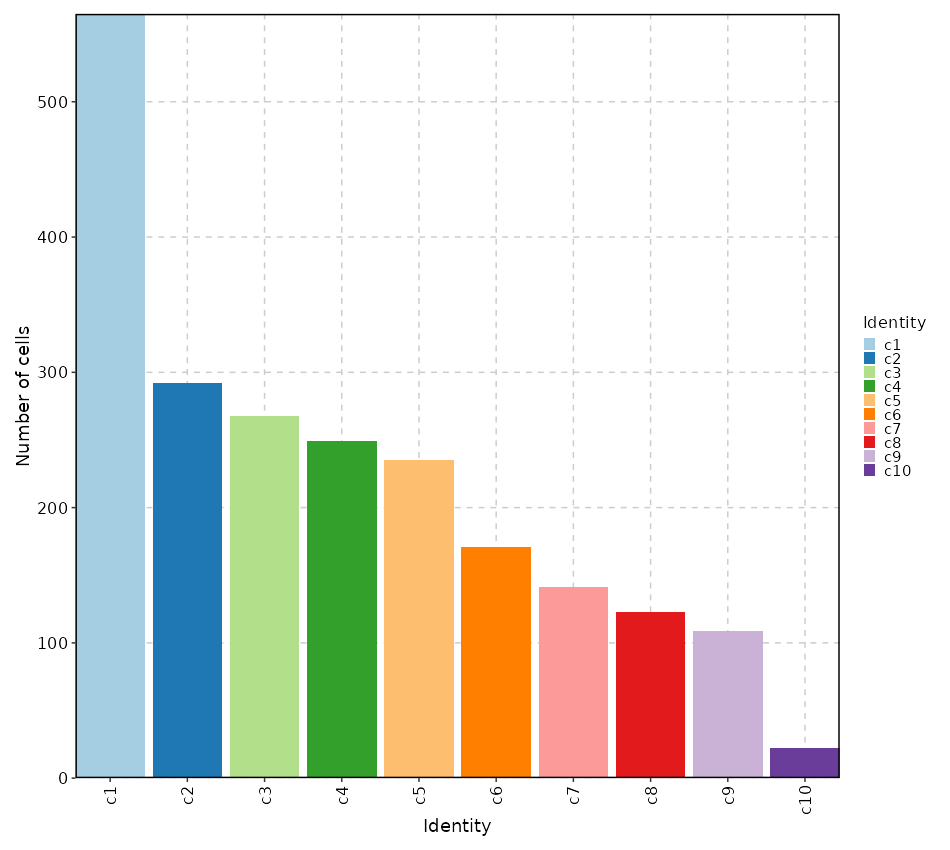
Number of cells in each cluster (Bar Chart)
[SeuratClusterStats.envs.stats."Number of cells in each cluster (Bar Chart)"]
plot_type = "bar"
x_text_angle = 90
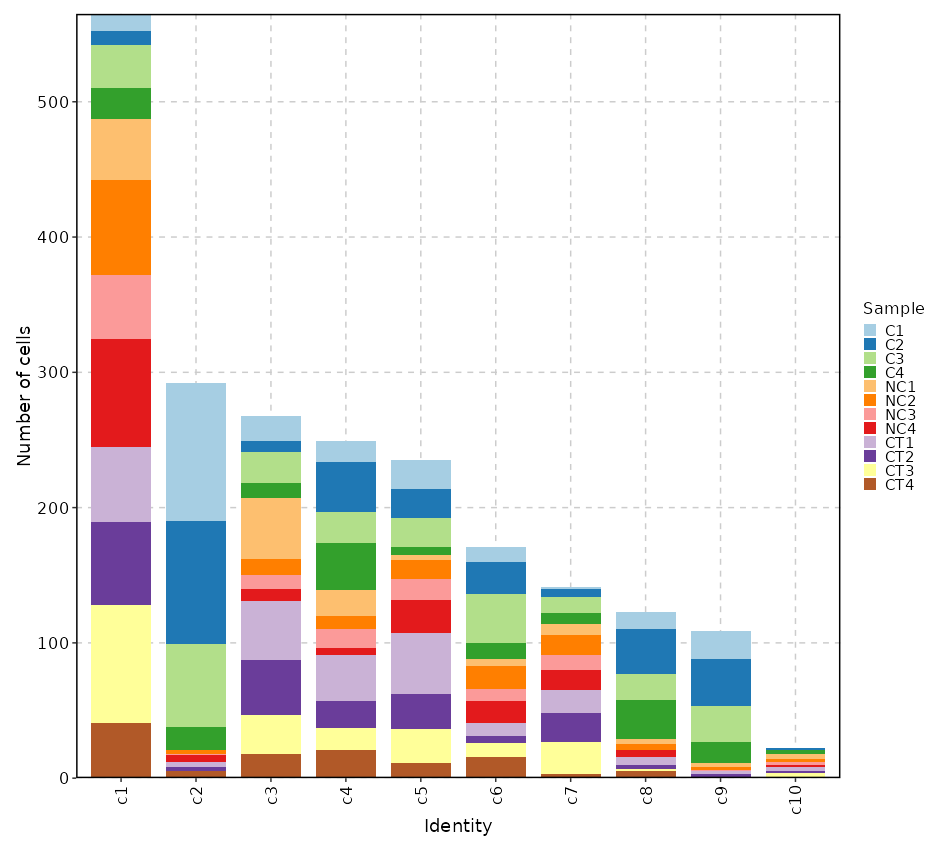
Number of cells in each cluster by Sample (Bar Chart)
[SeuratClusterStats.envs.stats."Number of cells in each cluster by Sample (Bar Chart)"]
plot_type = "bar"
group_by = "Sample"
x_text_angle = 90
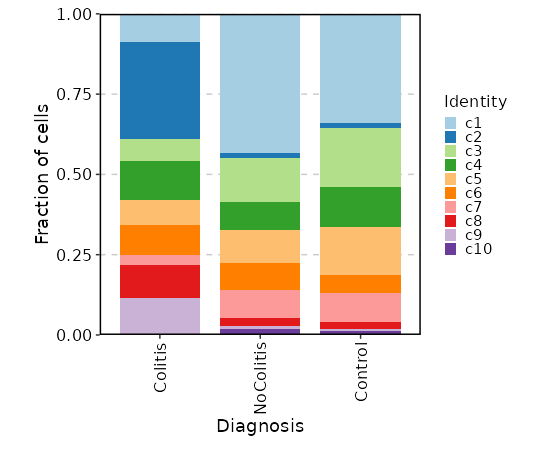
Number of cells in each cluster by Diagnosis
[SeuratClusterStats.envs.stats."Number of cells in each cluster by Diagnosis"]
plot_type = "bar"
group_by = "Diagnosis"
frac = "group"
x_text_angle = 90
swap = true
position = "stack"
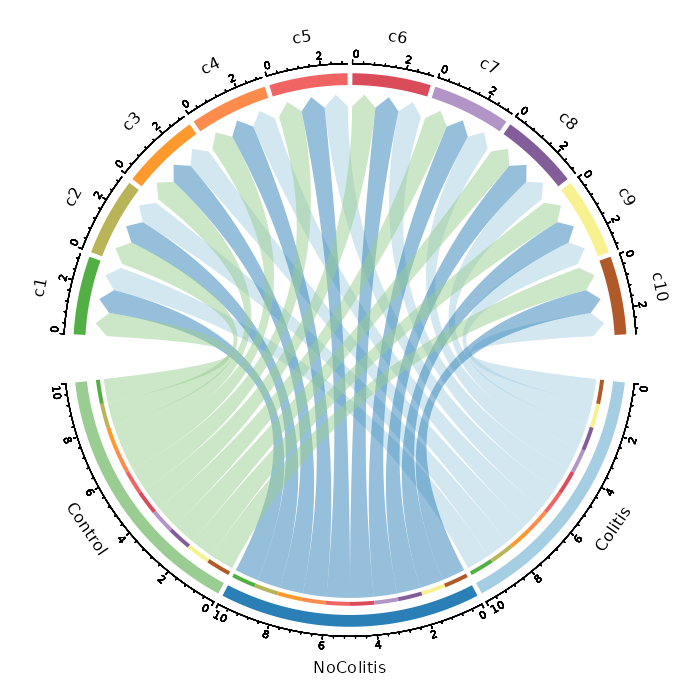
Number of cells in each cluster by Diagnosis (Circos Plot)
[SeuratClusterStats.envs.stats."Number of cells in each cluster by Diagnosis (Circos Plot)"]
plot_type = "circos"
group_by = "Diagnosis"
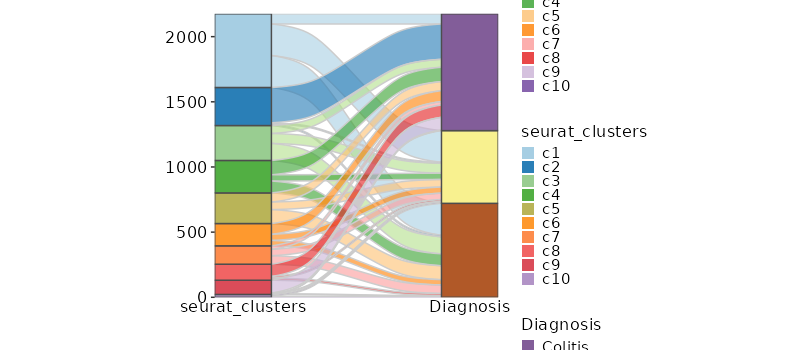
Number of cells in each cluster by Diagnosis (Sankey Plot)
[SeuratClusterStats.envs.stats."Number of cells in each cluster by Diagnosis (Sankey Plot)"]
plot_type = "sankey"
group_by = ["seurat_clusters", "Diagnosis"]
links_alpha = 0.6
devpars = {width = 800}
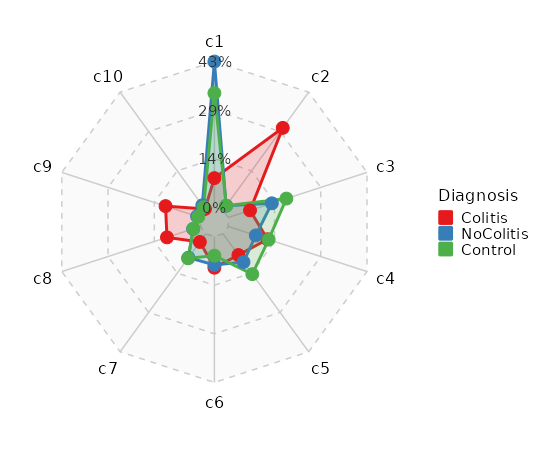
Number of cells in each cluster by Sample (Spider Plot)
[SeuratClusterStats.envs.stats."Number of cells in each cluster by Sample (Spider Plot)"]
plot_type = "spider"
group_by = "Diagnosis"
palette = "Set1"
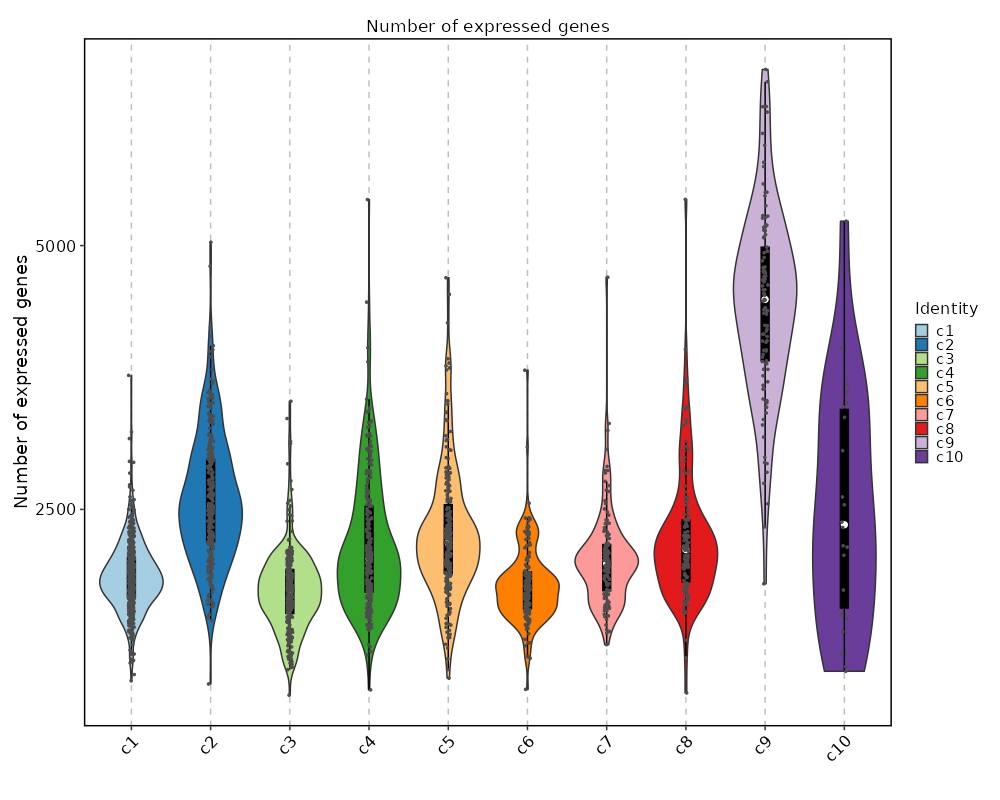
Number of genes detected in each cluster
[SeuratClusterStats.envs.ngenes."Number of genes detected in each cluster"]
plot_type = "violin"
add_box = true
add_point = true
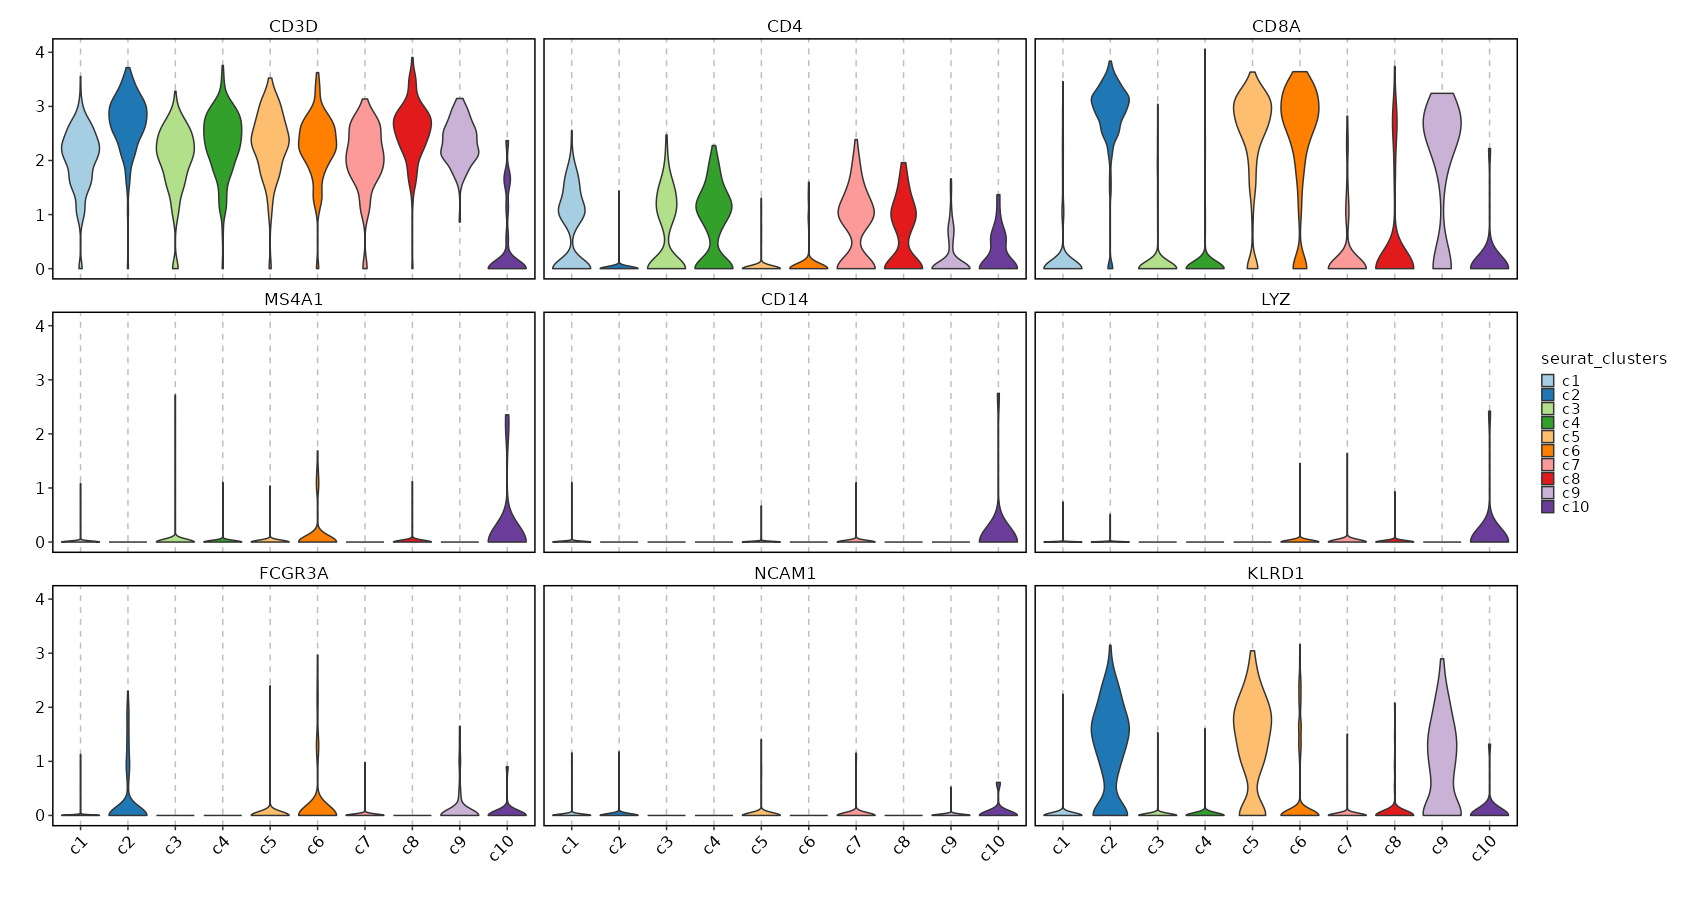
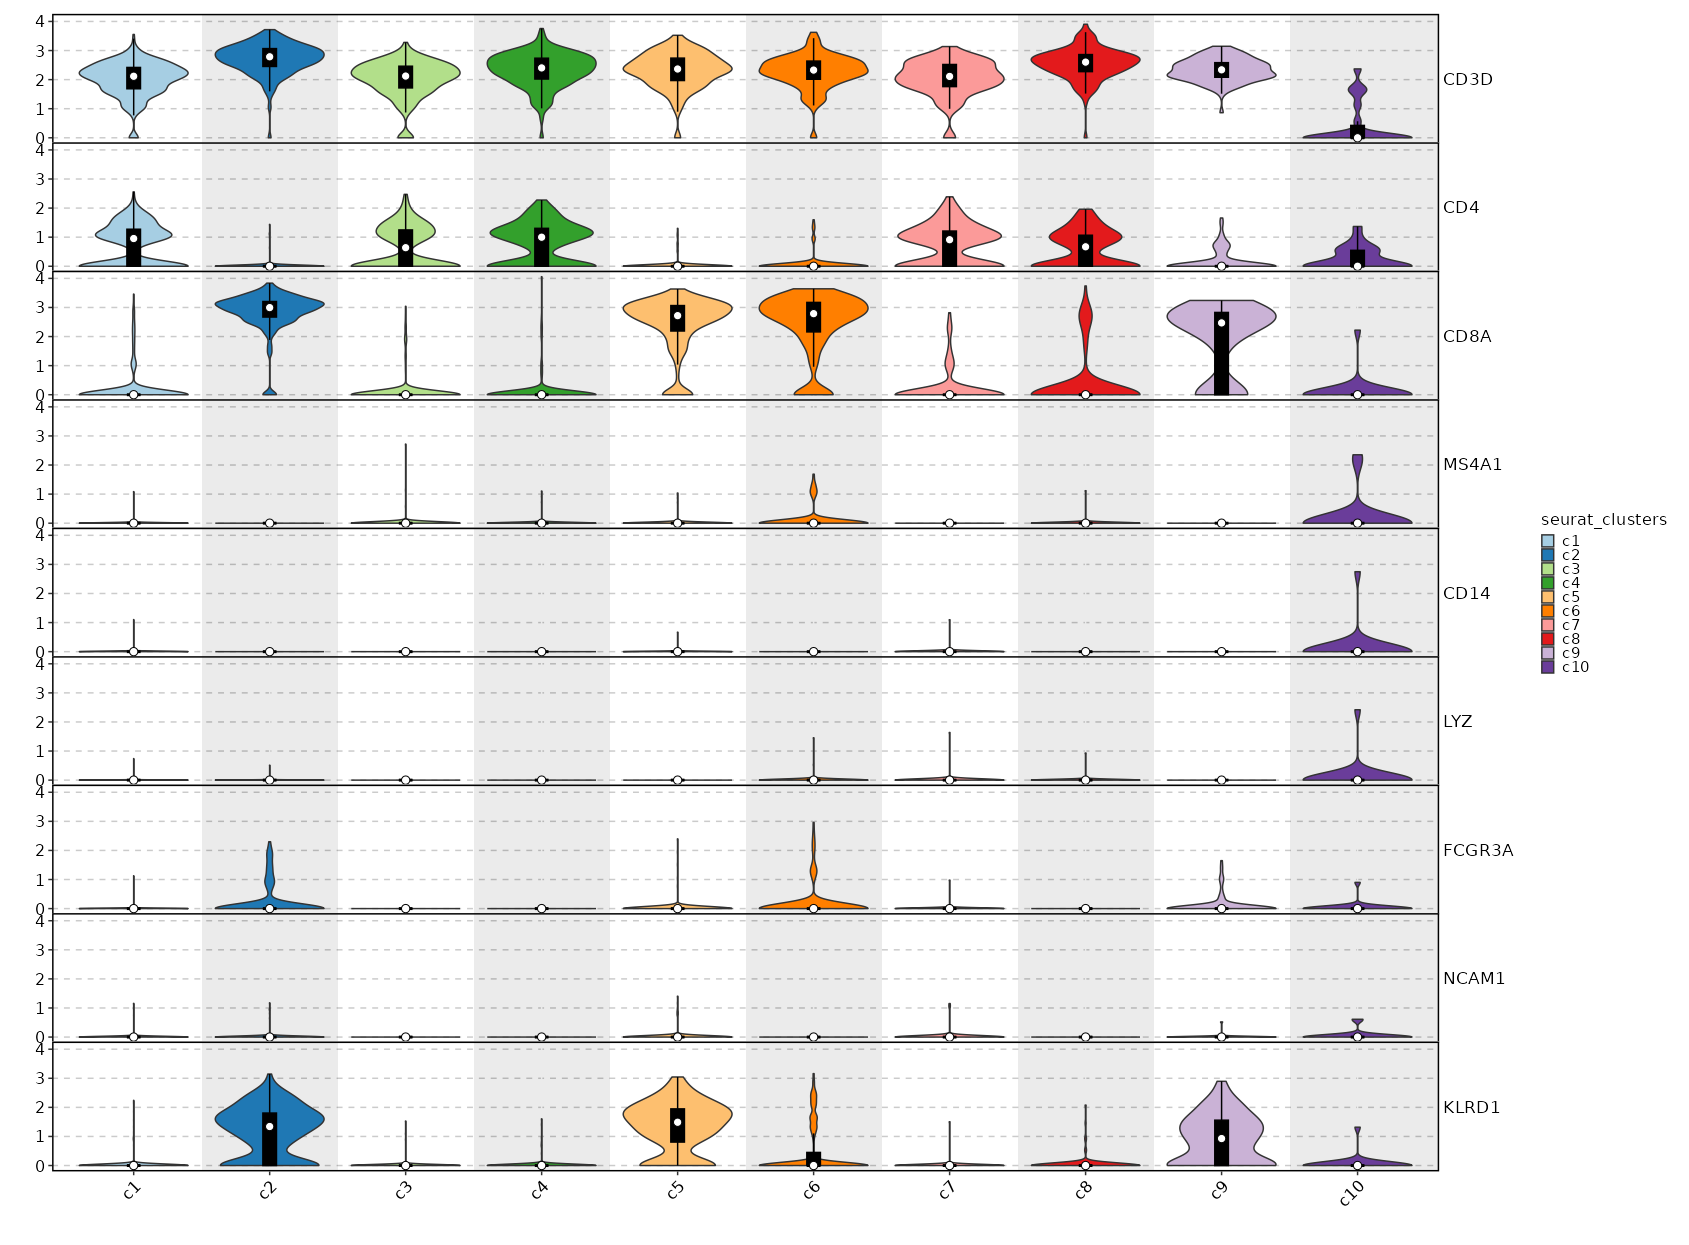
Feature Expression in Clusters (Violin Plots)
[SeuratClusterStats.envs.features_defaults]
features = ["CD3D", "CD4", "CD8A", "MS4A1", "CD14", "LYZ", "FCGR3A", "NCAM1", "KLRD1"]

[SeuratClusterStats.envs.features."Feature Expression in Clusters (Violin Plots)"]
plot_type = "violin"
ident = "seurat_clusters"
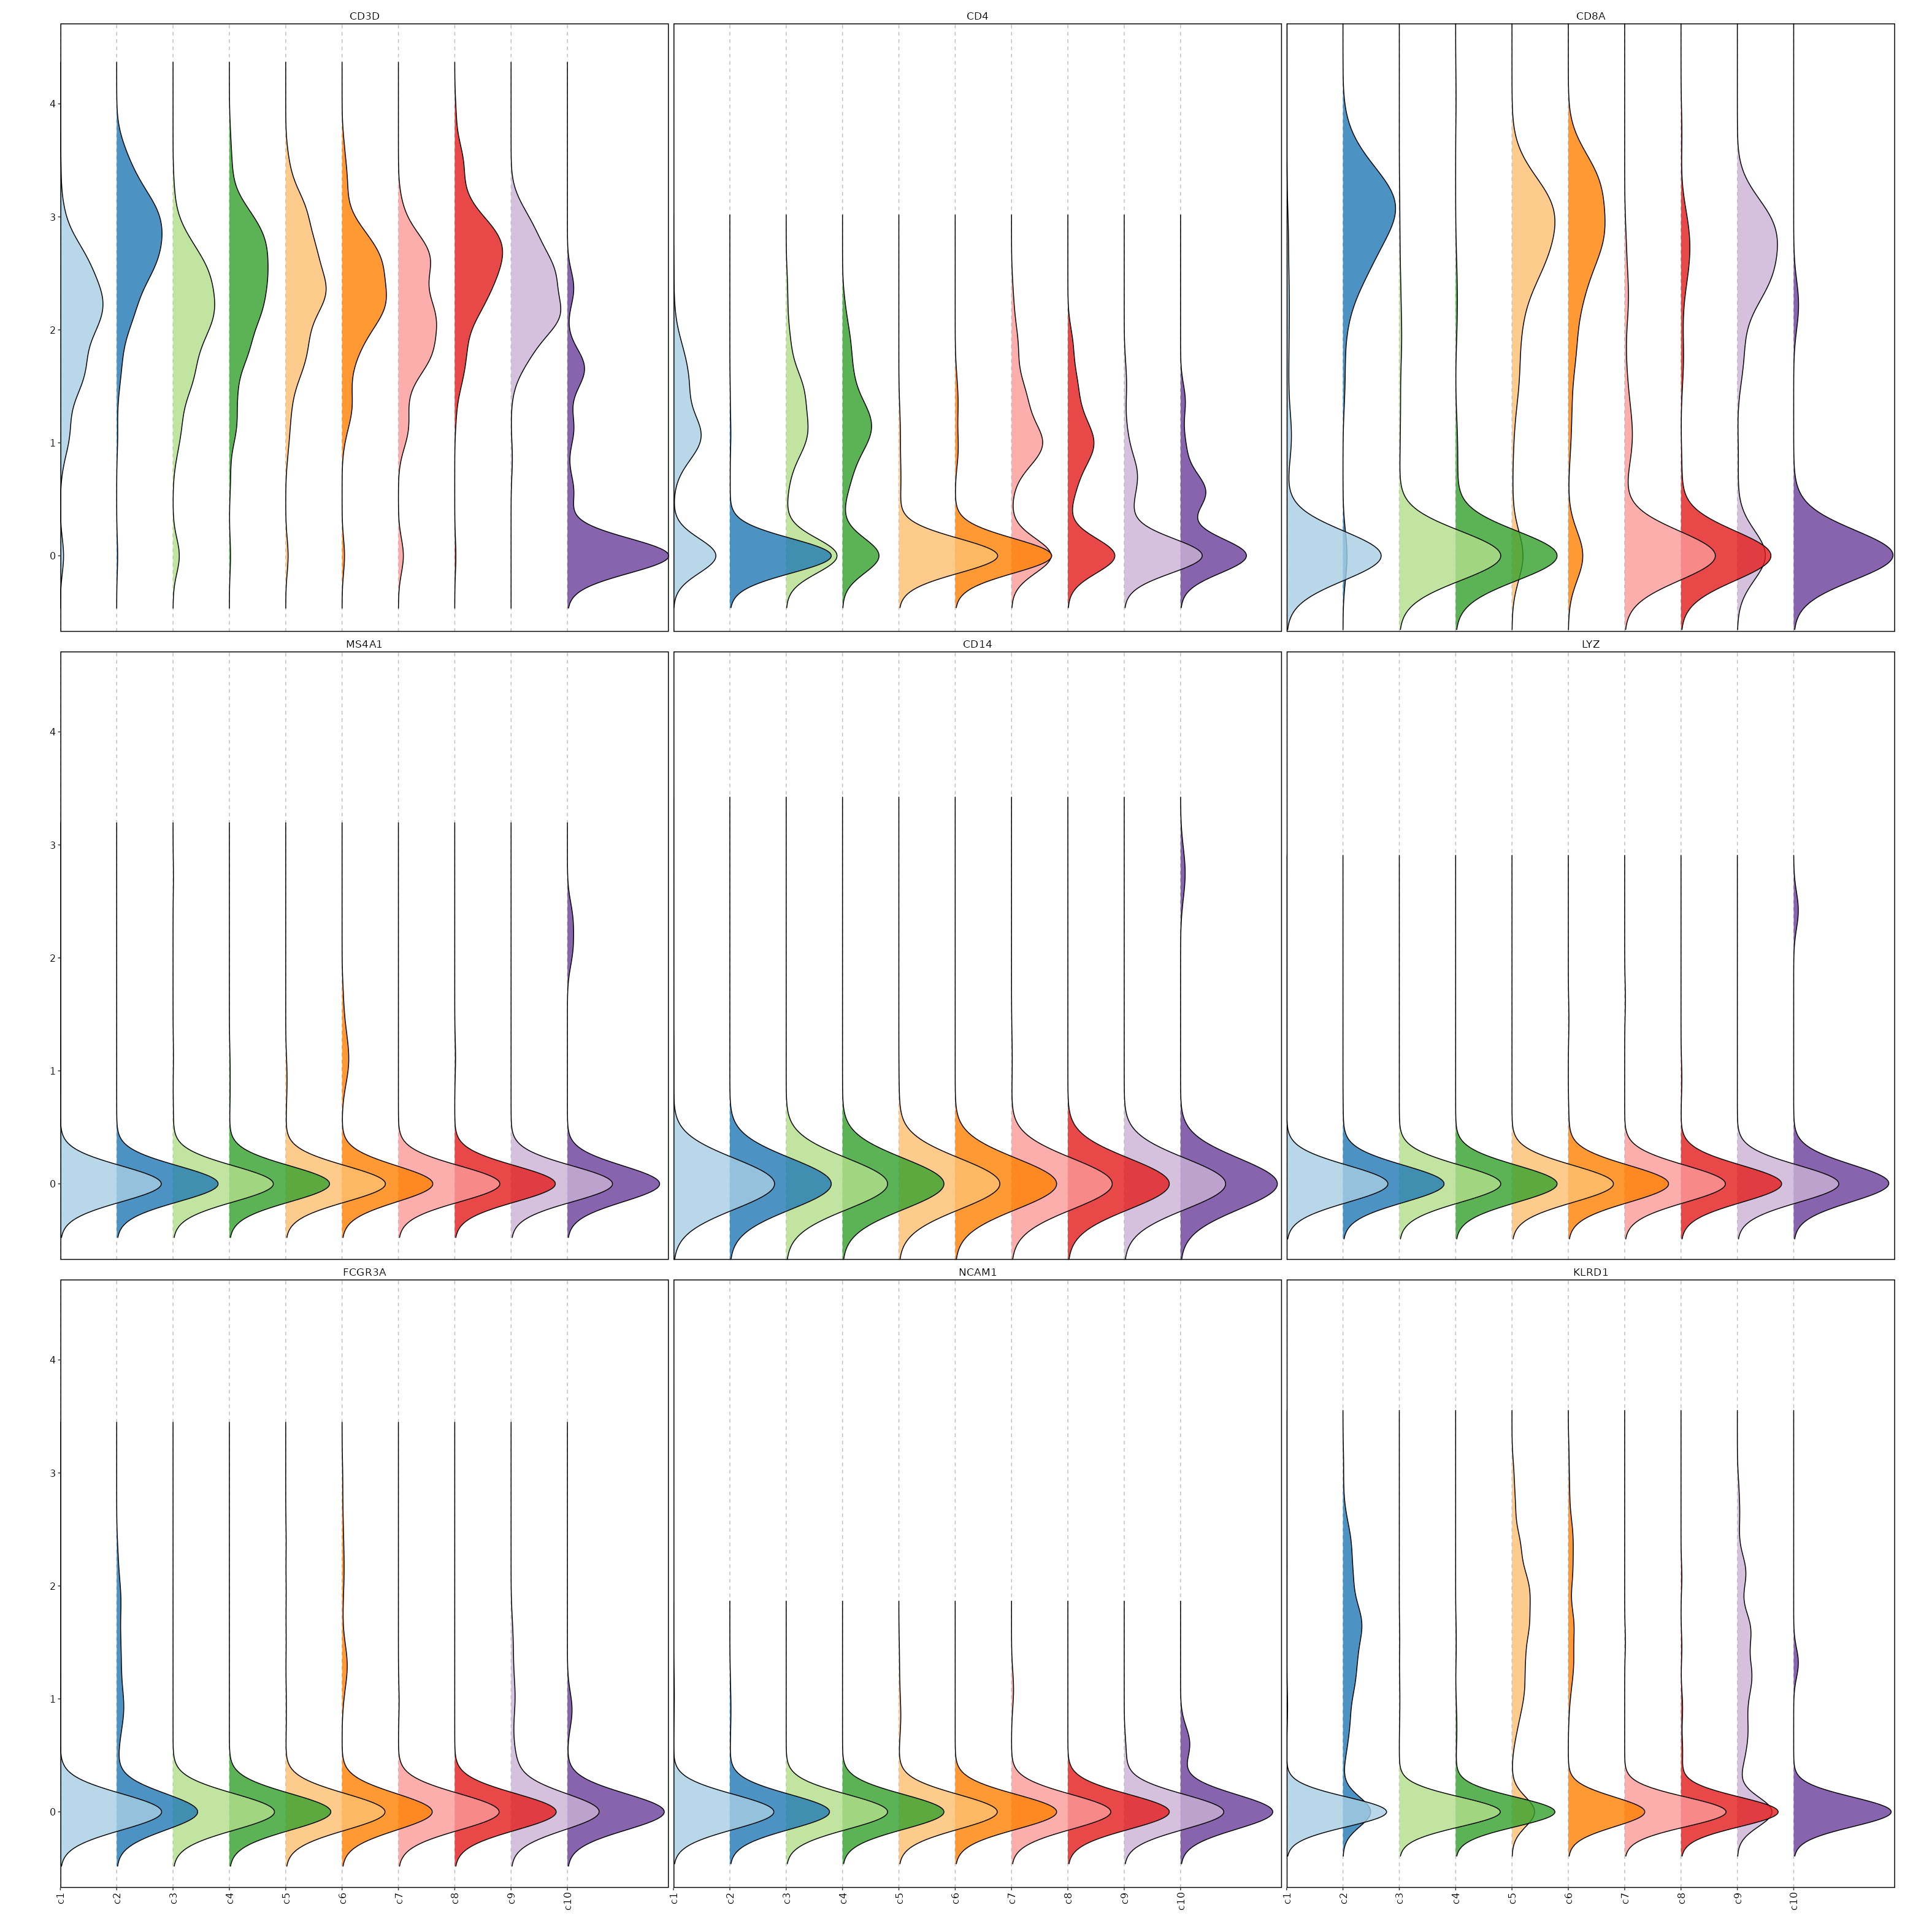
Feature Expression in Clusters (Ridge Plots)
# Using the same features as above
[SeuratClusterStats.envs.features."Feature Expression in Clusters (Ridge Plots)"]
plot_type = "ridge"
ident = "seurat_clusters"
flip = true
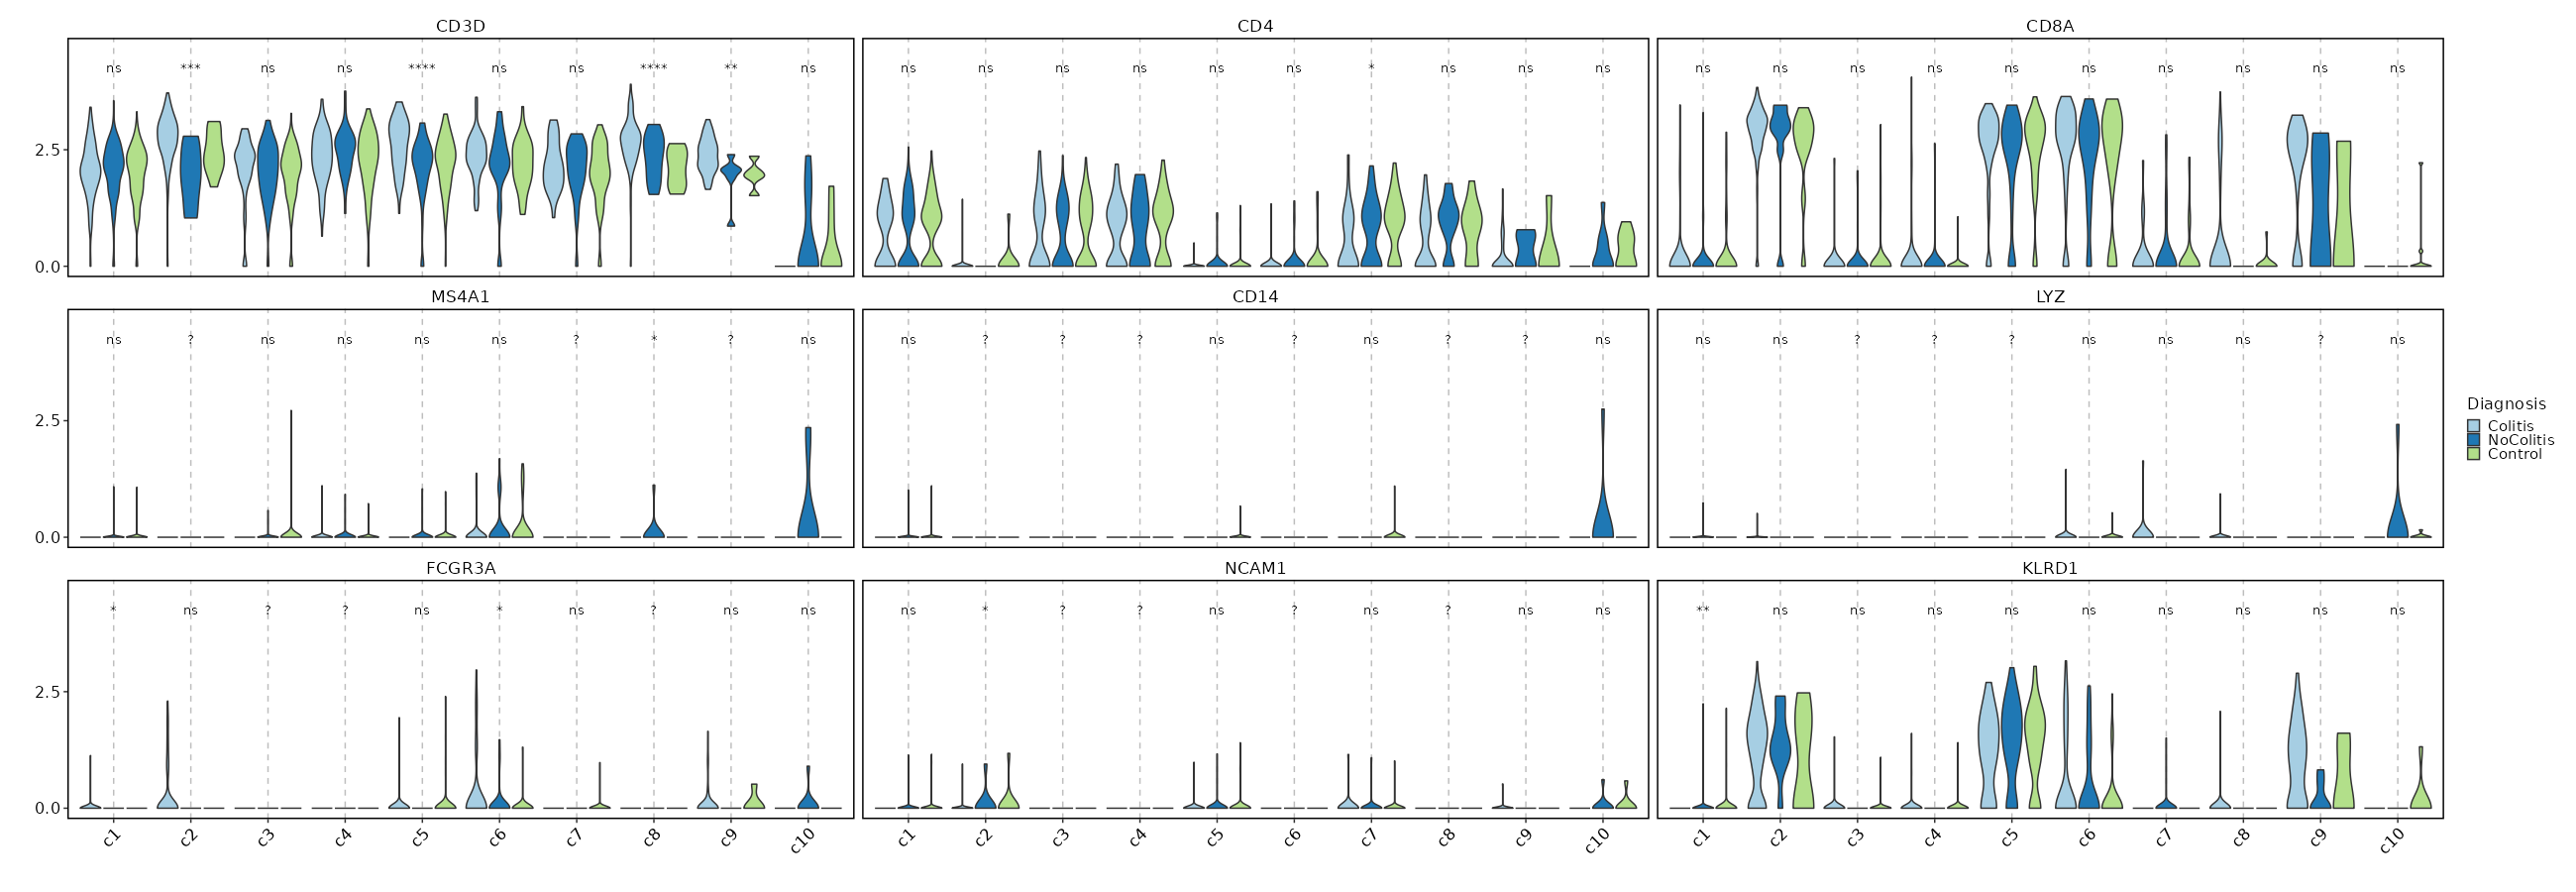
Feature Expression in Clusters by Diagnosis
# Using the same features as above
[SeuratClusterStats.envs.features."Feature Expression in Clusters by Diagnosis"]
plot_type = "violin"
group_by = "Diagnosis"
ident = "seurat_clusters"
comparisons = true
sig_label = "p.signif"
Feature Expression in Clusters (stacked)
# Using the same features as above
[SeuratClusterStats.envs.features."Feature Expression in Clusters (stacked)"]
plot_type = "violin"
ident = "seurat_clusters"
add_bg = true
stack = true
add_box = true
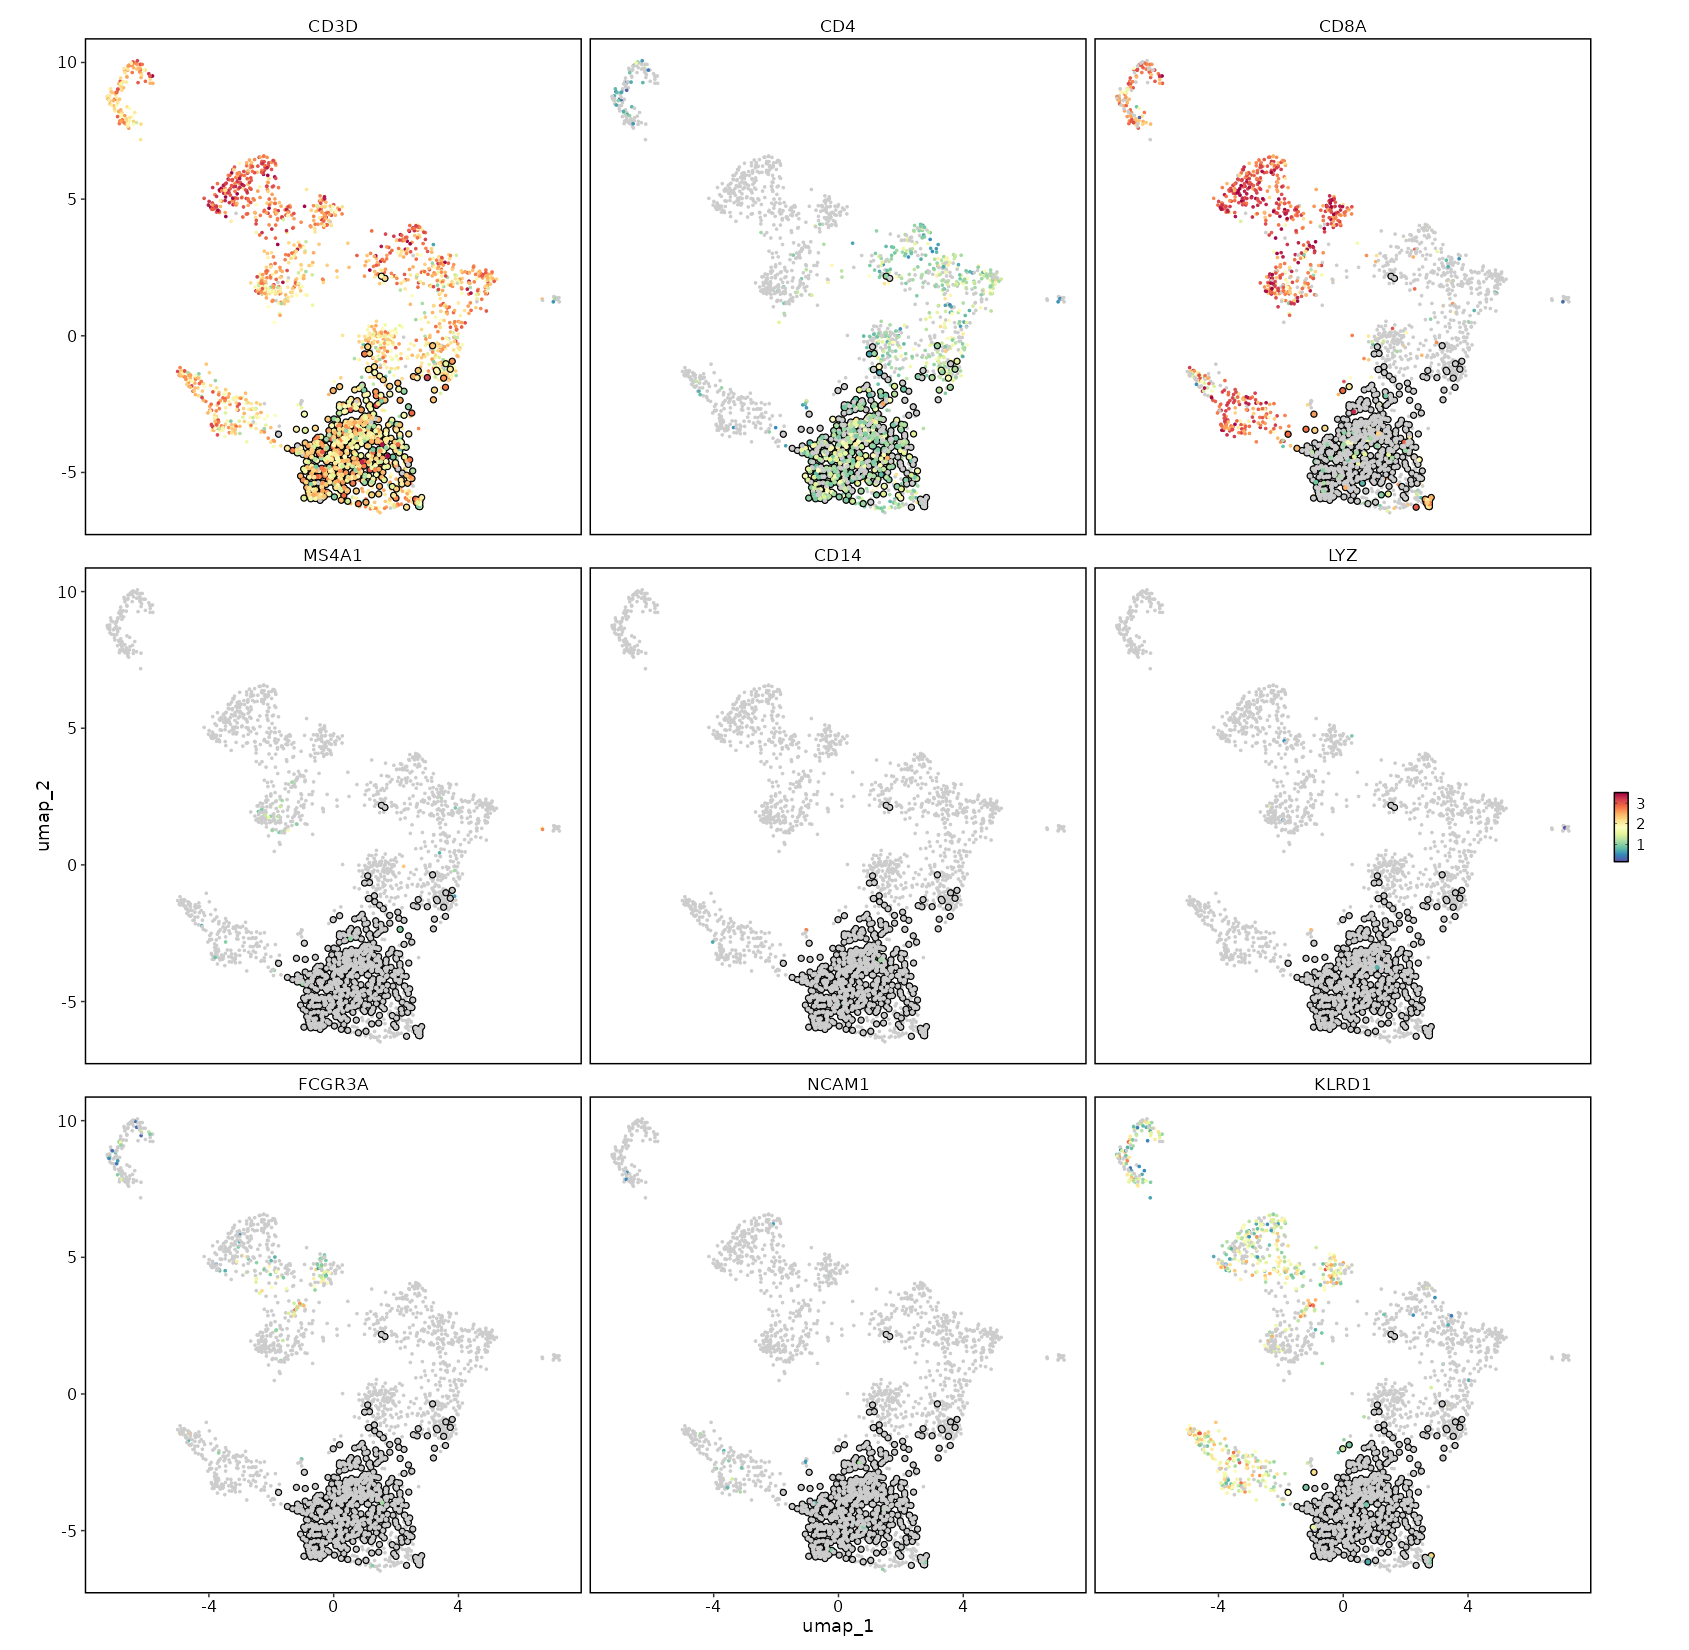
CD4 Expression on UMAP
[SeuratClusterStats.envs.features."CD4 Expression on UMAP"]
plot_type = "dim"
feature = "CD4"
highlight = "seurat_clusters == 'c1'"
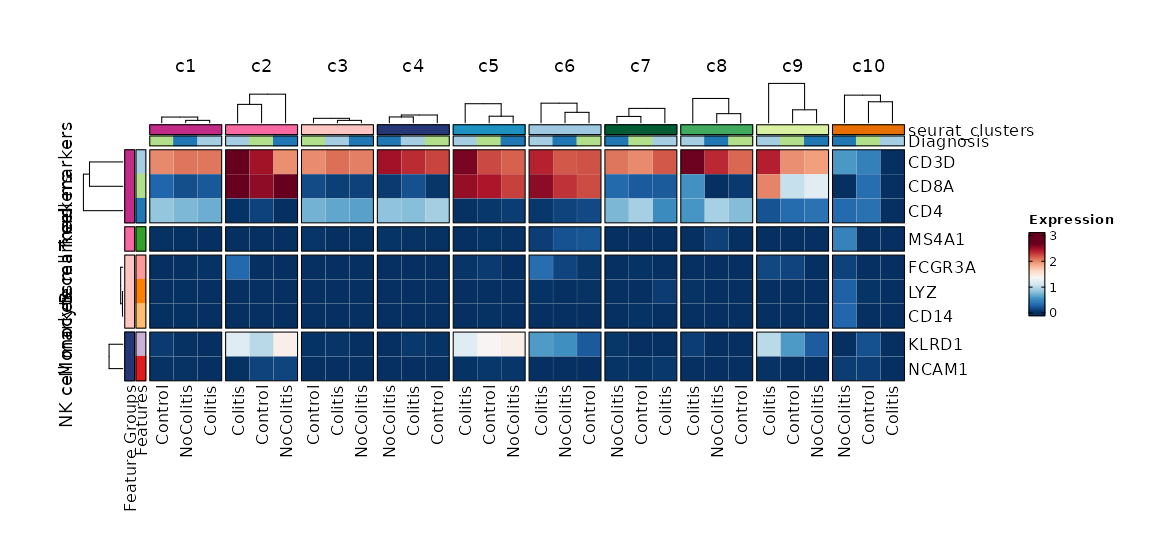
Feature Expression in Clusters by Diagnosis (Heatmap)
[SeuratClusterStats.envs.features."Feature Expression in Clusters by Diagnosis (Heatmap)"]
# Grouped features
features = {"T cell markers" = ["CD3D", "CD4", "CD8A"], "B cell markers" = ["MS4A1"], "Monocyte markers" = ["CD14", "LYZ", "FCGR3A"], "NK cell markers" = ["NCAM1", "KLRD1"]}
plot_type = "heatmap"
ident = "Diagnosis"
columns_split_by = "seurat_clusters"
name = "Expression"
devpars = {height = 560}
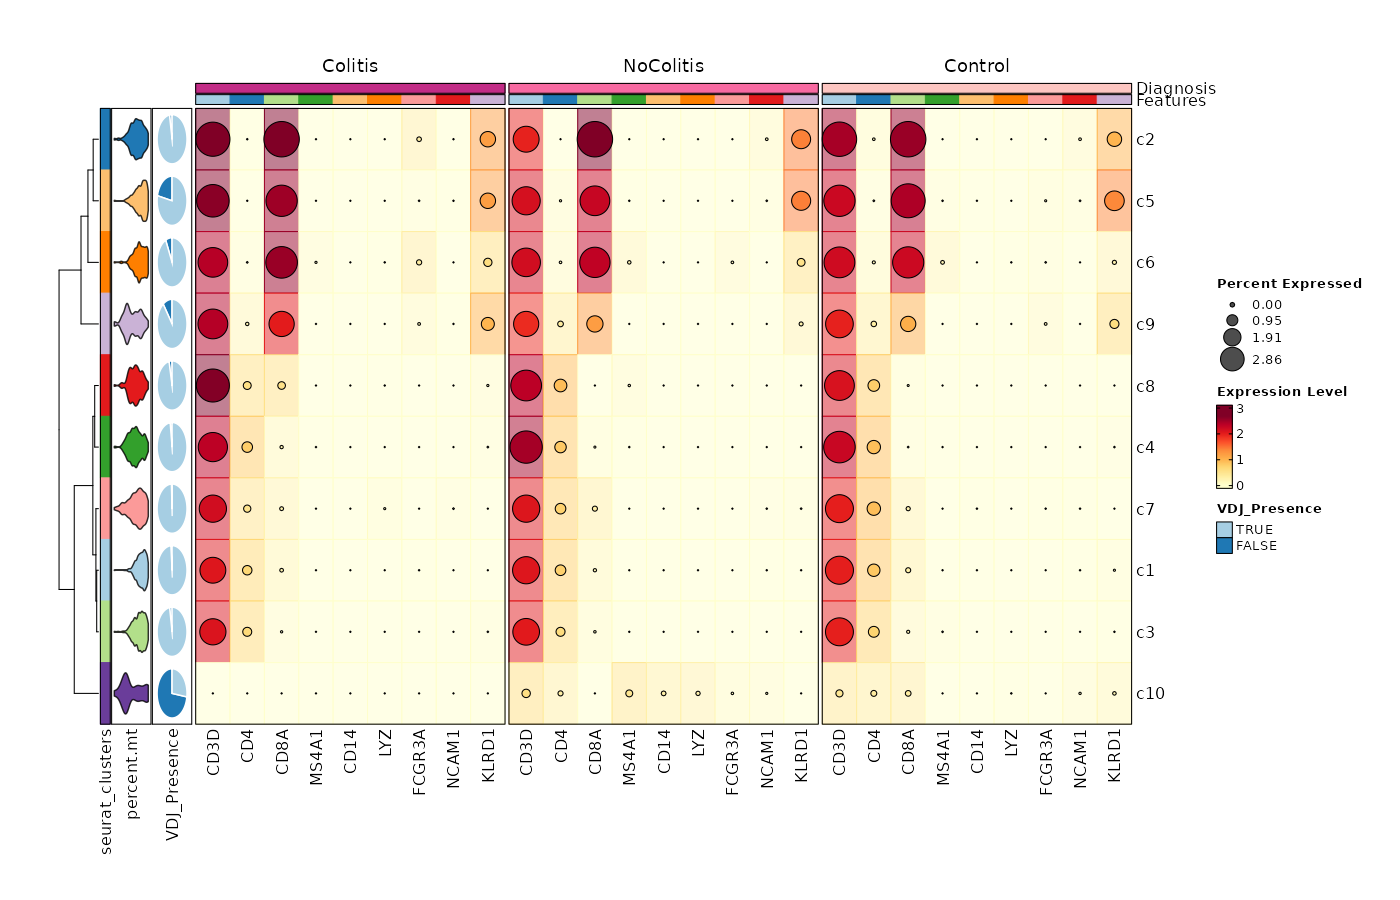
Feature Expression in Clusters by Diagnosis (Heatmap with annotations)
# Using the default features
[SeuratClusterStats.envs.features."Feature Expression in Clusters by Diagnosis (Heatmap with annotations)"]
ident = "seurat_clusters"
cell_type = "dot"
plot_type = "heatmap"
name = "Expression Level"
dot_size = "nanmean"
dot_size_name = "Percent Expressed"
add_bg = true
rows_split_by = "Diagnosis"
cluster_rows = false
flip = true
palette = "YlOrRd"
column_annotation = ["percent.mt", "VDJ_Presence"]
column_annotation_type = {"percent.mt" = "violin", VDJ_Presence = "pie"}
column_annotation_params = {"percent.mt" = {show_legend = false}}
devpars = {width = 1400, height = 900}
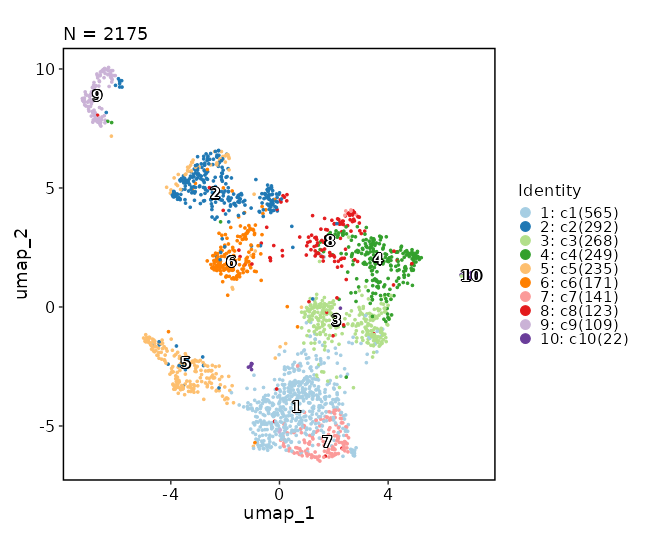
Dimensional reduction plot
[SeuratClusterStats.envs.features."Dimensional reduction plot"]
label = true
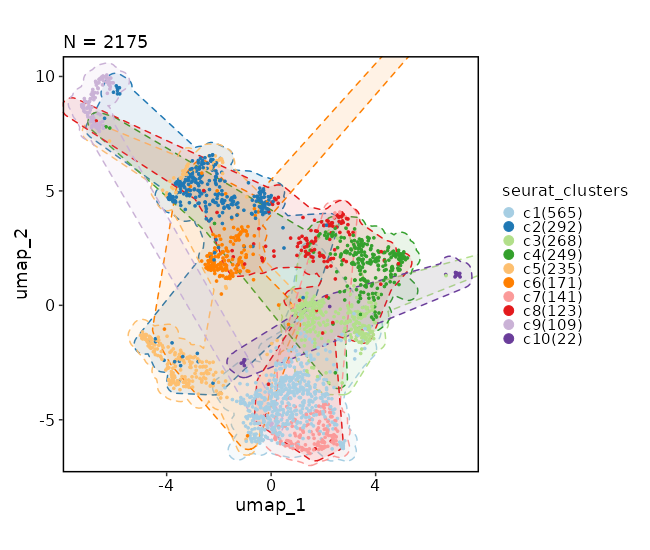
Dimensional reduction plot (with marks)
[SeuratClusterStats.envs.dimplots."Dimensional reduction plot (with marks)"]
add_mark = true
mark_linetype = 2
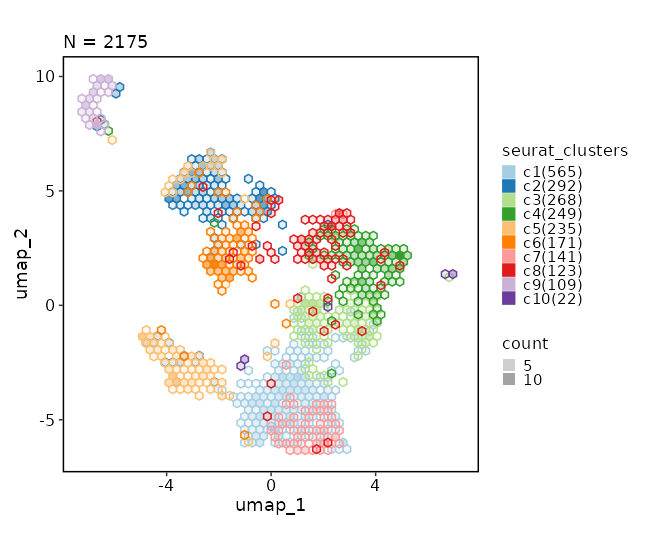
Dimensional reduction plot (with hex bins)
[SeuratClusterStats.envs.dimplots."Dimensional reduction plot (with hex bins)"]
hex = true
hex_bins = 50
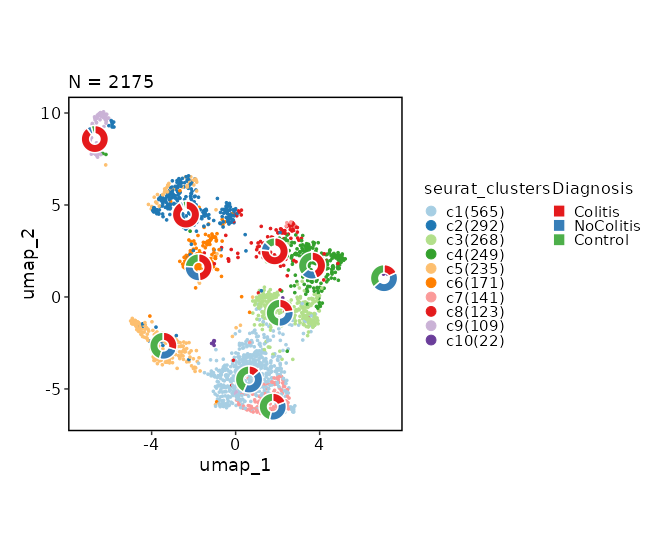
Dimensional reduction plot (with Diagnosis stats)
[SeuratClusterStats.envs.dimplots."Dimensional reduction plot (with Diagnosis stats)"]
stat_by = "Diagnosis"
stat_plot_type = "ring"
stat_plot_size = 0.15
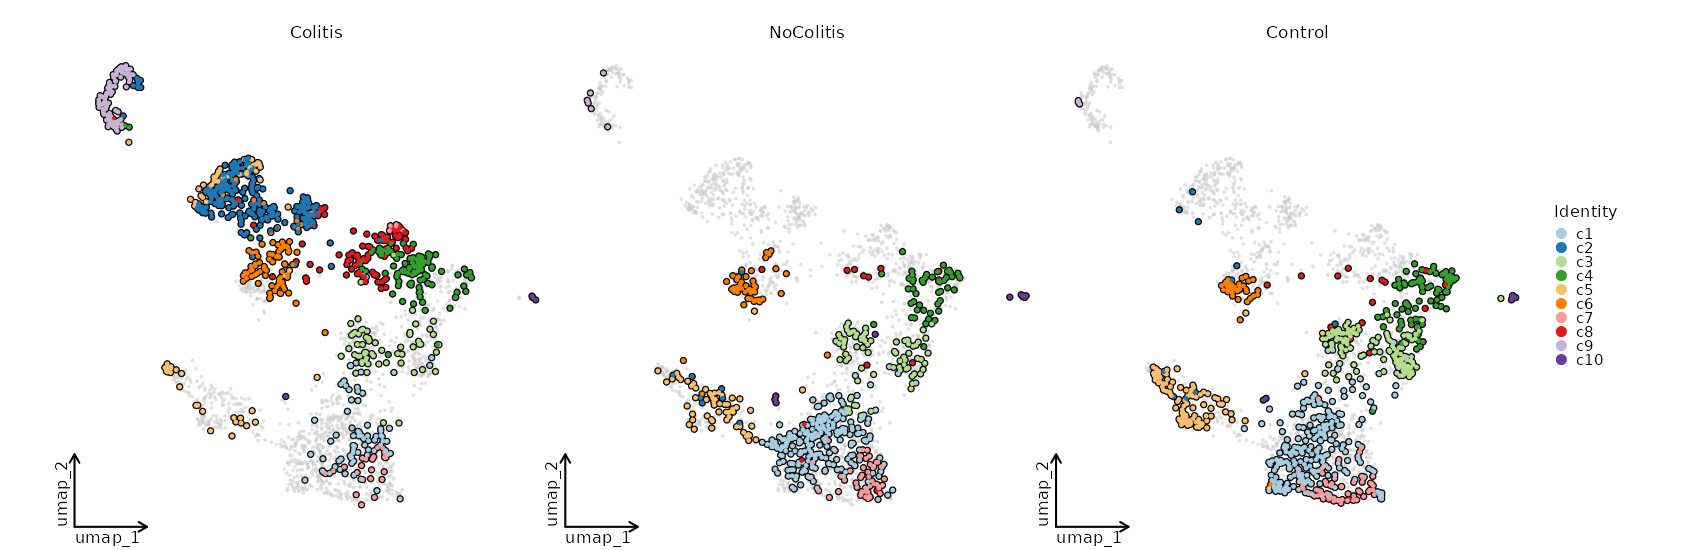
Dimensional reduction plot by Diagnosis
[SeuratClusterStats.envs.dimplots."Dimensional reduction plot by Diagnosis"]
facet_by = "Diagnosis"
highlight = true
theme = "theme_blank"