ScFGSEA
Gene set enrichment analysis for cells in different groups using fgsea
This process allows us to do Gene Set Enrichment Analysis (GSEA) on the expression data,
but based on variaties of grouping, including the from the meta data and the
scTCR-seq data as well.
The GSEA is done using the
fgsea package,
which allows to quickly and accurately calculate arbitrarily low GSEA P-values
for a collection of gene sets.
The fgsea package is based on the fast algorithm for preranked GSEA described in
Subramanian et al. 2005.
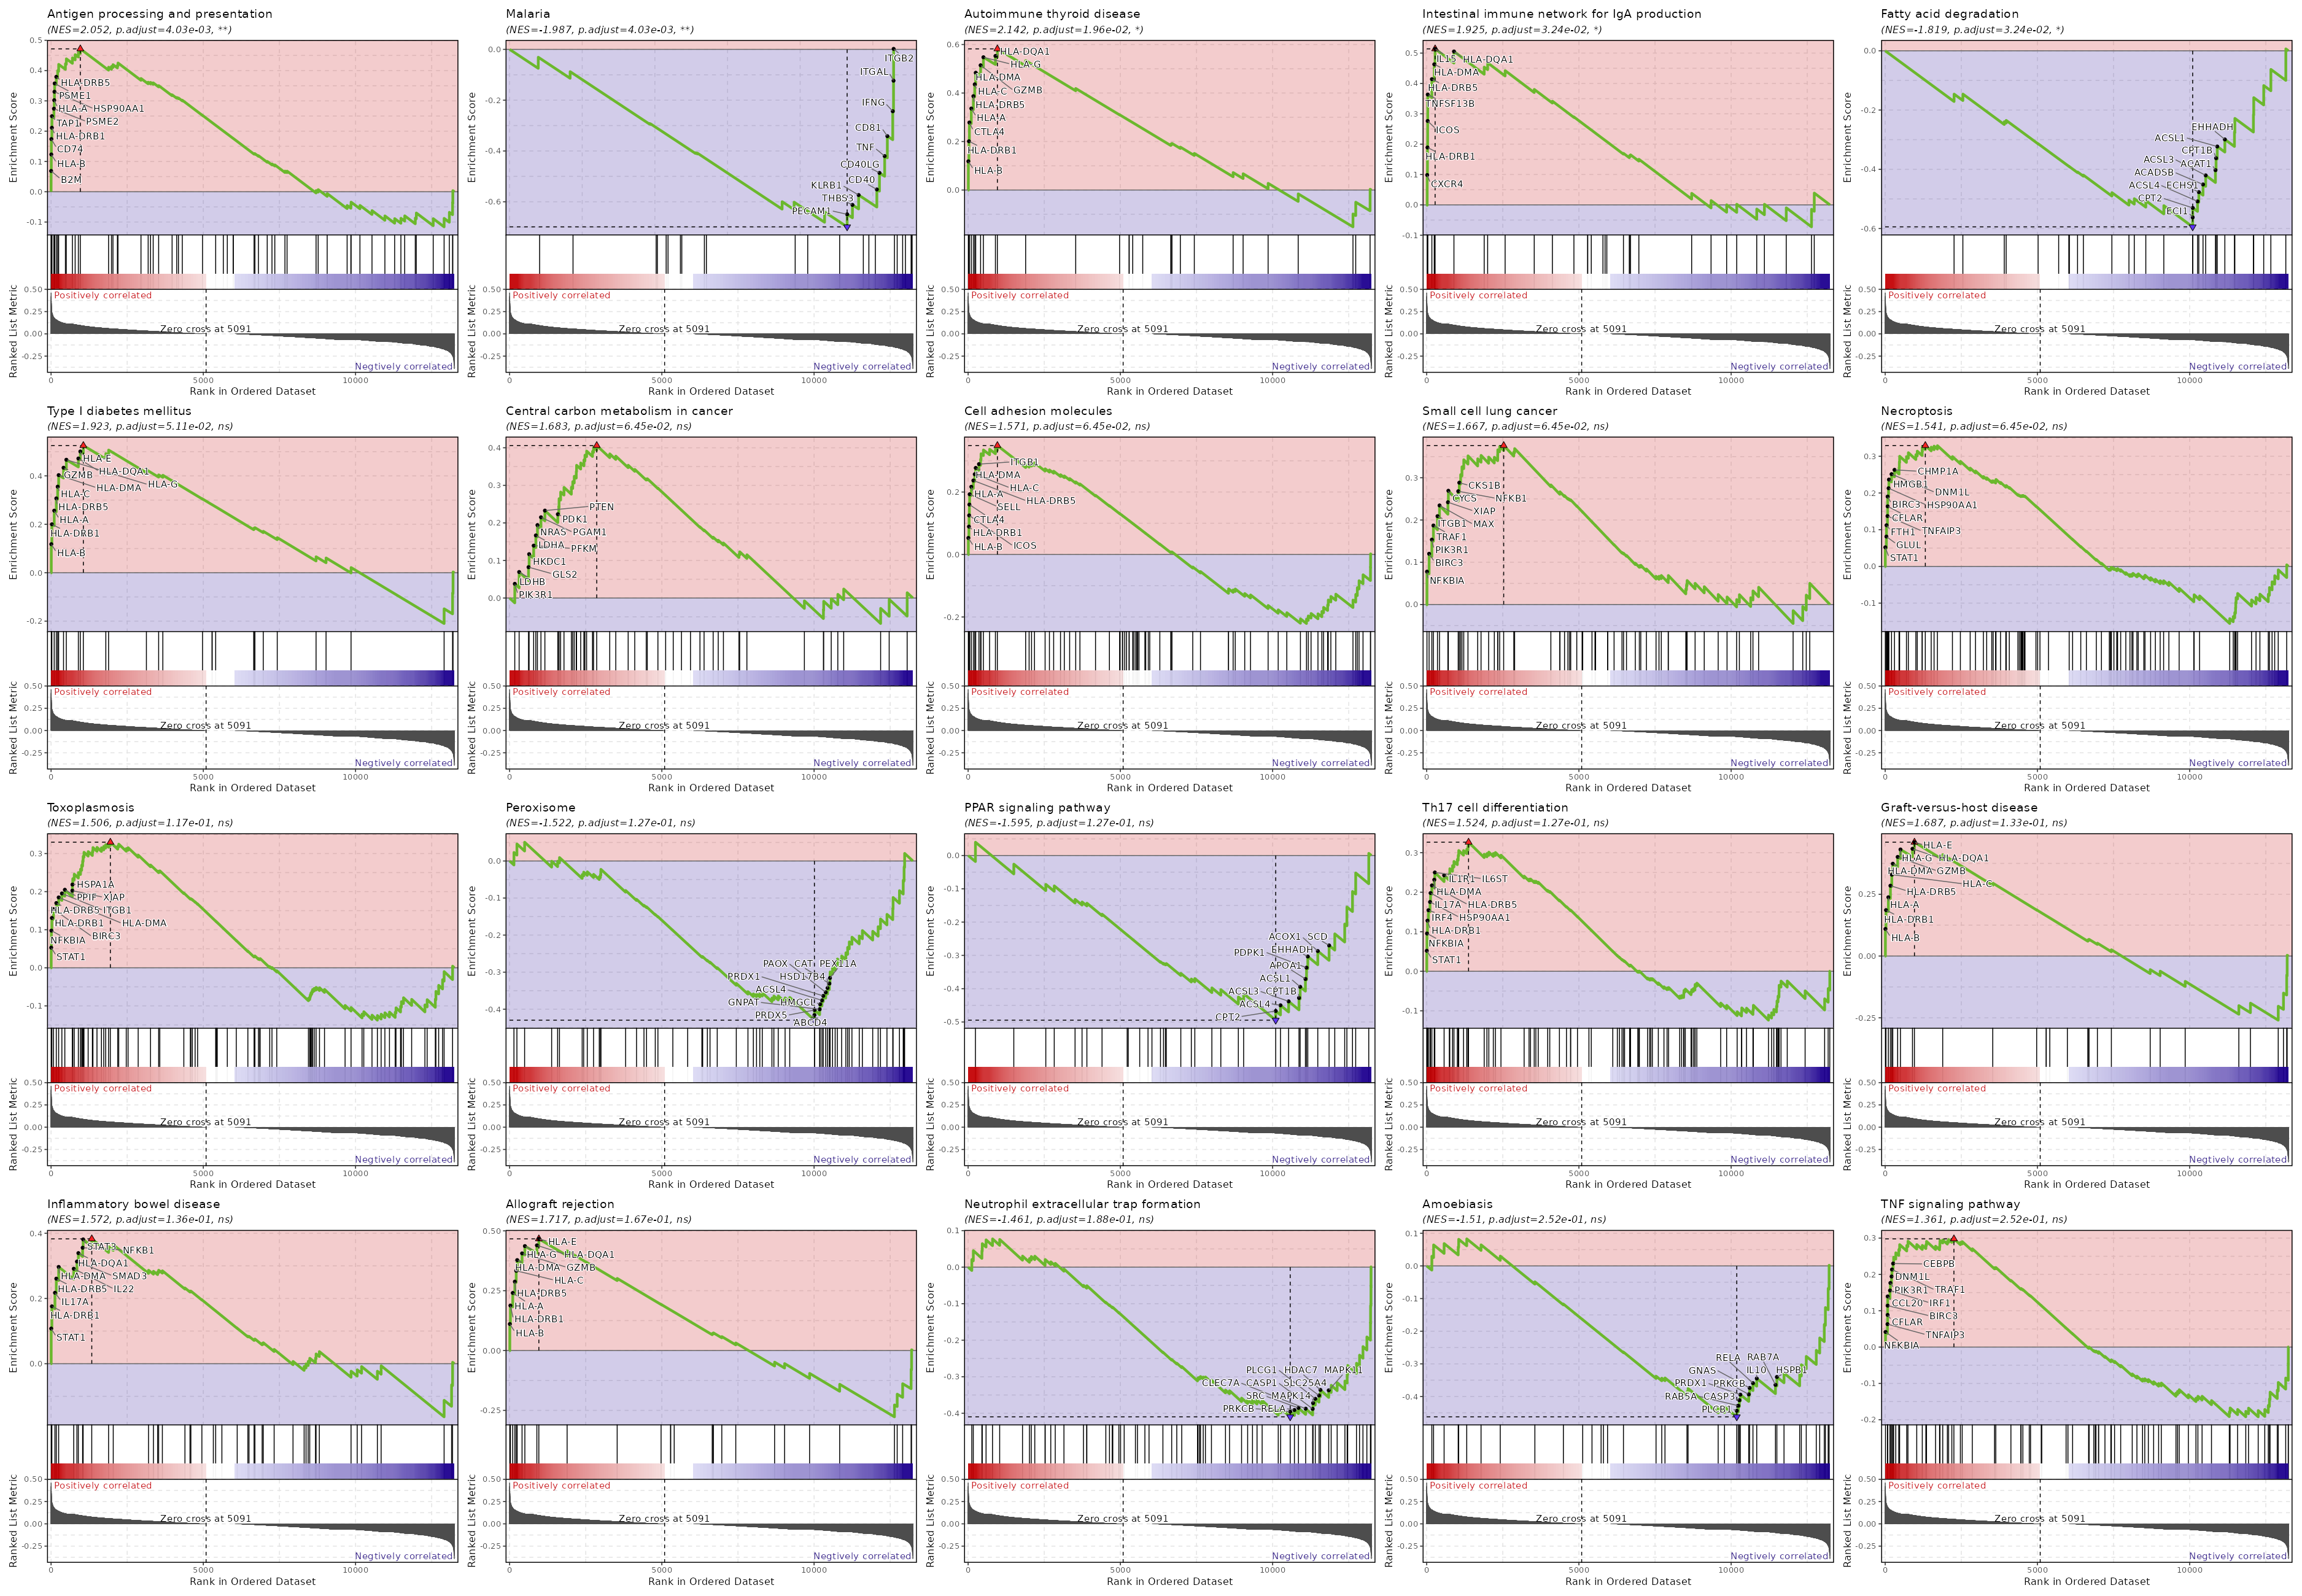
For each case, the process will generate a table with the enrichment scores for
each gene set, and GSEA plots for the top gene sets.
Input
srtobj: The seurat object in RDS format
Output
outdir: Default:{{(in.casefile or in.srtobj) | stem0}}.fgsea.
The output directory for the results and plots
Environment Variables
ncores(type=int): Default:1.
Number of cores for parallelization Passed tonprocoffgseaMultilevel().cache(type=auto): Default:/tmp.
Where to cache the results.
IfTrue, cache tooutdirof the job. IfFalse, don't cache.
Otherwise, specify the directory to cache to.-
mutaters(type=json): Default:{}.
The mutaters to mutate the metadata.
The key-value pairs will be passed thedplyr::mutate()to mutate the metadata.
You can also use the clone selectors to select the TCR clones/clusters.
See https://pwwang.github.io/scplotter/reference/clone_selectors.html. -
group_by: The column name in metadata to group the cells. ident_1: The first group of cells to compareident_2: The second group of cells to compare, if not provided, the rest of the cells that are notNAs ingroup_bycolumn are used forident_2.assay: The assay to use. If not provided, the default assay will be used.each: The column name in metadata to separate the cells into different subsets to do the analysis.subset: An expression to subset the cells.gmtfile: Default:KEGG_2021_Human.
The pathways in GMT format, with the gene names/ids in the same format as the seurat object.
You can use built-in dbs inenrichit, or provide your own gmt files.
See also https://pwwang.github.io/enrichit/reference/FetchGMT.html.
The built-in dbs include:- "BioCarta" or "BioCarta_2016"
- "GO_Biological_Process" or "GO_Biological_Process_2025"
- "GO_Cellular_Component" or "GO_Cellular_Component_2025"
- "GO_Molecular_Function" or "GO_Molecular_Function_2025"
- "KEGG", "KEGG_Human", "KEGG_2021", or "KEGG_2021_Human"
- "Hallmark", "MSigDB_Hallmark", or "MSigDB_Hallmark_2020"
- "Reactome", "Reactome_Pathways", or "Reactome_Pathways_2024"
- "WikiPathways", "WikiPathways_2024", "WikiPathways_Human", or "WikiPathways_2024_Human"
You can also fetch more dbs from https://maayanlab.cloud/Enrichr/#libraries.
method(choice): Default:s2n.
The method to do the preranking.signal_to_noise: Signal to noise.
The larger the differences of the means (scaled by the standard deviations); that is, the more distinct the gene expression is in each phenotype and the more the gene acts as a "class marker".s2n: Alias of signal_to_noise.abs_signal_to_noise: The absolute value of signal_to_noise.abs_s2n: Alias of abs_signal_to_noise.t_test: T test.
Uses the difference of means scaled by the standard deviation and number of samples.ratio_of_classes: Also referred to as fold change.
Uses the ratio of class means to calculate fold change for natural scale data.diff_of_classes: Difference of class means.
Uses the difference of class means to calculate fold change for nature scale datalog2_ratio_of_classes: Log2 ratio of class means.
Uses the log2 ratio of class means to calculate fold change for natural scale data.
This is the recommended statistic for calculating fold change for log scale data.
top(type=auto): Default:20.
Do gsea table and enrich plot for top N pathways.
If it is < 1, will apply it topadj, selecting pathways withpadj<top.eps(type=float): Default:0.
This parameter sets the boundary for calculating the p value.
See https://rdrr.io/bioc/fgsea/man/fgseaMultilevel.htmlalleach_plots_defaults(ns): Default options for the plots to generate for all pathways.plot_type: Default:heatmap.
The type of the plot, currently either dot or heatmap (default)devpars(ns): The device parameters for the plots.res(type=int): Default:100.
The resolution of the plots.height(type=int): The height of the plots.width(type=int): The width of the plots.
<more>: See https://pwwang.github.io/biopipen.utils.R/reference/VizGSEA.html.
alleach_plots(type=json): Default:{}.
Cases of the plots to generate for all pathways.
The keys are the names of the cases and the values are the dicts inherited fromalleach_plots_defaults.minsize(type=int): Default:10.
Minimal size of a gene set to test. All pathways below the threshold are excluded.maxsize(type=int): Default:100.
Maximal size of a gene set to test. All pathways above the threshold are excluded.rest(type=json;order=98): Default:{}.
Rest arguments forfgsea()See also https://rdrr.io/bioc/fgsea/man/fgseaMultilevel.htmlcases(type=json;order=99): Default:{}.
If you have multiple cases, you can specify them here.
The keys are the names of the cases and the values are the above options exceptmutaters.
If some options are not specified, the default values specified above will be used.
If no cases are specified, the default case will be added with the nameGSEA.
Examples
The summary and GSEA plots


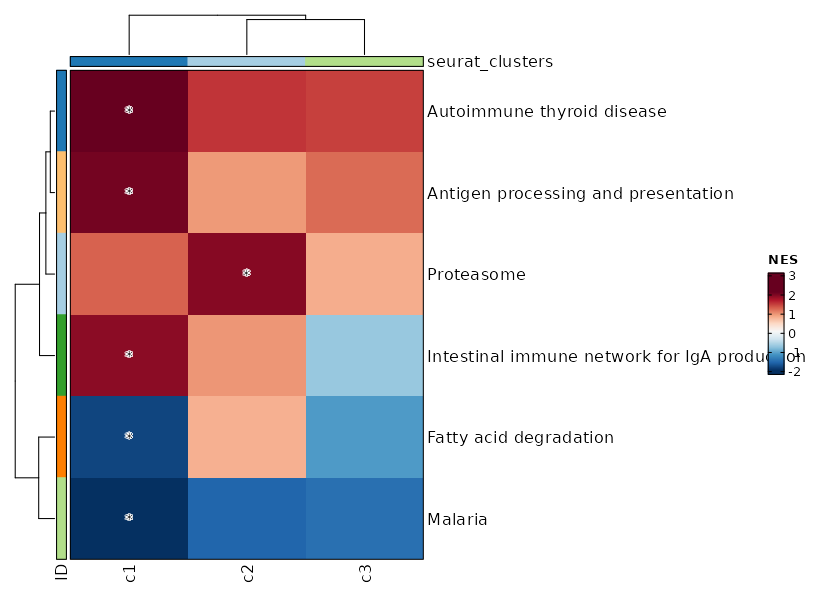
Summary plot for all subsets or idents
If you use each to separate the cells into different subsets, this is useful to
make a summary plot for all subsets. Or if you don't specify ident_1, the summary plot for all idents in group_by will be generated.
[ScFGSEA.envs]
group_by = "Diagnosis"
ident_1 = "Colitis"
ident_2 = "Control"
each = "seurat_clusters"

[ScFGSEA.envs.alleach_plots.Heatmap]
plot_type = "heatmap"
group_by = "Diagnosis"
