RadarPlots
Radar plots for cell proportion in different clusters.
This process generates the radar plots for the clusters of T cells.
It explores the proportion of cells in different groups (e.g. Tumor vs Blood)
in different T-cell clusters.
Input
srtobj: The seurat object in RDS format
Output
outdir: Default:{{in.srtobj | stem}}.radar_plots.
The output directory for the plots
Environment Variables
mutaters(type=json): Default:{}.
Mutaters to mutate the metadata of the seurat object. Keys are the column names and values are the expressions to mutate the columns. These new columns will be used to define your cases..
See alsomutating the metadata.by: Which column to use to separate the cells in different groups.
NAs will be ignored. For example, If you have a column namedSourcethat marks the source of the cells, and you want to separate the cells intoTumorandBloodgroups, you can setbytoSource.
The there will be two curves in the radar plot, one forTumorand one forBlood.each: A column with values to separate all cells in different cases When specified, the case will be expanded to multiple cases for each value in the column.
If specified,sectionwill be ignored, and the case name will be used as the section name.prefix_each(flag): Default:True.
Whether to prefix theeachcolumn name to the values as the case/section name.breakdown: An additional column with groups to break down the cells distribution in each cluster. For example, if you want to see the distribution of the cells in each cluster in different samples. In this case, you should have multiple values in eachby. These values won't be plotted in the radar plot, but a barplot will be generated with the mean value of each group and the error bar.test(choice): Default:wilcox.
The test to use to calculate the p values.
If there are more than 2 groups inby, the p values will be calculated pairwise group by group. Only works whenbreakdownis specified andbyhas 2 groups or more.wilcox: Wilcoxon rank sum testt: T testnone: No test will be performed
order(list): The order of the values inby. You can also limit (filter) the values we have inby. For example, if columnSourcehas valuesTumor,Blood,Spleen, and you only want to plotTumorandBlood, you can setorderto["Tumor", "Blood"].
This will also haveTumoras the first item in the legend andBloodas the second item.colors: The colors for the groups inby. If not specified, the default colors will be used.
Multiple colors can be separated by comma (,).
You can specifybiopipento use thebiopipenpalette.ident: Default:seurat_clusters.
The column name of the cluster information.cluster_order(list): Default:[].
The order of the clusters.
You may also use it to filter the clusters. If not given, all clusters will be used.
If the cluster names are integers, use them directly for the order, even though a prefixClusteris added on the plot.breaks(list;itype=int): Default:[].
breaks of the radar plots, from 0 to 100.
If not given, the breaks will be calculated automatically.direction(choice): Default:intra-cluster.
Direction to calculate the percentages.inter-cluster: the percentage of the cells in all groups in each cluster (percentage adds up to 1 for each cluster).intra-cluster: the percentage of the cells in all clusters.
(percentage adds up to 1 for each group).
section: Default:DEFAULT.
If you want to put multiple cases into a same section in the report, you can set this option to the name of the section.
Only used in the report.subset: The subset of the cells to do the analysis.bar_devpars(ns): The parameters forpng()for the barplotres(type=int): Default:100.
The resolution of the plotheight(type=int): Default:800.
The height of the plotwidth(type=int): Default:1200.
The width of the plot
devpars(ns): The parameters forpng()res(type=int): Default:100.
The resolution of the plotheight(type=int): Default:1000.
The height of the plotwidth(type=int): Default:1200.
The width of the plot
cases(type=json): Default:{}.
The cases for the multiple radar plots.
Keys are the names of the cases and values are the arguments for the plots (each,by,order,breaks,direction,ident,cluster_orderanddevpars).
If not cases are given, a default case will be used, with the keyDEFAULT.
The keys must be valid string as part of the file name.
Examples
Let's say we have a metadata like this:
| Cell | Source | Timepoint | seurat_clusters |
|---|---|---|---|
| A | Blood | Pre | 0 |
| B | Blood | Pre | 0 |
| C | Blood | Post | 1 |
| D | Blood | Post | 1 |
| E | Tumor | Pre | 2 |
| F | Tumor | Pre | 2 |
| G | Tumor | Post | 3 |
| H | Tumor | Post | 3 |
With configurations:
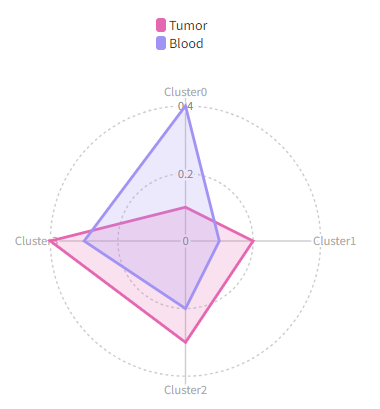
[RadarPlots.envs]
by = "Source"
Then we will have a radar plots like this:

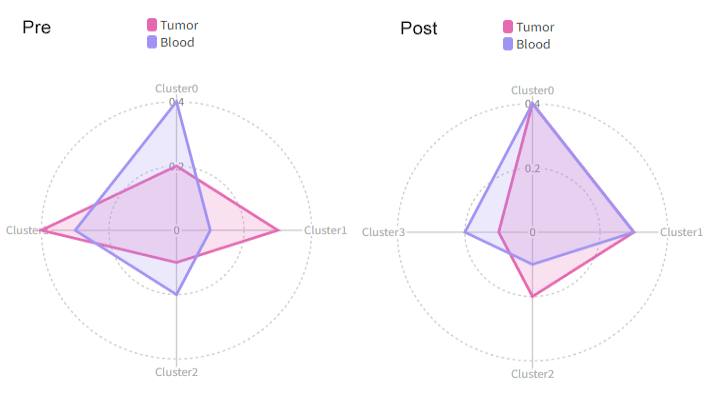
We can use each to separate the cells into different cases:
[RadarPlots.envs]
by = "Source"
each = "Timepoint"
Then we will have two radar plots, one for Pre and one for Post:

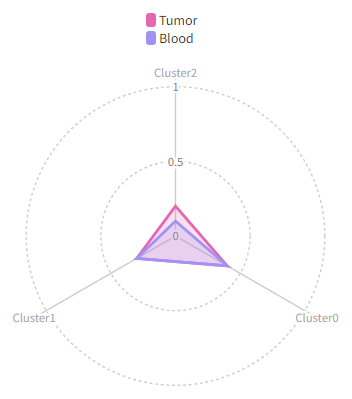
Using cluster_order to change the order of the clusters and show only the first 3 clusters:
[RadarPlots.envs]
by = "Source"
cluster_order = ["2", "0", "1"]
breaks = [0, 50, 100]  # also change the breaks

Attention
All the plots used in the examples are just for demonstration purpose. The real plots will have different appearance.