MetabolicPathwayActivity
This process calculates the pathway activities in different groups and subsets.
The cells are first grouped by subsets and then the metabolic activities are
examined for each groups in different subsets.
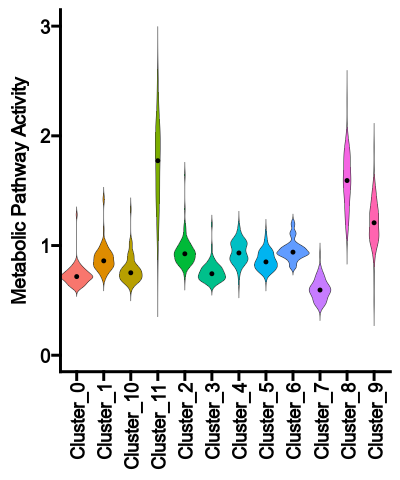
For each subset, a heatmap and a violin plot will be generated.
The heatmap shows the pathway activities for each group and each metabolic pathway
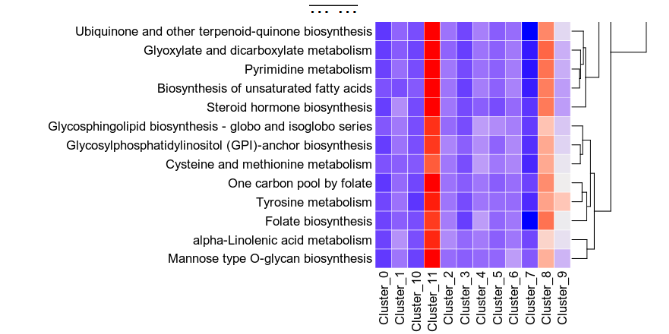
The violin plot shows the distribution of the pathway activities for each group
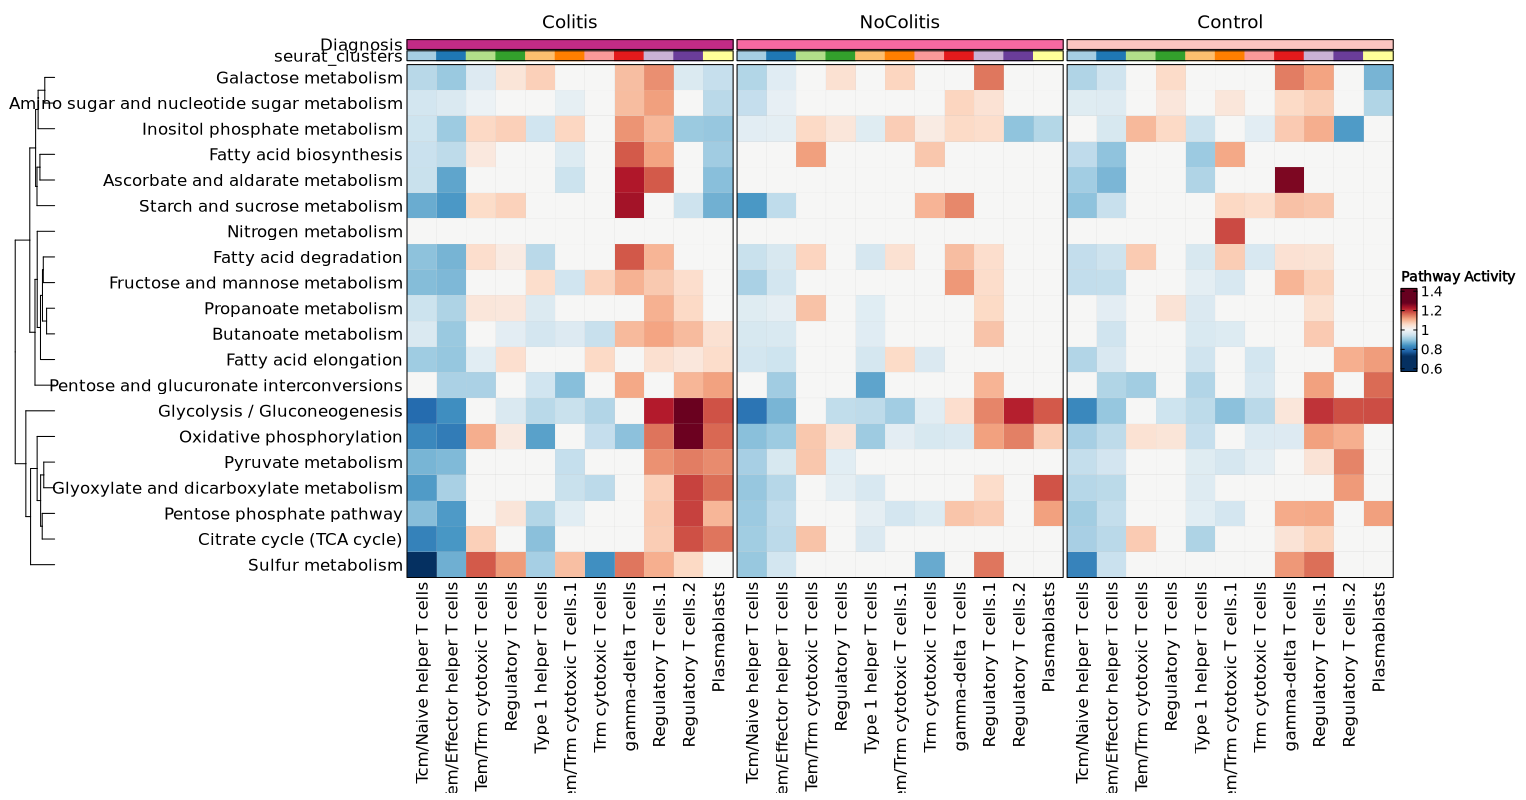
You may also have a merged heatmap to show all subsets in one plot.
Input
sobjfile: The Seurat object file.
It should be loaded as a Seurat object
Output
outdir: Default:{{in.sobjfile | stem}}.pathwayactivity.
The output directory.
It will contain the pathway activity score files and plots.
Environment Variables
ntimes(type=int): Default:5000.
Number of permutations to estimate the p-valuesncores(type=int;pgarg): Default:1.
Number of cores to use for parallelization Defaults toScrnaMetabolicLandscape.ncoresgmtfile(pgarg): The GMT file with the metabolic pathways.
Defaults toScrnaMetabolicLandscape.gmtfilesubset_by(pgarg;type=auto;readonly): Subset the data by the given column in the metadata. For example,Response.
NAvalues will be removed in this column.
Defaults toScrnaMetabolicLandscape.subset_byIf None, the data will not be subsetted.
Multiple columns can be provided as a list, which is helpful when subsets have overlapping cells.group_by(pgarg;readonly): Group the data by the given column in the metadata. For example,cluster.
Defaults toScrnaMetabolicLandscape.group_byplots(type=json): Default:{'Pathway Activity (violin plot)': Diot({'plot_type': 'violin', 'add_box': True, 'devpars': Diot({'res': 100})}), 'Pathway Activity (heatmap)': Diot({'plot_type': 'heatmap', 'devpars': Diot({'res': 100})})}.
The plots to generate.
Names will be used as the prefix for the output files. Values will be a dictionary with the following keys:plot_typeis the type of plot to generate. One ofheatmap,box,violinormerged_heatmap(all subsets in one plot).devparsis a dictionary with the device parameters for the plot.- Other arguments for
plotthis::Heatmap(),plotthis::BoxPlot()orplotthis::ViolinPlot(), depending on theplot_type.
cases(type=json): Default:{}.
Multiple cases for the analysis.
If you only have one case, you can specify the parameters directly toenvs.ntimes,envs.subset_by,envs.group_by,envs.group1,envs.group2, andenvs.plots. The name of the case will beenvs.subset_by.
If you have multiple cases, you can specify the parameters for each case in a dictionary. The keys will be the names of the cases and the values will be dictionaries with the parameters for each case, where the values will be inherited fromenvs.ntimes,envs.subset_by,envs.group_by,envs.group1,envs.group2, andenvs.plots.