CellCellCommunicationPlots
Visualization for cell-cell communication inference.
Input
cccfile: The output file fromCellCellCommunication
Output
outdir: Default:{{in.cccfile | stem}}_plots.
The output directory for the plots.
Environment Variables
subset: An expression to pass todplyr::filter()to subset the ccc data.magnitude: The column name in the data to use as the magnitude of the communication. By default, the second last column will be used.
Seeli.mt.show_methods()for the available methods in LIANA. or https://liana-py.readthedocs.io/en/latest/notebooks/basic_usage.html#Tileplotspecificity: The column name in the data to use as the specificity of the communication.
By default, the last column will be used. If the method doesn't have a specificity, set it to None.devpars(ns): The parameters for the plot.res(type=int): Default:100.
The resolution of the plotheight(type=int): The height of the plotwidth(type=int): The width of the plot
more_formats(type=list): Default:[].
The additional formats to save the plots.descr: Default:Cell-cell communication plot.
The description of the plot.cases(type=json): Default:{}.
The cases for the plots.
The keys are the names of the cases and the values are the arguments for the plots. The arguments include the ones inherited fromenvs.
You can have a specialplot_type"table"to generate a table for the ccc data to save as a text file and show in the report.
If no cases are given, a default case will be used, with the keyCell-Cell Communication.<more>: Other arguments passed to scplotter::CCCPlot
Examples
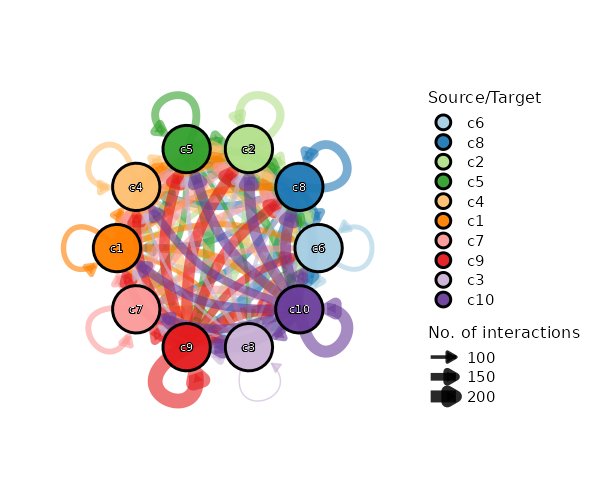
Network Plot
[CellCellCommunicationPlots.envs.cases."Cell-Cell Communication Network"]
plot_type = "network"
legend-position = "none"
theme = "theme_blank"
theme_args = {add_coord = false}
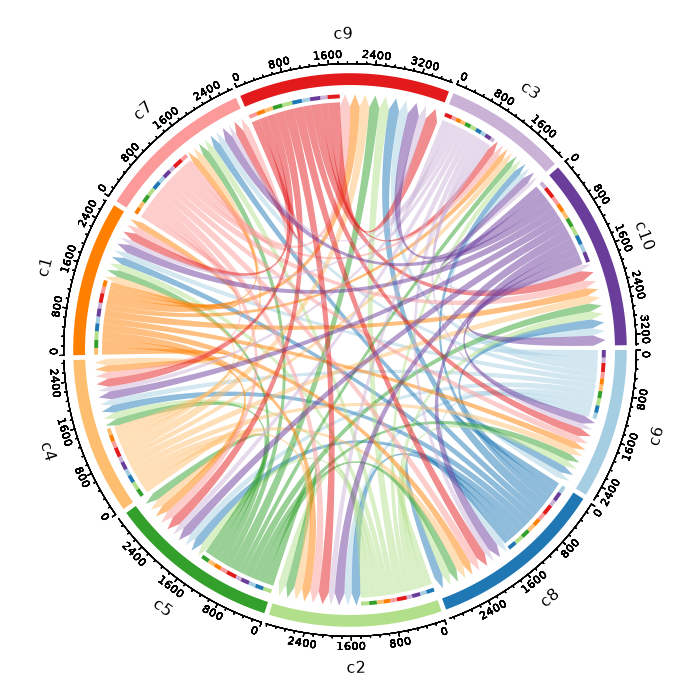
Circos Plot
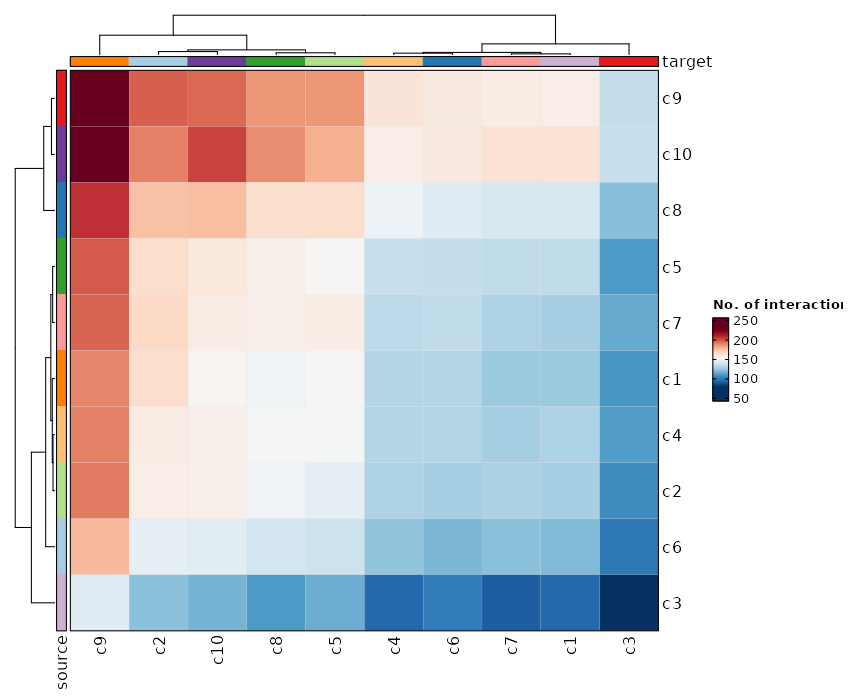
Heatmap Plot
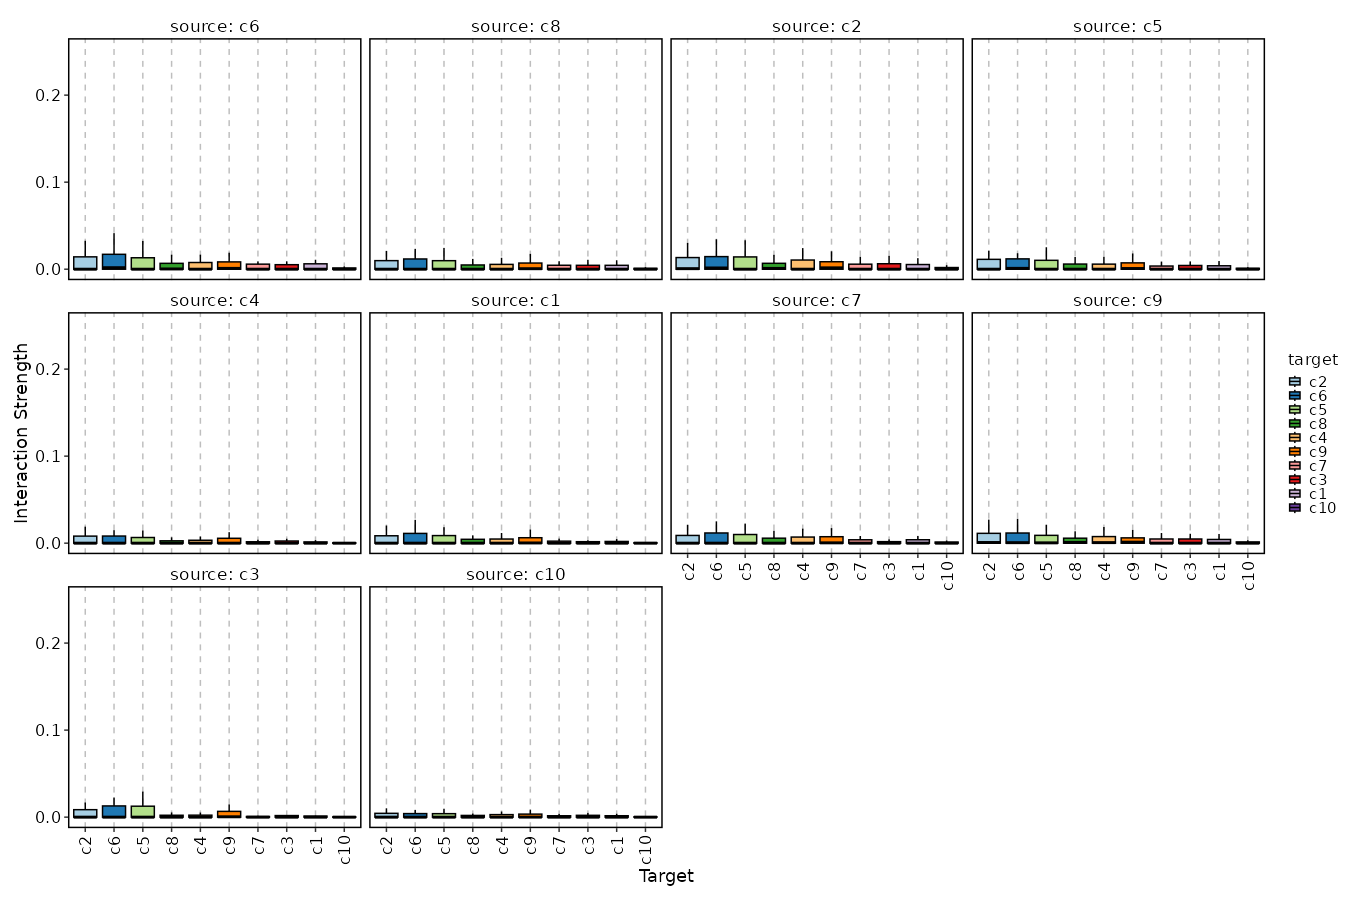
Cell-Cell Communication Interaction (Box Plot)
[CellCellCommunicationPlots.envs.cases."Cell-Cell Communication Interaction (Box Plot)"]
plot_type = "box"
x_text_angle = 90
method = "interaction"