"""Tools to analyze single-cell RNA"""
from pipen.utils import mark
from ..core.proc import Proc
from ..core.config import config
class SeuratLoading(Proc):DOCS
"""Seurat - Loading data
Deprecated, should be superseded by SeuratPreparing
Input:
metafile: The metadata of the samples
A tab-delimited file
Two columns are required:
- `Sample` to specify the sample names.
- `RNAData` to assign the path of the data to the samples
The path will be read by `Read10X()` from `Seurat`
Output:
rdsfile: The RDS file with a list of Seurat object
Envs:
qc: The QC filter for each sample.
This will be passed to `subset(obj, subset=<qc>)`.
For example
`nFeature_RNA > 200 & nFeature_RNA < 2500 & percent.mt < 5`
"""
input = "metafile:file"
output = "rdsfile:file:{{in.metafile | stem}}.seurat.RDS"
envs = {"qc": ""}
lang = config.lang.rscript
script = "file://../scripts/scrna/SeuratLoading.R"
class SeuratPreparing(Proc):DOCS
"""Load, prepare and apply QC to data, using `Seurat`
This process will -
- Prepare the seurat object
- Apply QC to the data
- Integrate the data from different samples
See also
- <https://satijalab.org/seurat/articles/pbmc3k_tutorial.html#standard-pre-processing-workflow-1)>
- <https://satijalab.org/seurat/articles/integration_introduction>
This process will read the scRNA-seq data, based on the information provided by
`SampleInfo`, specifically, the paths specified by the `RNAData` column.
The RNAData column should contain the path to the 10X, ParseBio data or HIVE data, either a directory or
a file If the path is a directory, the function will look for barcodes.tsv.gz, features.tsv.gz
and matrix.mtx.gz. The directory should be loaded by Seurat::Read10X, Seurat::ReadParseBio or
the HIVE data. Sometimes, there may be prefix in the file names, e.g. "'prefix'.barcodes.tsv.gz",
which is also supported. If the path is a file ending with ".loom", it will be loaded by
SeuratDisk::Connect() and converted to a Seurat object. Otherwise, if the path is a file,
it should be a h5 file that can be loaded by `Seurat::Read10X_h5()`.
Each sample will be loaded individually and then merged into one `Seurat` object, and then perform QC.
In order to perform QC, some additional columns are added to the meta data of the `Seurat` object. They are:
- `precent.mt`: The percentage of mitochondrial genes.
- `percent.ribo`: The percentage of ribosomal genes.
- `precent.hb`: The percentage of hemoglobin genes.
- `percent.plat`: The percentage of platelet genes.
For integration, two routes are available:
- [Performing integration on datasets normalized with `SCTransform`](https://satijalab.org/seurat/articles/seurat5_integration#perform-streamlined-one-line-integrative-analysis)
- [Using `NormalizeData` and `FindIntegrationAnchors`](https://satijalab.org/seurat/articles/seurat5_integration#layers-in-the-seurat-v5-object)
/// Note
When using `SCTransform`, the default Assay will be set to `SCT` in output, rather than `RNA`.
If you are using `cca` or `rpca` interation, the default assay will be `integrated`.
///
/// Note
From `biopipen` v0.23.0, this requires `Seurat` v5.0.0 or higher.
///
Input:
metafile: The metadata of the samples
A tab-delimited file
Two columns are required:
`Sample` to specify the sample names.
`RNAData` to assign the path of the data to the samples
The path will be read by `Read10X()` from `Seurat`, or the path
to the h5 file that can be read by `Read10X_h5()` from `Seurat`.
It can also be an RDS or qs2 file containing a `Seurat` object.
Note that it must has a column named `Sample` in the meta.data to specify the sample names.
Output:
outfile: The qs2 file with the Seurat object with all samples integrated.
Note that the cell ids are prefixied with sample names.
Envs:
ncores (type=int): Number of cores to use.
Used in `future::plan(strategy = "multicore", workers = <ncores>)`
to parallelize some Seurat procedures.
mutaters (type=json): The mutaters to mutate the metadata to the cells.
These new columns will be added to the metadata of the Seurat object and
will be saved in the output file.
See <https://pwwang.github.io/biopipen.utils.R/reference/MutateSeuratMeta.html>
min_cells (type=int): The minimum number of cells that a gene must be
expressed in to be kept. This is used in `Seurat::CreateSeuratObject()`.
Futher QC (`envs.cell_qc`, `envs.gene_qc`) will be performed after this.
It doesn't work when data is loaded from loom files or RDS/qs2 files.
min_features (type=int): The minimum number of features that a cell must
express to be kept. This is used in `Seurat::CreateSeuratObject()`.
Futher QC (`envs.cell_qc`, `envs.gene_qc`) will be performed after this.
It doesn't work when data is loaded from loom files or RDS/qs2 files.
features (type=auto): Features to rename. It can be a dict with the keys as
the original feature names and the values as the new feature names, or
file path to a two-column tab-delimited file (no header) with the first column as
the original feature names and the second column as the new feature names.
cell_qc: Filter expression to filter cells, using
`tidyrseurat::filter()`.
It can also be a dictionary of expressions, where the names of the list are
sample names.
You can have a default expression in the list with the name "DEFAULT" for
the samples that are not listed.
Available QC keys include `nFeature_RNA`, `nCount_RNA`,
`percent.mt`, `percent.ribo`, `percent.hb`, and `percent.plat`.
/// Tip | Example
Including the columns added above, all available QC keys include
`nFeature_RNA`, `nCount_RNA`, `percent.mt`, `percent.ribo`, `percent.hb`,
and `percent.plat`. For example:
```toml
[SeuratPreparing.envs]
cell_qc = "nFeature_RNA > 200 & percent.mt < 5"
```
will keep cells with more than 200 genes and less than 5%% mitochondrial
genes.
///
gene_qc (ns): Filter genes.
`gene_qc` is applied after `cell_qc`.
- min_cells: The minimum number of cells that a gene must be
expressed in to be kept.
- excludes: The genes to exclude. Multiple genes can be specified by
comma separated values, or as a list.
/// Tip | Example
```toml
[SeuratPreparing.envs]
gene_qc = { min_cells = 3 }
```
will keep genes that are expressed in at least 3 cells.
///
ccs_args (ns): Arguments for `RunSeuratCellCycleScoring()`.
When "S.Score" and/or "G2M.Score" are specified in `envs.SCTransform.vars-to-regress` when `envs.use_sct = TRUE`
or in `envs.ScaleData.vars-to-regress` when `envs.use_sct = FALSE`, this will be automatically enabled
to calculate the cell cycle scores and regress them out in the following transformation step.
Otherwise if this is empty, cell cycle scoring and the normalization before cell cycle scoring will be skipped.
- trans_args (ns): Arguments for `RunSeuratTransformation()` to normalize the data before cell cycle scoring.
`use_sct` will be `FALSE` by default (not using `envs.use_sct`).
See <https://github.com/satijalab/seurat/issues/7694>.
- <more>: See <https://pwwang.github.io/biopipen.utils.R/reference/RunSeuratTransformation.html>.
- <more>: See <https://pwwang.github.io/biopipen.utils.R/reference/RunSeuratCellCycleScoring.html>.
qc_plots (type=json): The plots for QC metrics.
It should be a json (or python dict) with the keys as the names of the plots and
the values also as dicts with the following keys:
* kind: The kind of QC. Either `gene` or `cell` (default).
* devpars: The device parameters for the plot. A dict with `res`, `height`, and `width`.
* more_formats: The formats to save the plots other than `png`.
* save_code: Whether to save the code to reproduce the plot.
* other arguments passed to
[`biopipen.utils::VizSeuratCellQC`](https://pwwang.github.io/biopipen.utils.R/reference/VizSeuratCellQC.html)
when `kind` is `cell` or
[`biopipen.utils::VizSeuratGeneQC`](https://pwwang.github.io/biopipen.utils.R/reference/VizSeuratGeneQC.html)
when `kind` is `gene`.
use_sct (flag): Whether use SCTransform routine to integrate samples or not.
Before the following procedures, the `RNA` layer will be split by samples.
If `False`, following procedures will be performed in the order:
* [`NormalizeData`](https://satijalab.org/seurat/reference/normalizedata).
* [`FindVariableFeatures`](https://satijalab.org/seurat/reference/findvariablefeatures).
* [`ScaleData`](https://satijalab.org/seurat/reference/scaledata).
See <https://satijalab.org/seurat/articles/seurat5_integration#layers-in-the-seurat-v5-object>
and <https://satijalab.org/seurat/articles/pbmc3k_tutorial.html>
If `True`, following procedures will be performed in the order:
* [`SCTransform`](https://satijalab.org/seurat/reference/sctransform).
See <https://satijalab.org/seurat/articles/seurat5_integration#perform-streamlined-one-line-integrative-analysis>
no_integration (flag): Whether to skip integration or not.
NormalizeData (ns): Arguments for [`NormalizeData()`](https://satijalab.org/seurat/reference/normalizedata).
`object` is specified internally, and `-` in the key will be replaced with `.`.
- <more>: See <https://satijalab.org/seurat/reference/normalizedata>
FindVariableFeatures (ns): Arguments for [`FindVariableFeatures()`](https://satijalab.org/seurat/reference/findvariablefeatures).
`object` is specified internally, and `-` in the key will be replaced with `.`.
- <more>: See <https://satijalab.org/seurat/reference/findvariablefeatures>
ScaleData (ns): Arguments for [`ScaleData()`](https://satijalab.org/seurat/reference/scaledata).
`object` and `features` is specified internally, and `-` in the key will be replaced with `.`.
- <more>: See <https://satijalab.org/seurat/reference/scaledata>
RunPCA (ns): Arguments for [`RunPCA()`](https://satijalab.org/seurat/reference/runpca).
`object` and `features` is specified internally, and `-` in the key will be replaced with `.`.
- npcs (type=int): The number of PCs to compute.
For each sample, `npcs` will be no larger than the number of columns - 1.
- <more>: See <https://satijalab.org/seurat/reference/runpca>
SCTransform (ns): Arguments for [`SCTransform()`](https://satijalab.org/seurat/reference/sctransform).
`object` is specified internally, and `-` in the key will be replaced with `.`.
- return-only-var-genes: Whether to return only variable genes.
- min_cells: The minimum number of cells that a gene must be expressed in to be kept.
A hidden argument of `SCTransform` to filter genes.
If you try to keep all genes in the `RNA` assay, you can set `min_cells` to `0` and
`return-only-var-genes` to `False`.
See <https://github.com/satijalab/seurat/issues/3598#issuecomment-715505537>
- <more>: See <https://satijalab.org/seurat/reference/sctransform>
IntegrateLayers (ns): Arguments for [`IntegrateLayers()`](https://satijalab.org/seurat/reference/integratelayers).
`object` is specified internally, and `-` in the key will be replaced with `.`.
When `use_sct` is `True`, `normalization-method` defaults to `SCT`.
- method (choice): The method to use for integration.
- CCAIntegration: Use `Seurat::CCAIntegration`.
- CCA: Same as `CCAIntegration`.
- cca: Same as `CCAIntegration`.
- RPCAIntegration: Use `Seurat::RPCAIntegration`.
- RPCA: Same as `RPCAIntegration`.
- rpca: Same as `RPCAIntegration`.
- HarmonyIntegration: Use `Seurat::HarmonyIntegration`.
- Harmony: Same as `HarmonyIntegration`.
- harmony: Same as `HarmonyIntegration`.
- FastMNNIntegration: Use `Seurat::FastMNNIntegration`.
- FastMNN: Same as `FastMNNIntegration`.
- fastmnn: Same as `FastMNNIntegration`.
- scVIIntegration: Use `Seurat::scVIIntegration`.
- scVI: Same as `scVIIntegration`.
- scvi: Same as `scVIIntegration`.
- <more>: See <https://satijalab.org/seurat/reference/integratelayers>
doublet_detector (choice): The doublet detector to use.
- none: Do not use any doublet detector.
- DoubletFinder: Use `DoubletFinder` to detect doublets.
- doubletfinder: Same as `DoubletFinder`.
- scDblFinder: Use `scDblFinder` to detect doublets.
- scdblfinder: Same as `scDblFinder`.
DoubletFinder (ns): Arguments to run [`DoubletFinder`](https://github.com/chris-mcginnis-ucsf/DoubletFinder).
See also <https://demultiplexing-doublet-detecting-docs.readthedocs.io/en/latest/DoubletFinder.html>.
- PCs (type=int): Number of PCs to use for 'doubletFinder' function.
- doublets (type=float): Number of expected doublets as a proportion of the pool size.
- pN (type=float): Number of doublets to simulate as a proportion of the pool size.
- ncores (type=int): Number of cores to use for `DoubletFinder::paramSweep`.
Set to `None` to use `envs.ncores`.
Since parallelization of the function usually exhausts memory, if big `envs.ncores` does not work
for `DoubletFinder`, set this to a smaller number.
scDblFinder (ns): Arguments to run [`scDblFinder`](https://rdrr.io/bioc/scDblFinder/man/scDblFinder.html).
- dbr (type=float): The expected doublet rate.
- ncores (type=int): Number of cores to use for `scDblFinder`.
Set to `None` to use `envs.ncores`.
- <more>: See <https://rdrr.io/bioc/scDblFinder/man/scDblFinder.html>.
cache (type=auto): Whether to cache the information at different steps.
If `True`, the seurat object will be cached in the job output directory, which will be not cleaned up when job is rerunning.
The cached seurat object will be saved as `<signature>.<kind>.RDS` file, where `<signature>` is the signature determined by
the input and envs of the process.
See <https://github.com/satijalab/seurat/issues/7849>, <https://github.com/satijalab/seurat/issues/5358> and
<https://github.com/satijalab/seurat/issues/6748> for more details also about reproducibility issues.
To not use the cached seurat object, you can either set `cache` to `False` or delete the cached file at
`<signature>.RDS` in the cache directory.
Requires:
r-seurat:
- check: {{proc.lang}} <(echo "library(Seurat)")
r-future:
- check: {{proc.lang}} <(echo "library(future)")
r-bracer:
- check: {{proc.lang}} <(echo "library(bracer)")
""" # noqa: E501
input = "metafile:file"
output = "outfile:file:{{in.metafile | stem}}.seurat.qs"
lang = config.lang.rscript
envs_depth = 4
envs = {
"ncores": config.misc.ncores,
"mutaters": {},
"min_cells": 0,
"min_features": 0,
"features": None,
"cell_qc": None, # "nFeature_RNA > 200 & percent.mt < 5",
"gene_qc": {"min_cells": 0, "excludes": []},
"ccs_args": {},
"qc_plots": {
"Violin Plots": {
"kind": "cell",
"plot_type": "violin",
"devpars": {"res": 100, "height": 600, "width": 1200},
},
"Scatter Plots": {
"kind": "cell",
"plot_type": "scatter",
"devpars": {"res": 100, "height": 800, "width": 1200},
},
"Ridge Plots": {
"kind": "cell",
"plot_type": "ridge",
"devpars": {"res": 100, "height": 800, "width": 1200},
},
"Distribution of number of cells a gene is expressed in": {
"kind": "gene",
"plot_type": "histogram",
"devpars": {"res": 100, "height": 1200, "width": 1200},
},
},
"use_sct": False,
"no_integration": False,
"NormalizeData": {},
"FindVariableFeatures": {},
"ScaleData": {},
"RunPCA": {},
"SCTransform": {
"return-only-var-genes": False,
"min_cells": 3,
"verbose": True,
},
"IntegrateLayers": {"method": "harmony"},
"doublet_detector": "none",
"DoubletFinder": {"PCs": 10, "pN": 0.25, "doublets": 0.075, "ncores": 1},
"scDblFinder": {"dbr": 0.075, "ncores": 1},
"cache": config.path.tmpdir,
}
script = "file://../scripts/scrna/SeuratPreparing.R"
plugin_opts = {
"report": "file://../reports/common.svelte",
}
class SeuratClustering(Proc):DOCS
"""Determine the clusters of cells without reference using Seurat FindClusters
procedure.
Input:
srtobj: The seurat object loaded by SeuratPreparing
Output:
outfile: The seurat object with cluster information at `seurat_clusters` or
the name specified by `envs.ident`
Envs:
ncores (type=int;order=-100): Number of cores to use.
Used in `future::plan(strategy = "multicore", workers = <ncores>)`
to parallelize some Seurat procedures.
See also: <https://satijalab.org/seurat/articles/future_vignette.html>
ident: The name in the metadata to save the cluster labels.
A shortcut for `envs["FindClusters"]["cluster.name"]`.
python: The path to the python executable where `umap-learn` is installed.
Needed for `RunUMAP` when `umap.method` is set to `umap-learn`.
RunUMAP (ns): Arguments for [`RunUMAP()`](https://satijalab.org/seurat/reference/runumap).
`object` is specified internally, and `-` in the key will be replaced with `.`.
`dims=N` will be expanded to `dims=1:N`; The maximal value of `N` will be the minimum of `N` and the number of columns - 1 for each sample.
You can also specify `features` instead of `dims` to use specific features for UMAP. It can be
a list with the following fields: `order` (the order of the markers to use for UMAP, e.g. "desc(abs(avg_log2FC))", and
`n` (the number of total features to use for UMAP, e.g. 30).
If `features` is a list, it will run `biopipen.utils::RunSeuratDEAnalysis` to get the markers
for each group, and then select the top `n`/`ngroups` features for each group based on the `order` field.
If `features` is a numeric value, it will be treated as the `n` field
in the list above, with the default `order` being "desc(abs(avg_log2FC))".
- dims (type=int): The number of PCs to use
- reduction: The reduction to use for UMAP.
If not provided, `sobj@misc$integrated_new_reduction` will be used.
- <more>: See <https://satijalab.org/seurat/reference/runumap>
RunPCA (ns): Arguments for [`RunPCA()`](https://satijalab.org/seurat/reference/runpca).
FindNeighbors (ns): Arguments for [`FindNeighbors()`](https://satijalab.org/seurat/reference/findneighbors).
`object` is specified internally, and `-` in the key will be replaced with `.`.
- reduction: The reduction to use.
If not provided, `sobj@misc$integrated_new_reduction` will be used.
- <more>: See <https://satijalab.org/seurat/reference/findneighbors>
FindClusters (ns): Arguments for [`FindClusters()`](https://satijalab.org/seurat/reference/findclusters).
`object` is specified internally, and `-` in the key will be replaced with `.`.
The cluster labels will be saved in cluster names and prefixed with "c".
The first cluster will be "c1", instead of "c0".
- resolution (type=auto): The resolution of the clustering. You can have multiple resolutions as a list or as a string separated by comma.
Ranges are also supported, for example: `0.1:0.5:0.1` will generate `0.1, 0.2, 0.3, 0.4, 0.5`. The step can be omitted, defaulting to 0.1.
The results will be saved in `<ident>_<resolution>`.
The final resolution will be used to define the clusters at `<ident>`.
- <more>: See <https://satijalab.org/seurat/reference/findclusters>
cache (type=auto): Where to cache the information at different steps.
If `True`, the seurat object will be cached in the job output directory, which will be not cleaned up when job is rerunning.
Set to `False` to not cache the results.
Requires:
r-seurat:
- check: {{proc.lang}} <(echo "library(Seurat)")
r-tidyr:
- check: {{proc.lang}} <(echo "library(tidyr)")
r-dplyr:
- check: {{proc.lang}} <(echo "library(dplyr)")
""" # noqa: E501
input = "srtobj:file"
output = "outfile:file:{{in.srtobj | stem}}.qs"
lang = config.lang.rscript
envs = {
"ncores": config.misc.ncores,
"ident": "seurat_clusters",
"python": config.lang.python,
"RunPCA": {},
"RunUMAP": {},
"FindNeighbors": {},
"FindClusters": {"resolution": 0.8},
"cache": config.path.tmpdir,
}
script = "file://../scripts/scrna/SeuratClustering.R"
class SeuratSubClustering(Proc):DOCS
"""Find clusters of a subset of cells.
It's unlike [`Seurat::FindSubCluster`], which only finds subclusters of a single
cluster. Instead, it will perform the whole clustering procedure on the subset of
cells. One can use metadata to specify the subset of cells to perform clustering on.
For the subset of cells, the reductions will be re-performed on the subset of cells,
and then the clustering will be performed on the subset of cells. The reduction
will be saved in `object@reduction$<casename>.<reduction>` of the original object and the
clustering will be saved in the metadata of the original object using the casename
as the column name.
Input:
srtobj: The seurat object in RDS or qs/qs2 format.
Output:
outfile: The seurat object with the subclustering information in qs/qs2 format.
Envs:
ncores (type=int;order=-100): Number of cores to use.
Used in `future::plan(strategy = "multicore", workers = <ncores>)`
to parallelize some Seurat procedures.
python: The path to the python executable where `umap-learn` is installed.
Needed for `RunUMAP` when `umap.method` is set to `umap-learn`.
mutaters (type=json): The mutaters to mutate the metadata to subset the cells.
The mutaters will be applied in the order specified.
See <https://pwwang.github.io/biopipen.utils.R/reference/MutateSeuratMeta.html>
subset: An expression to subset the cells, will be passed to
[`tidyseurat::filter()`](https://stemangiola.github.io/tidyseurat/reference/filter.html).
RunPCA (ns): Arguments for [`RunPCA()`](https://satijalab.org/seurat/reference/runpca).
`object` is specified internally as the subset object, and `-` in the key will be replaced with `.`.
- <more>: See <https://satijalab.org/seurat/reference/runpca>
RunUMAP (ns): Arguments for [`RunUMAP()`](https://satijalab.org/seurat/reference/runumap).
`object` is specified internally as the subset object, and `-` in the key will be replaced with `.`.
`dims=N` will be expanded to `dims=1:N`; The maximal value of `N` will be the minimum of `N` and the number of columns - 1 for each sample.
You can also specify `features` instead of `dims` to use specific features for UMAP. It can be
a list with the following fields: `order` (the order of the markers to use for UMAP, e.g. "desc(abs(avg_log2FC))", and
`n` (the number of total features to use for UMAP, e.g. 30).
If `features` is a list, it will run `biopipen.utils::RunSeuratDEAnalysis` to get the markers
for each group, and then select the top `n`/`ngroups` features for each group based on the `order` field.
If `features` is a numeric value, it will be treated as the `n` field
in the list above, with the default `order` being "desc(abs(avg_log2FC))".
- dims (type=int): The number of PCs to use
- reduction: The reduction to use for UMAP.
If not provided, `sobj@misc$integrated_new_reduction` will be used.
- <more>: See <https://satijalab.org/seurat/reference/runumap>
FindNeighbors (ns): Arguments for [`FindNeighbors()`](https://satijalab.org/seurat/reference/findneighbors).
`object` is specified internally, and `-` in the key will be replaced with `.`.
- reduction: The reduction to use.
If not provided, `object@misc$integrated_new_reduction` will be used.
- <more>: See <https://satijalab.org/seurat/reference/findneighbors>
FindClusters (ns): Arguments for [`FindClusters()`](https://satijalab.org/seurat/reference/findclusters).
`object` is specified internally, and `-` in the key will be replaced with `.`.
The cluster labels will be prefixed with "s". The first cluster will be "s1", instead of "s0".
- resolution (type=auto): The resolution of the clustering. You can have multiple resolutions as a list or as a string separated by comma.
Ranges are also supported, for example: `0.1:0.5:0.1` will generate `0.1, 0.2, 0.3, 0.4, 0.5`. The step can be omitted, defaulting to 0.1.
The results will be saved in `<casename>_<resolution>`.
The final resolution will be used to define the clusters at `<casename>`.
- <more>: See <https://satijalab.org/seurat/reference/findclusters>
cache (type=auto): Whether to cache the results.
If `True`, the seurat object will be cached in the job output directory, which will be not cleaned up when job is rerunning.
Set to `False` to not cache the results.
cases (type=json): The cases to perform subclustering.
Keys are the names of the cases and values are the dicts inherited from `envs` except `mutaters` and `cache`.
If empty, a case with name `subcluster` will be created with default parameters.
The case name will be passed to `biopipen.utils::SeuratSubCluster()` as `name`.
It will be used as the prefix for the reduction name, keys and cluster names.
For reduction keys, it will be `toupper(<name>)` + "PC_" and `toupper(<name>)` + "UMAP_".
For cluster names, it will be `<name>` + "." + resolution.
And the final cluster name will be `<name>`.
Note that the `name` should be alphanumeric and anything other than alphanumeric will be removed.
""" # noqa: E501
input = "srtobj:file"
output = "outfile:file:{{in.srtobj | stem}}.qs"
lang = config.lang.rscript
envs_depth = 1
envs = {
"ncores": config.misc.ncores,
"mutaters": {},
"python": config.lang.python,
"subset": None,
"RunPCA": {},
"RunUMAP": {},
"FindNeighbors": {},
"FindClusters": {"resolution": 0.8},
"cache": config.path.tmpdir,
"cases": {},
}
script = "file://../scripts/scrna/SeuratSubClustering.R"
class SeuratClusterStats(Proc):DOCS
"""Statistics of the clustering.
Including the number/fraction of cells in each cluster, the gene expression values
and dimension reduction plots. It's also possible to perform stats on
TCR clones/clusters or other metadata for each T-cell cluster.
Examples:
### Clustree Plot
```toml
[SeuratClusterStats.envs.clustrees."Clustree Plot"]
prefix = "seurat_clusters"
devpars = {height = 500}
```
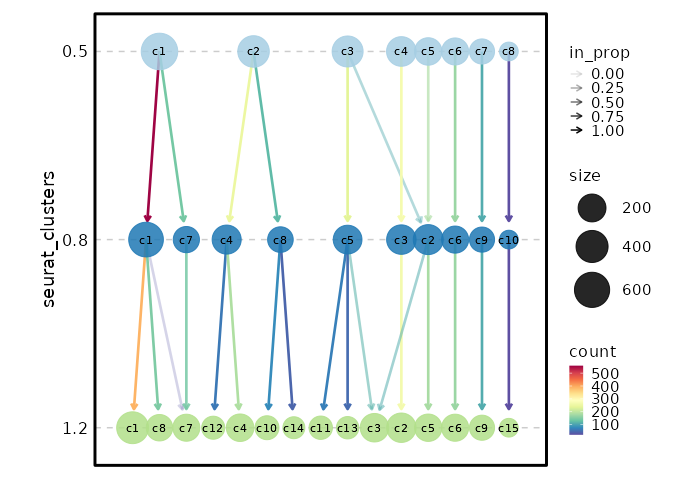{: width="80%" }
### Number of cells in each cluster (Bar Chart)
```toml
[SeuratClusterStats.envs.stats."Number of cells in each cluster (Bar Chart)"]
plot_type = "bar"
x_text_angle = 90
```
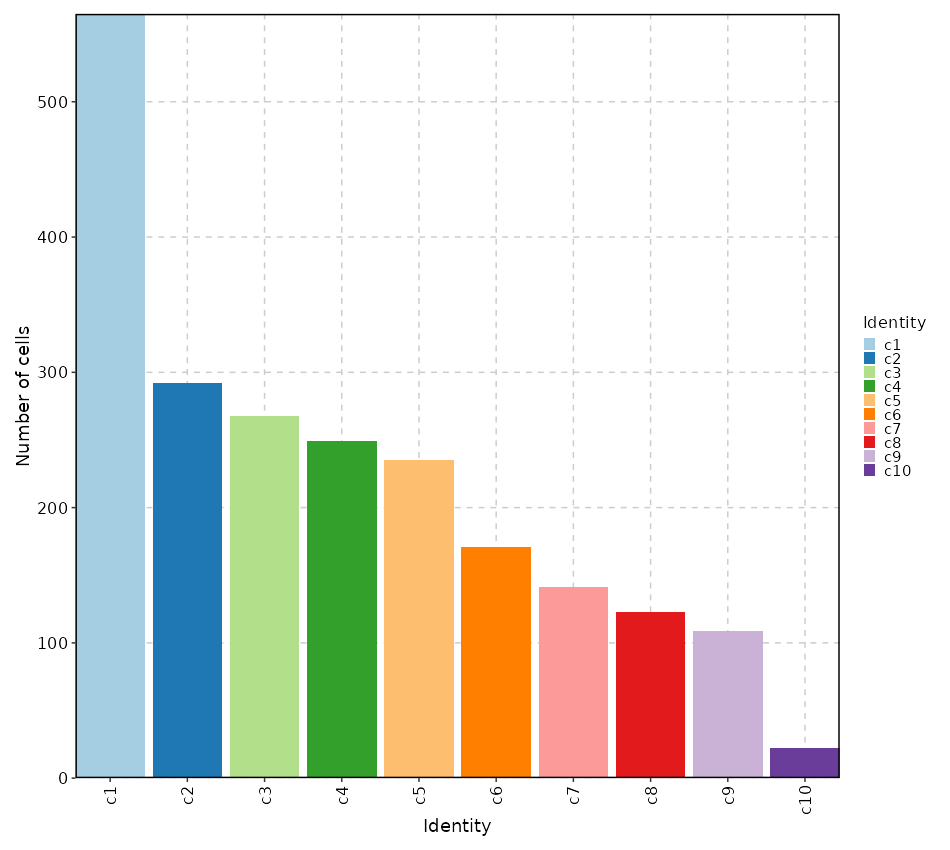{: width="80%" }
### Number of cells in each cluster by Sample (Bar Chart)
```toml
[SeuratClusterStats.envs.stats."Number of cells in each cluster by Sample (Bar Chart)"]
plot_type = "bar"
group_by = "Sample"
x_text_angle = 90
```
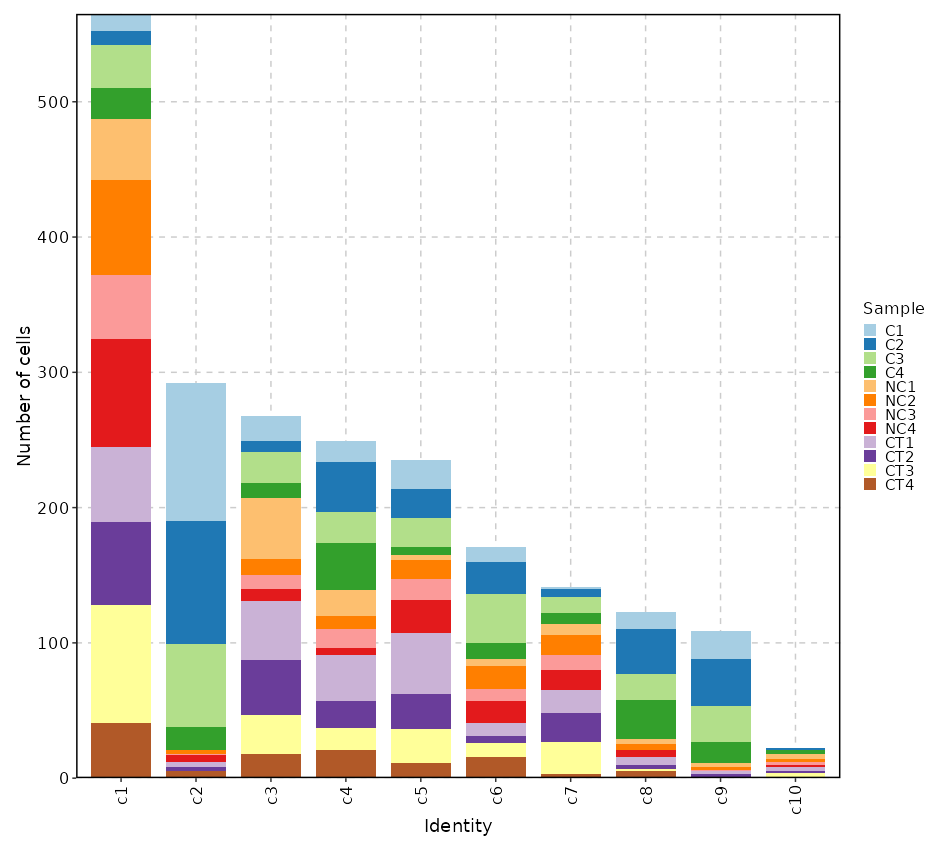{: width="80%" }
### Number of cells in each cluster by Diagnosis
```toml
[SeuratClusterStats.envs.stats."Number of cells in each cluster by Diagnosis"]
plot_type = "bar"
group_by = "Diagnosis"
frac = "group"
x_text_angle = 90
swap = true
position = "stack"
```
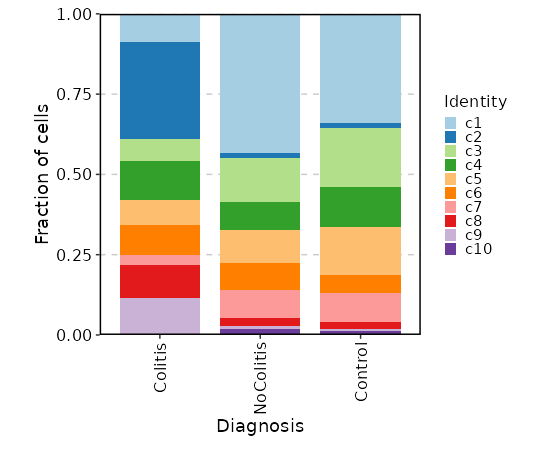{: width="80%" }
### Number of cells in each cluster by Diagnosis (Circos Plot)
```toml
[SeuratClusterStats.envs.stats."Number of cells in each cluster by Diagnosis (Circos Plot)"]
plot_type = "circos"
group_by = "Diagnosis"
```
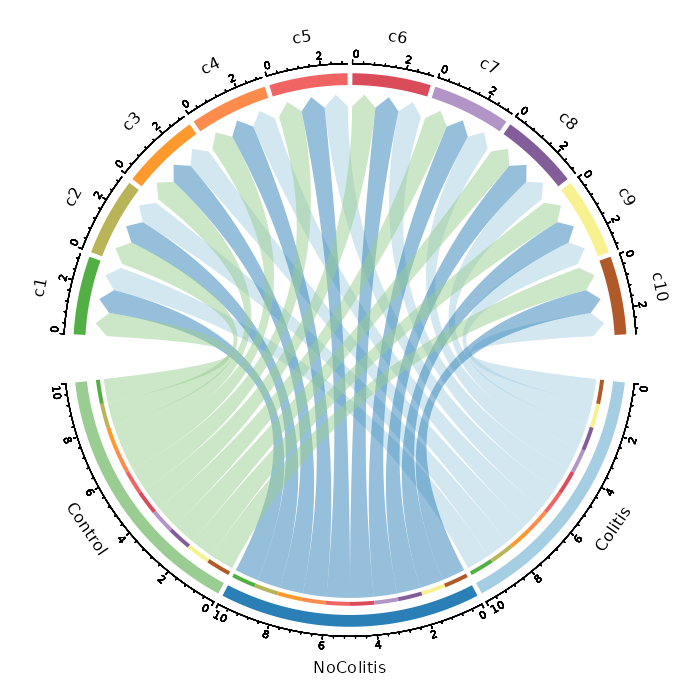{: width="80%" }
### Number of cells in each cluster by Diagnosis (Sankey Plot)
```toml
[SeuratClusterStats.envs.stats."Number of cells in each cluster by Diagnosis (Sankey Plot)"]
plot_type = "sankey"
group_by = ["seurat_clusters", "Diagnosis"]
links_alpha = 0.6
devpars = {width = 800}
```
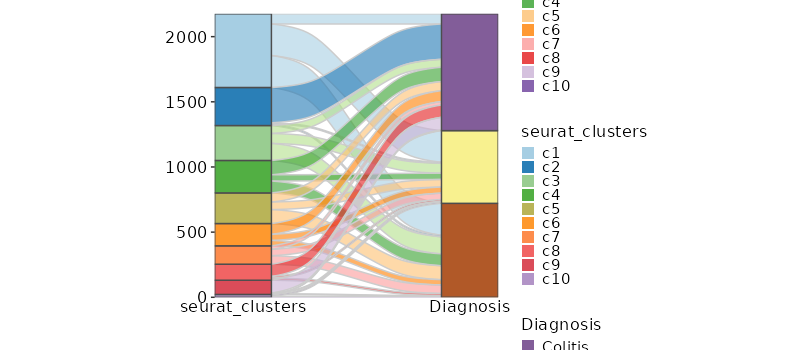{: width="80%" }
### Number of cells in each cluster by Sample (Spider Plot)
```toml
[SeuratClusterStats.envs.stats."Number of cells in each cluster by Sample (Spider Plot)"]
plot_type = "spider"
group_by = "Diagnosis"
palette = "Set1"
```
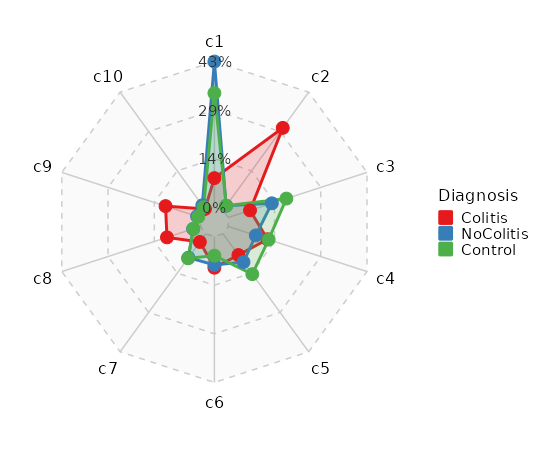{: width="80%" }
### Number of genes detected in each cluster
```toml
[SeuratClusterStats.envs.ngenes."Number of genes detected in each cluster"]
plot_type = "violin"
add_box = true
add_point = true
```
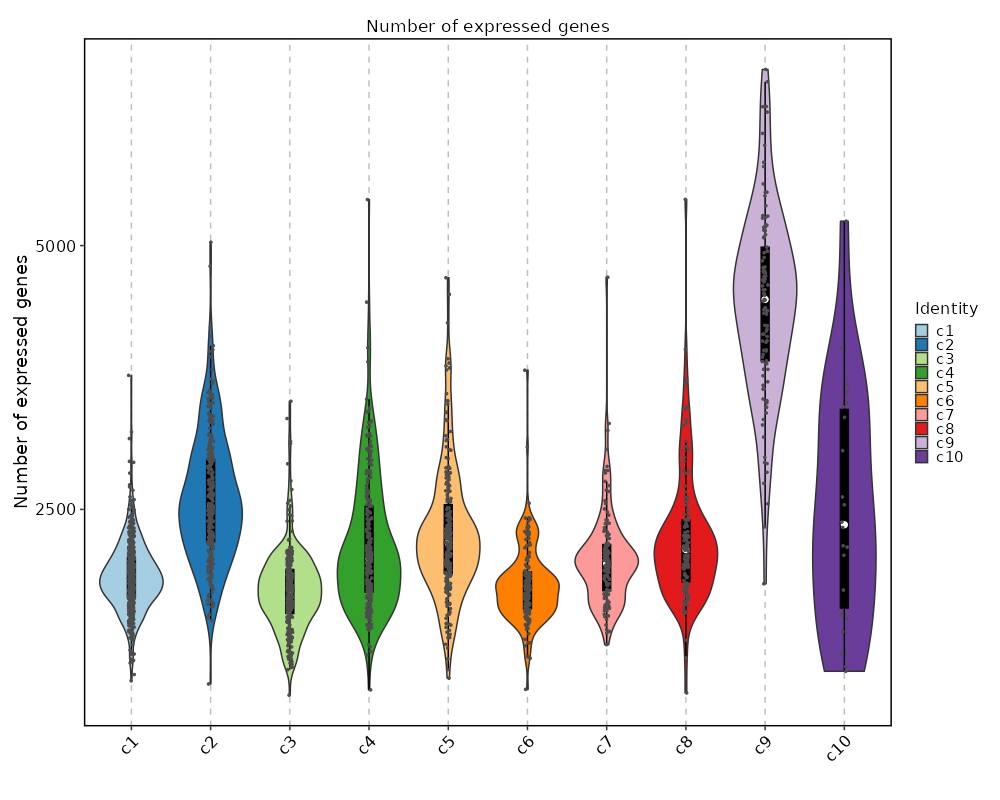{: width="80%" }
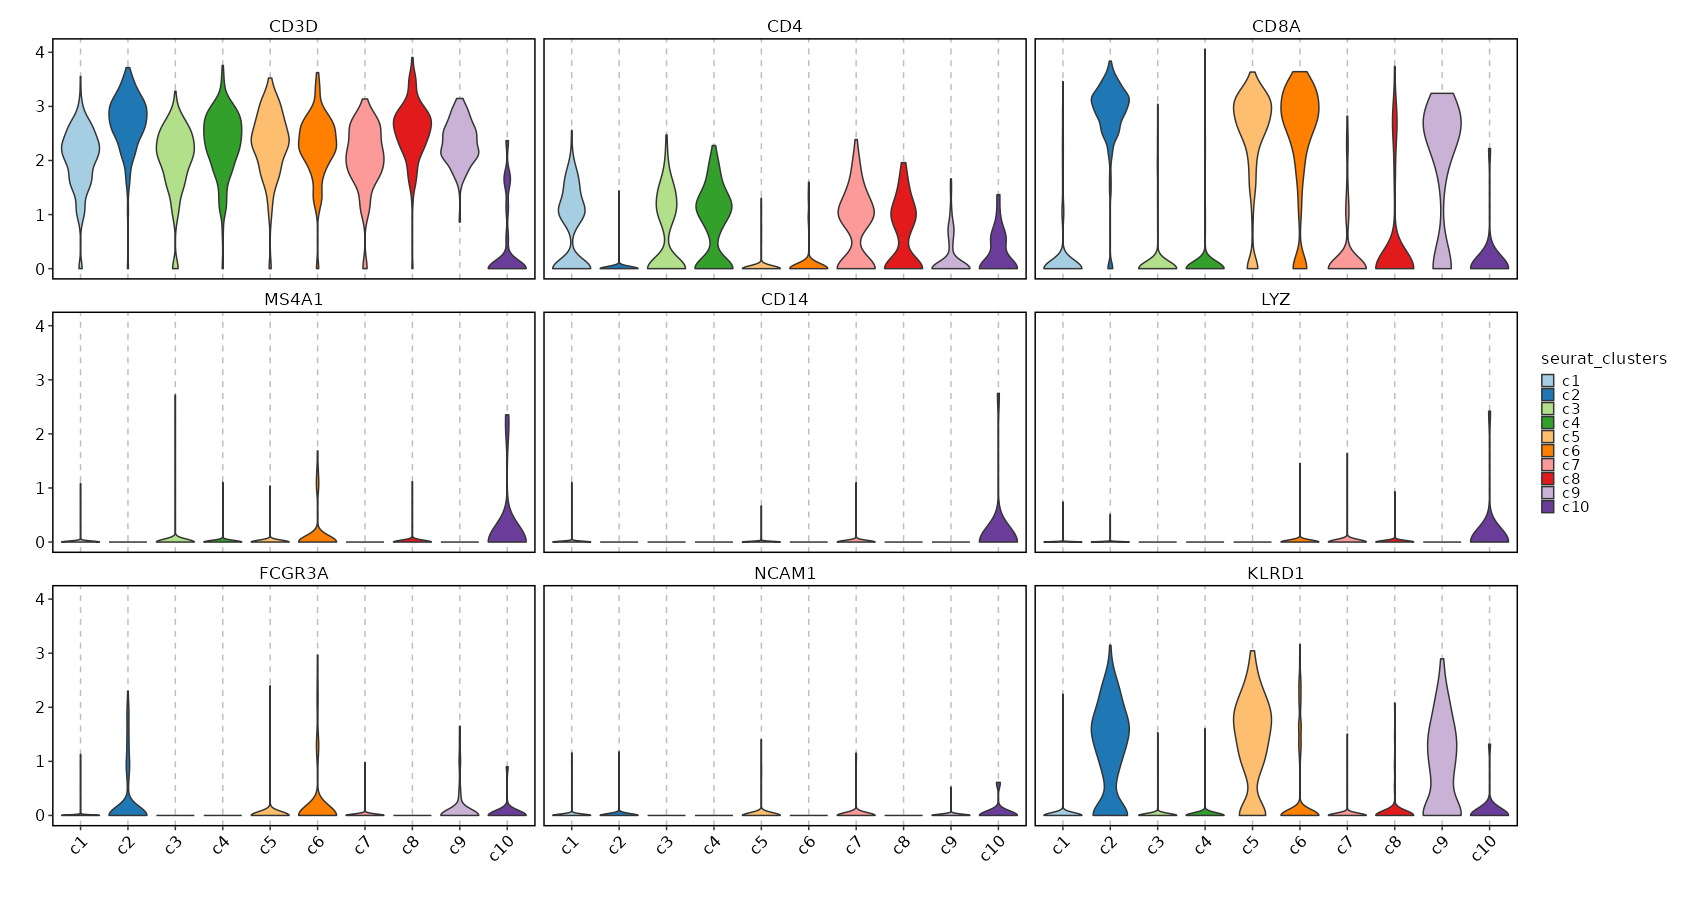
### Feature Expression in Clusters (Violin Plots)
```toml
[SeuratClusterStats.envs.features_defaults]
features = ["CD3D", "CD4", "CD8A", "MS4A1", "CD14", "LYZ", "FCGR3A", "NCAM1", "KLRD1"]
[SeuratClusterStats.envs.features."Feature Expression in Clusters (Violin Plots)"]
plot_type = "violin"
ident = "seurat_clusters"
```
{: width="80%" }
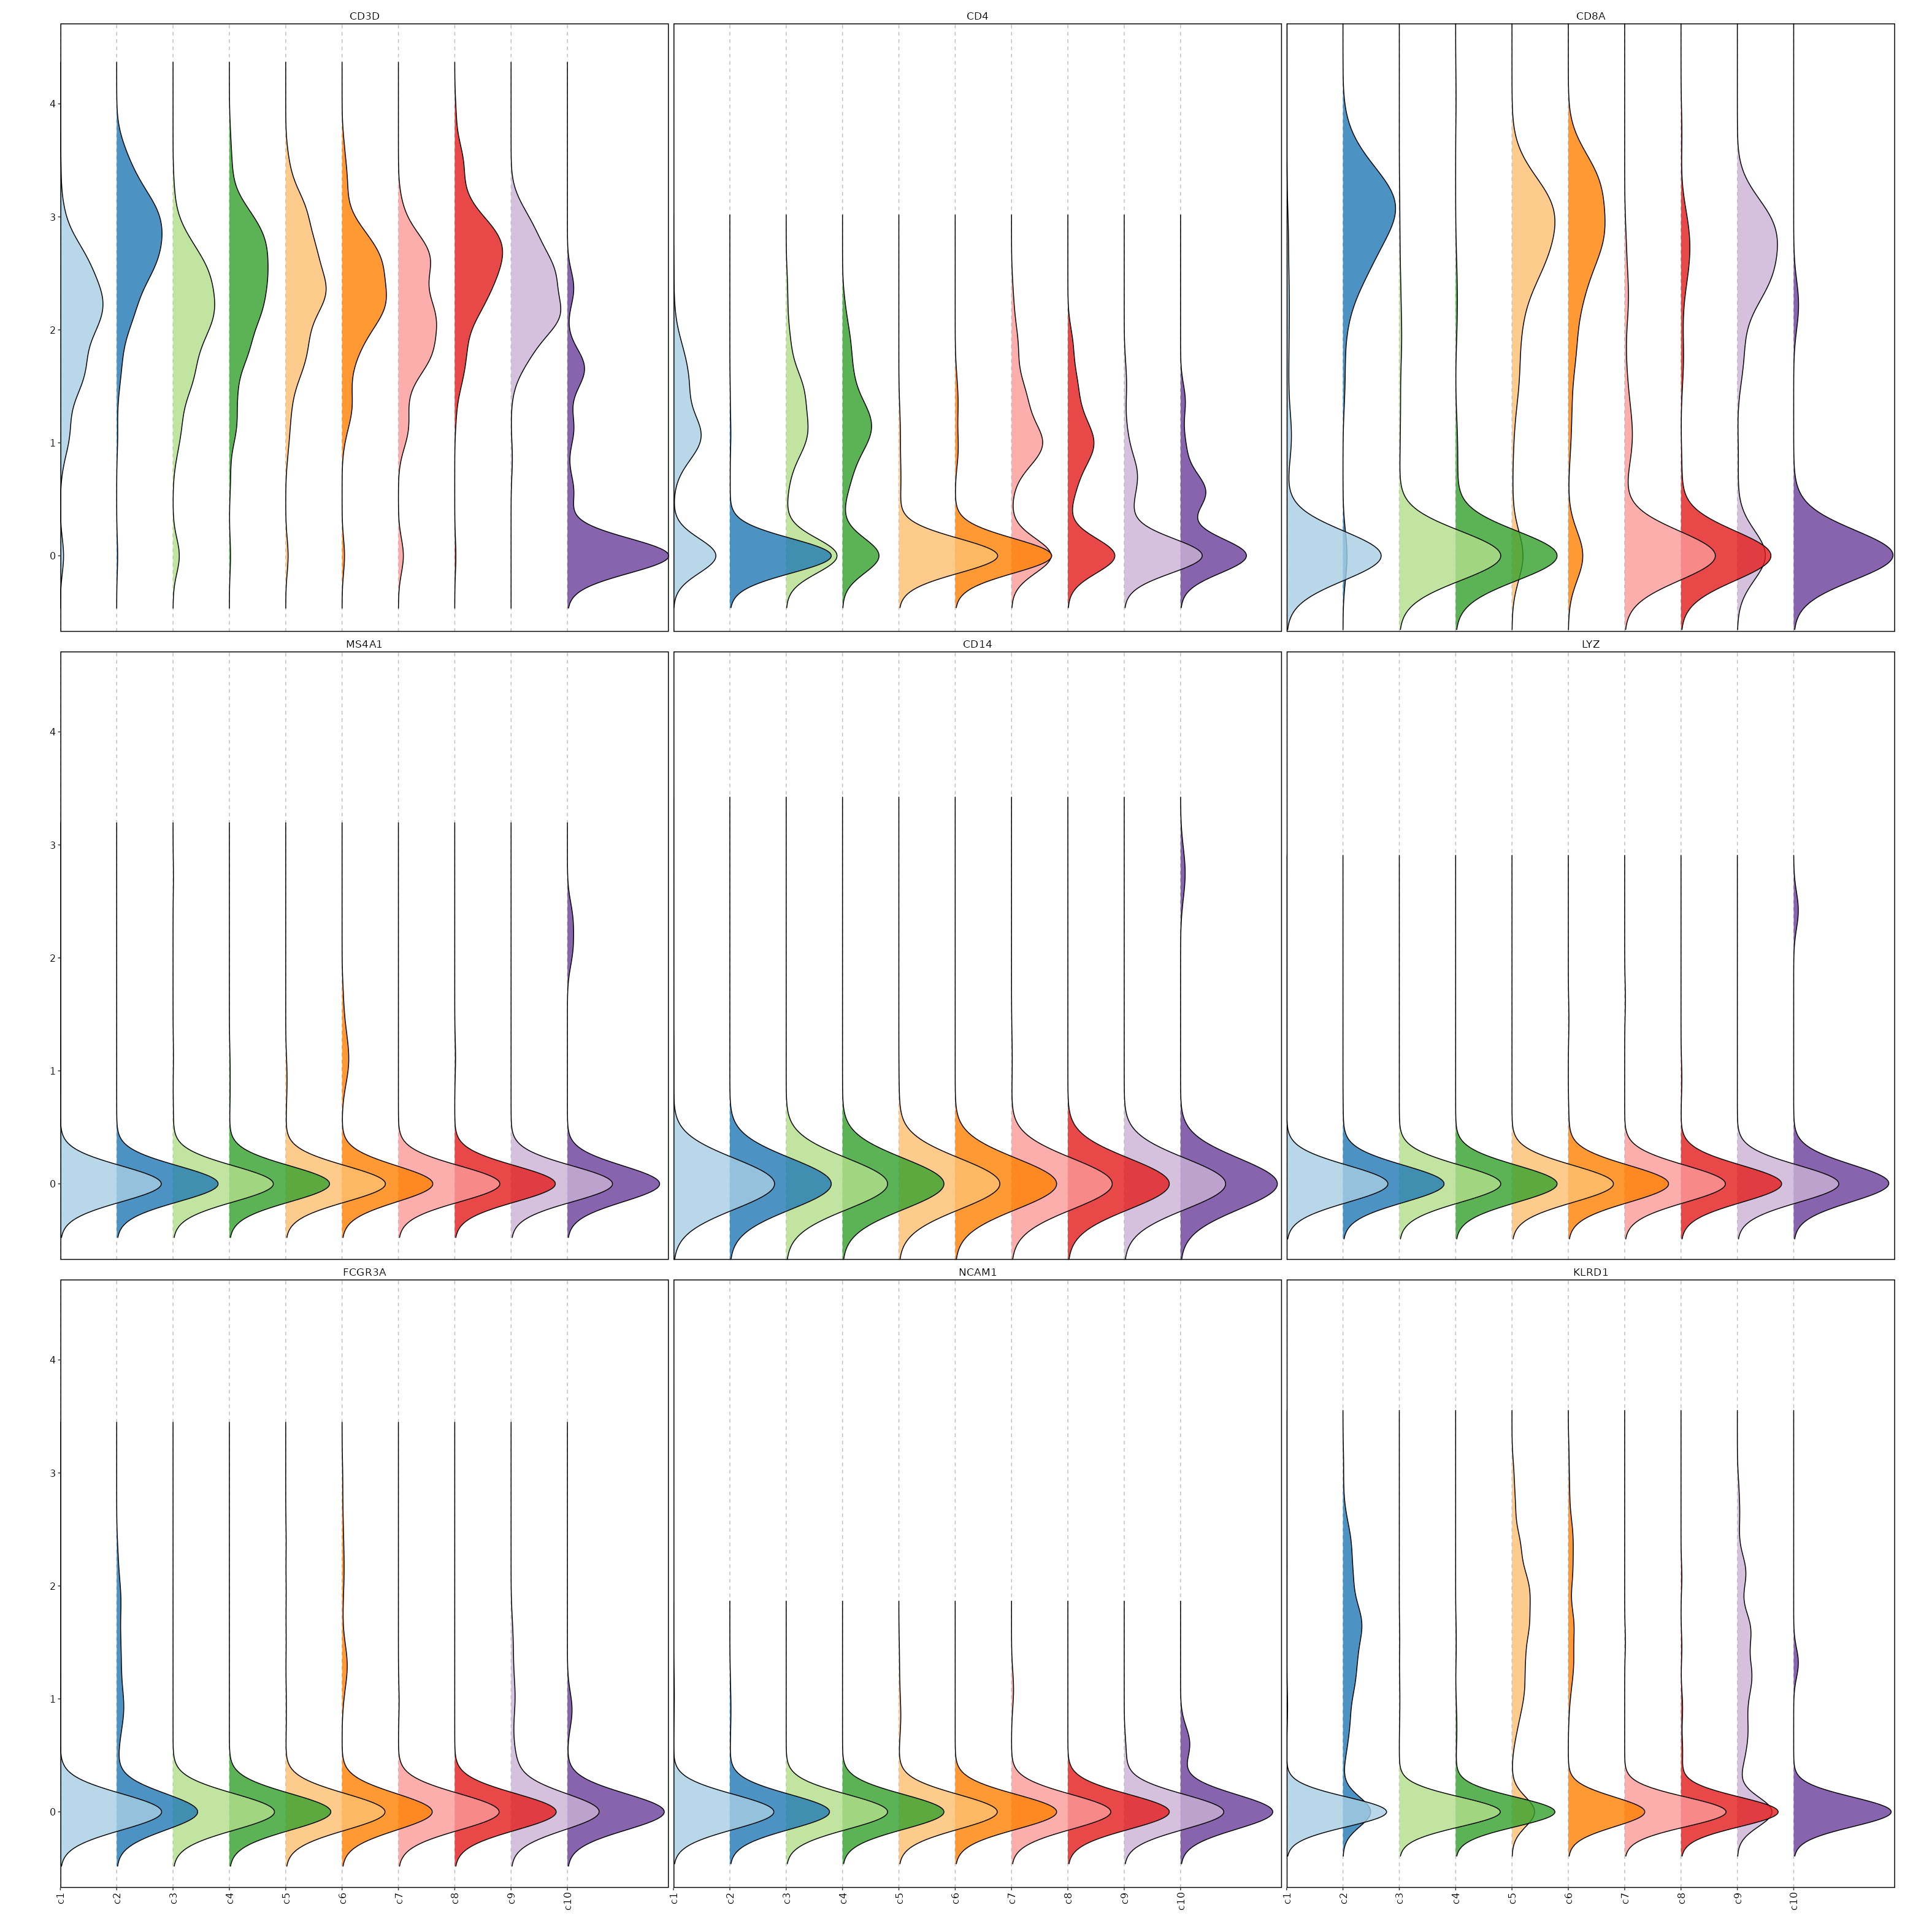
### Feature Expression in Clusters (Ridge Plots)
```toml
# Using the same features as above
[SeuratClusterStats.envs.features."Feature Expression in Clusters (Ridge Plots)"]
plot_type = "ridge"
ident = "seurat_clusters"
flip = true
```
{: width="80%" }
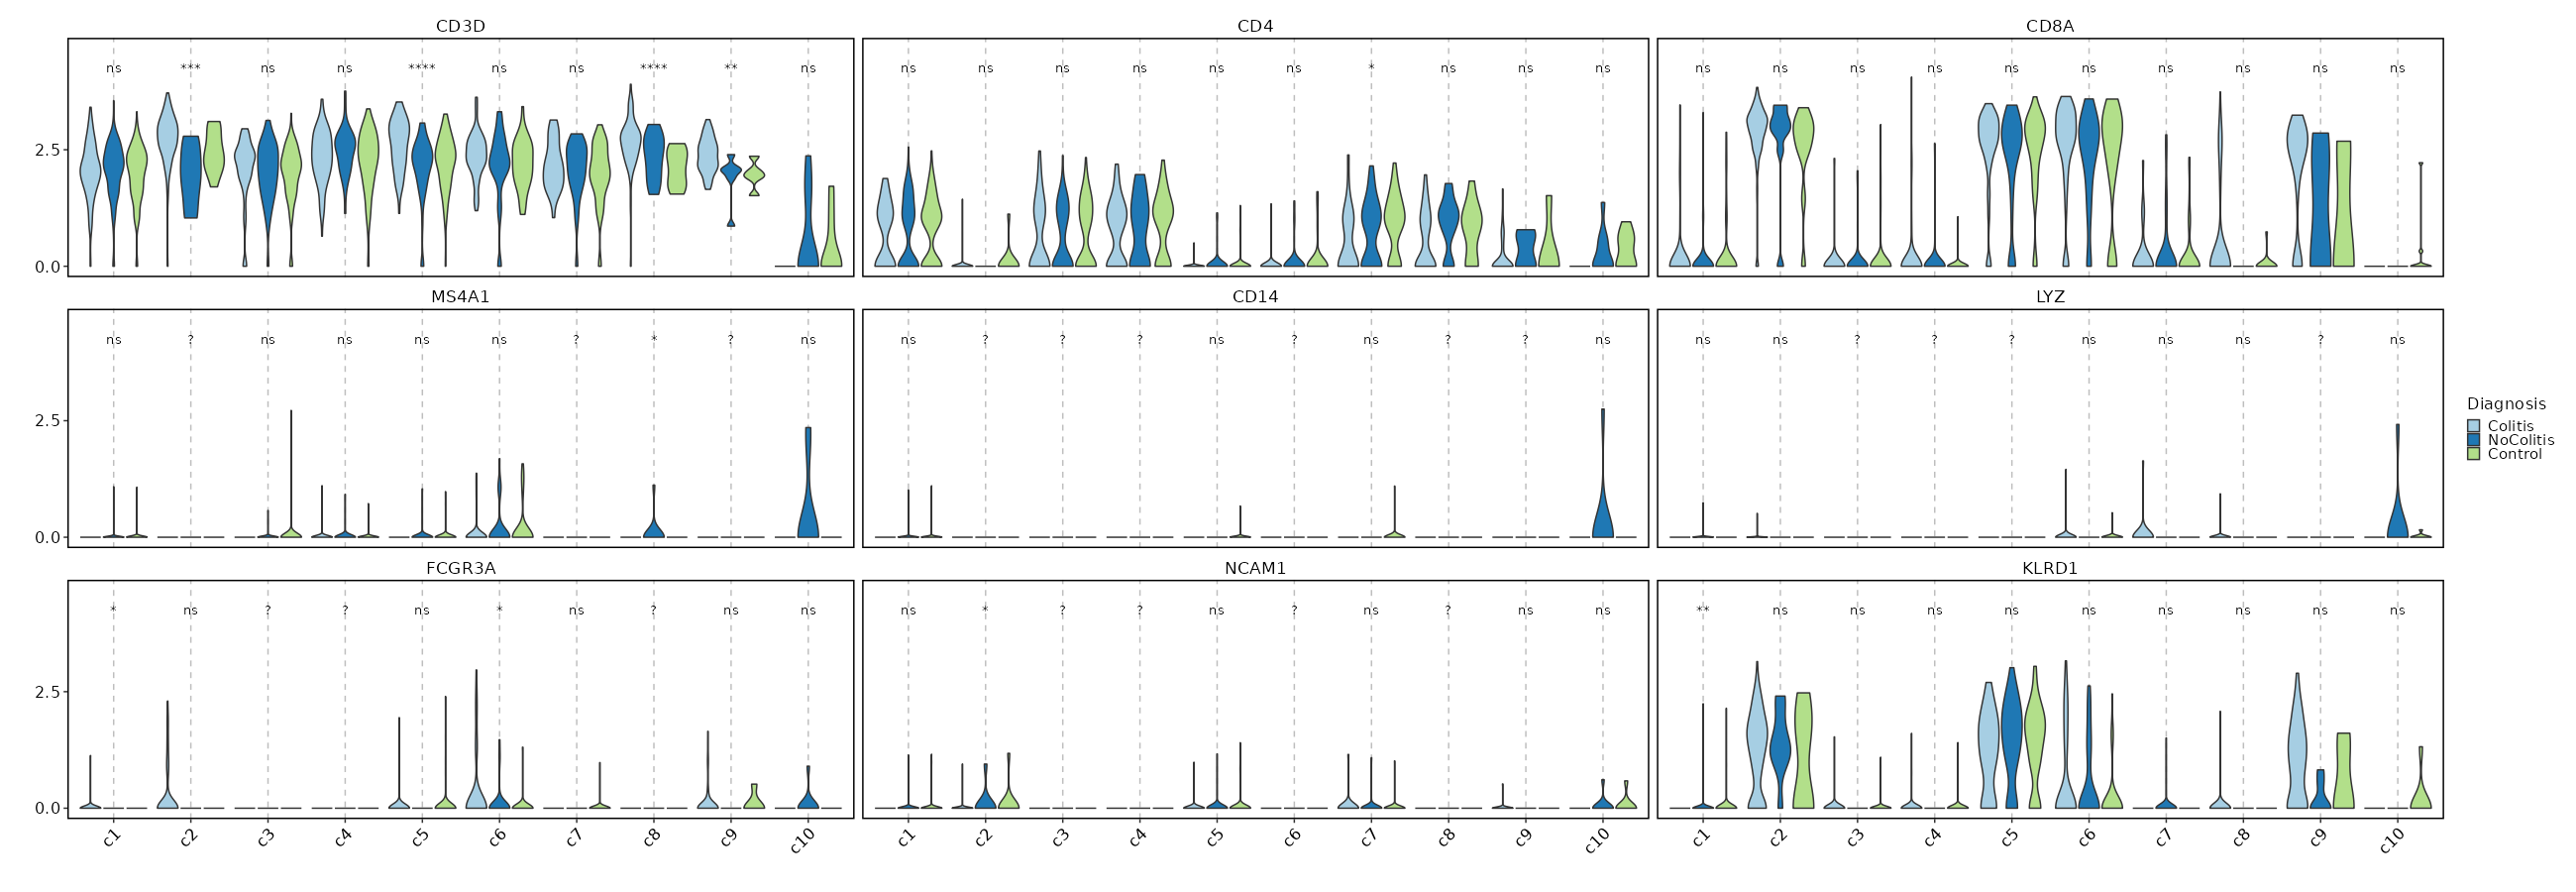
### Feature Expression in Clusters by Diagnosis
```toml
# Using the same features as above
[SeuratClusterStats.envs.features."Feature Expression in Clusters by Diagnosis"]
plot_type = "violin"
group_by = "Diagnosis"
ident = "seurat_clusters"
comparisons = true
sig_label = "p.signif"
```
{: width="80%" }
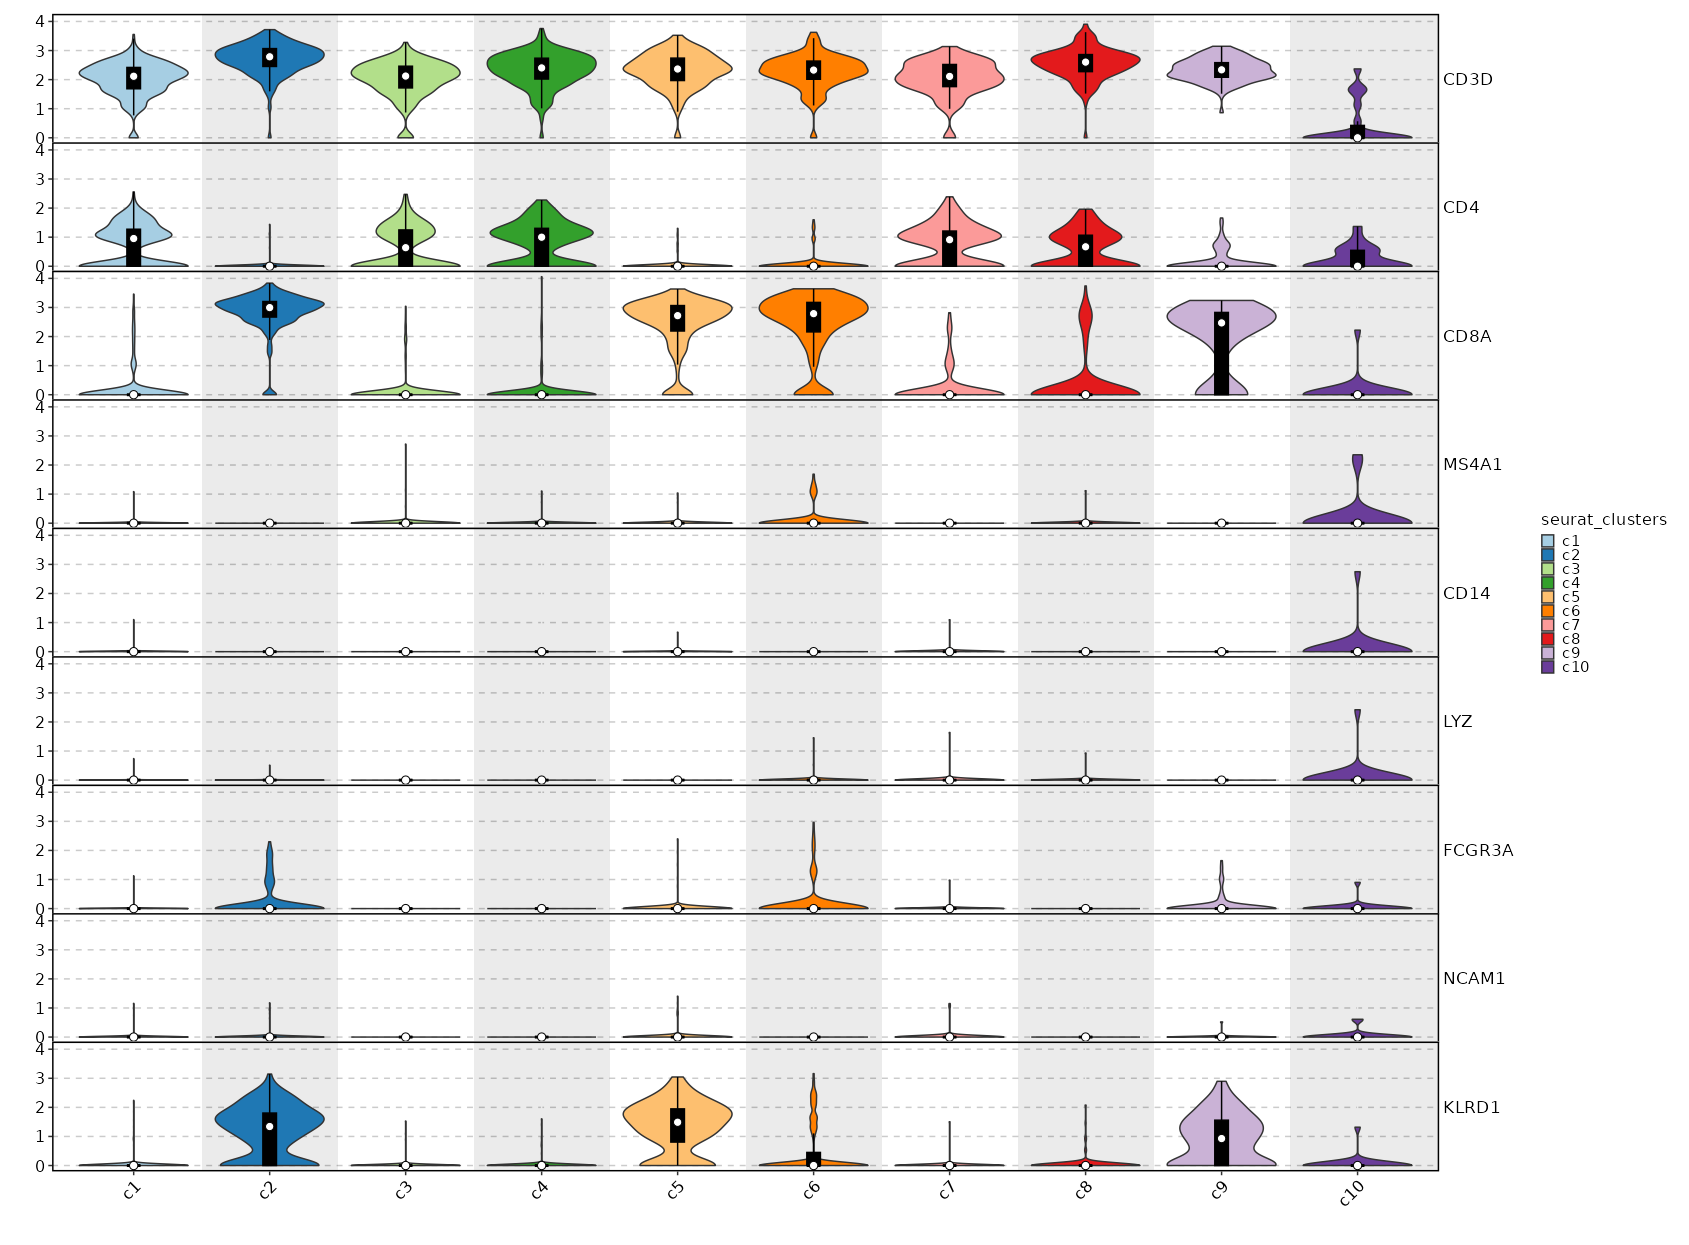
### Feature Expression in Clusters (stacked)
```toml
# Using the same features as above
[SeuratClusterStats.envs.features."Feature Expression in Clusters (stacked)"]
plot_type = "violin"
ident = "seurat_clusters"
add_bg = true
stack = true
add_box = true
```
{: width="80%" }
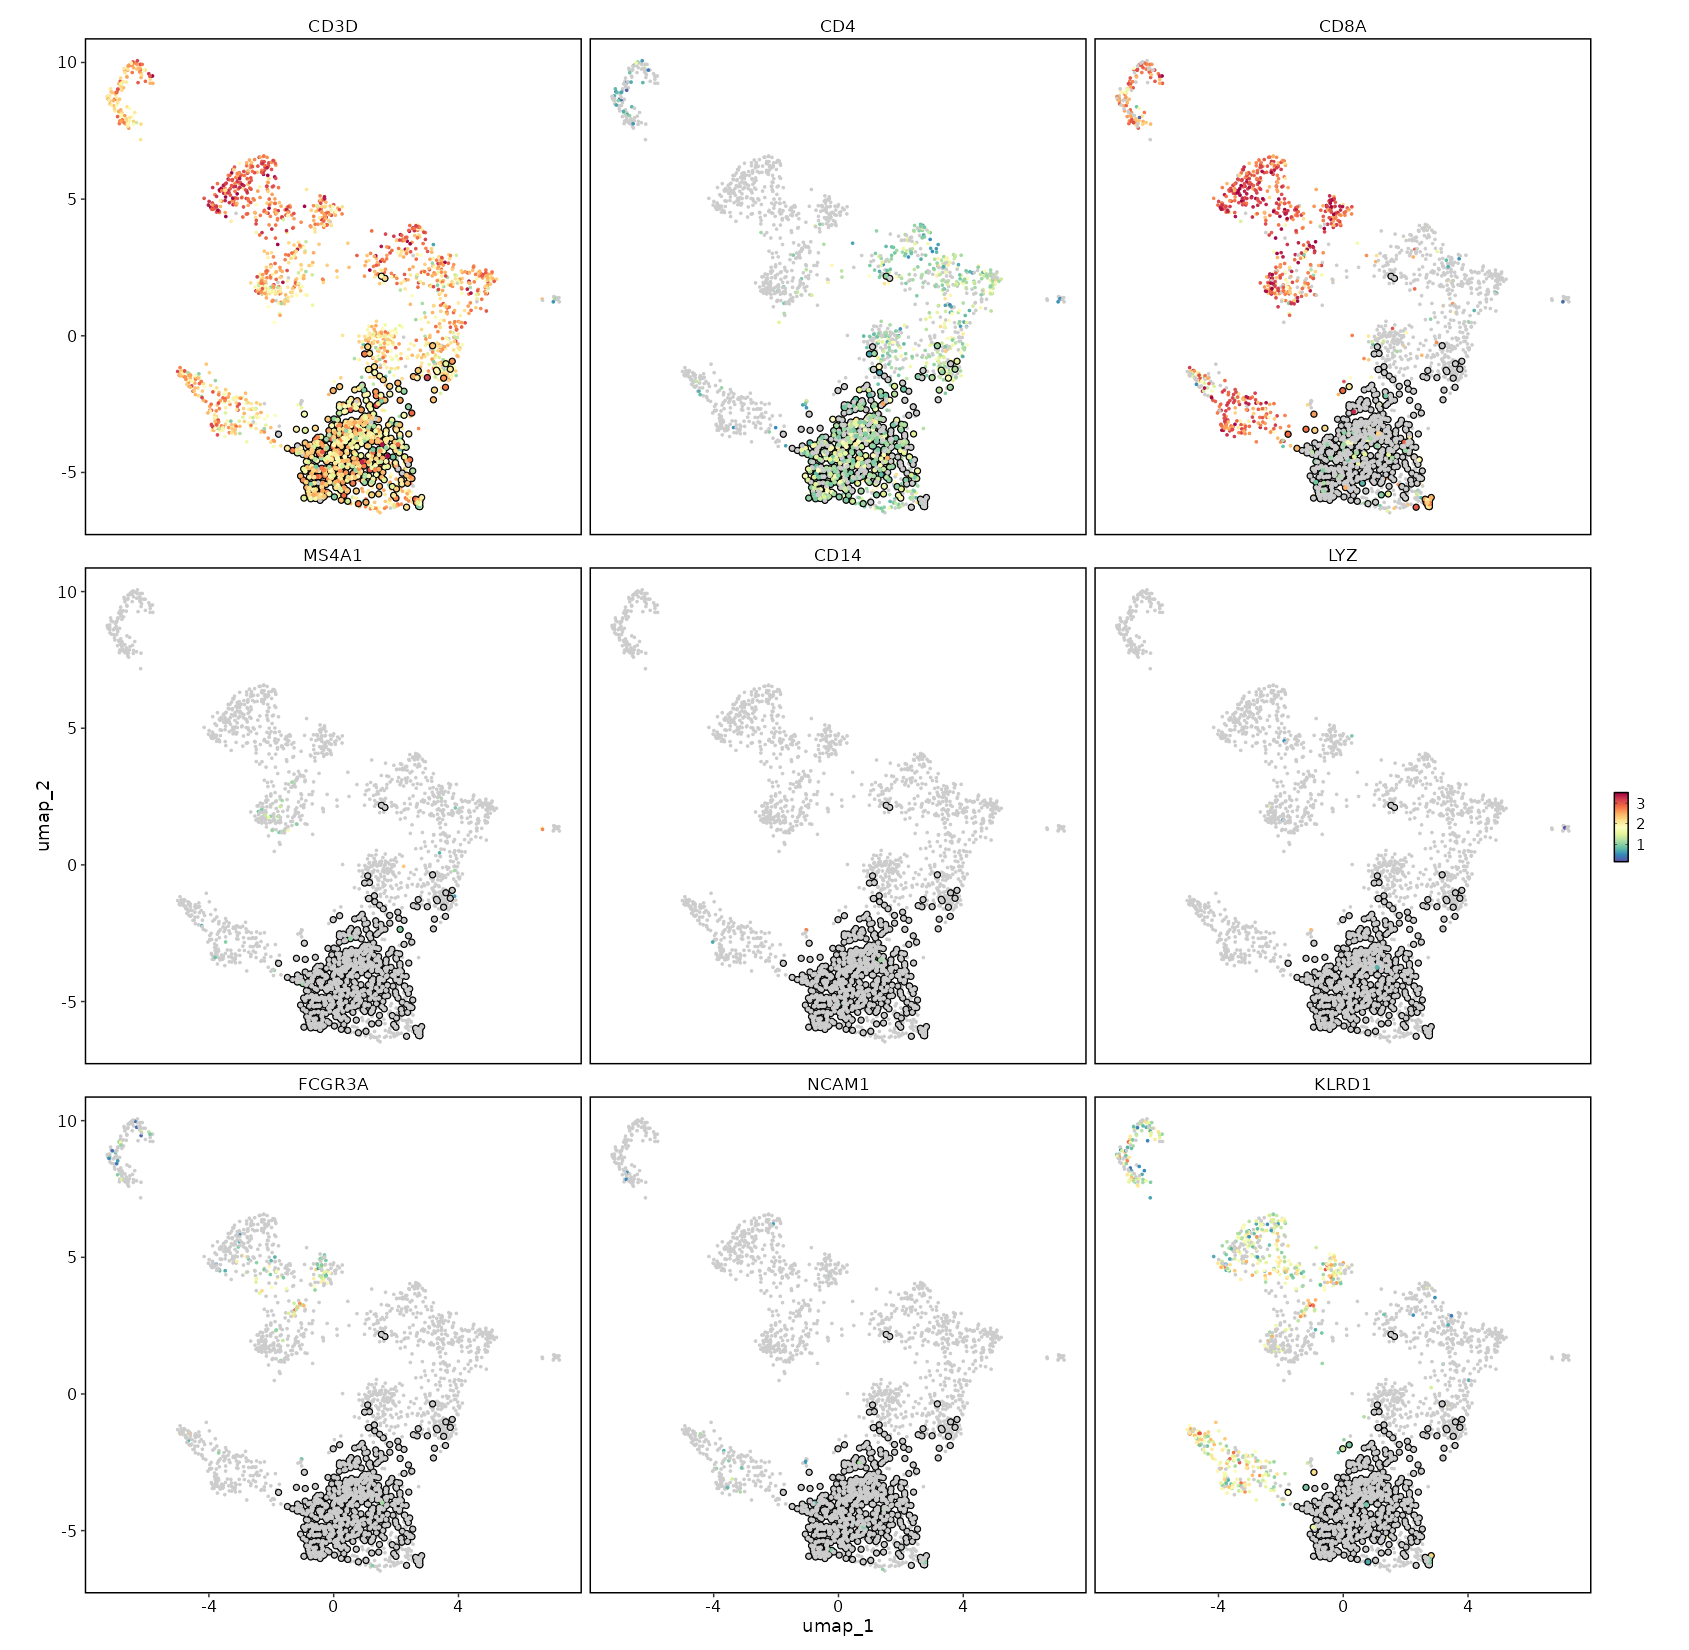
### CD4 Expression on UMAP
```toml
[SeuratClusterStats.envs.features."CD4 Expression on UMAP"]
plot_type = "dim"
feature = "CD4"
highlight = "seurat_clusters == 'c1'"
```
{: width="80%" }
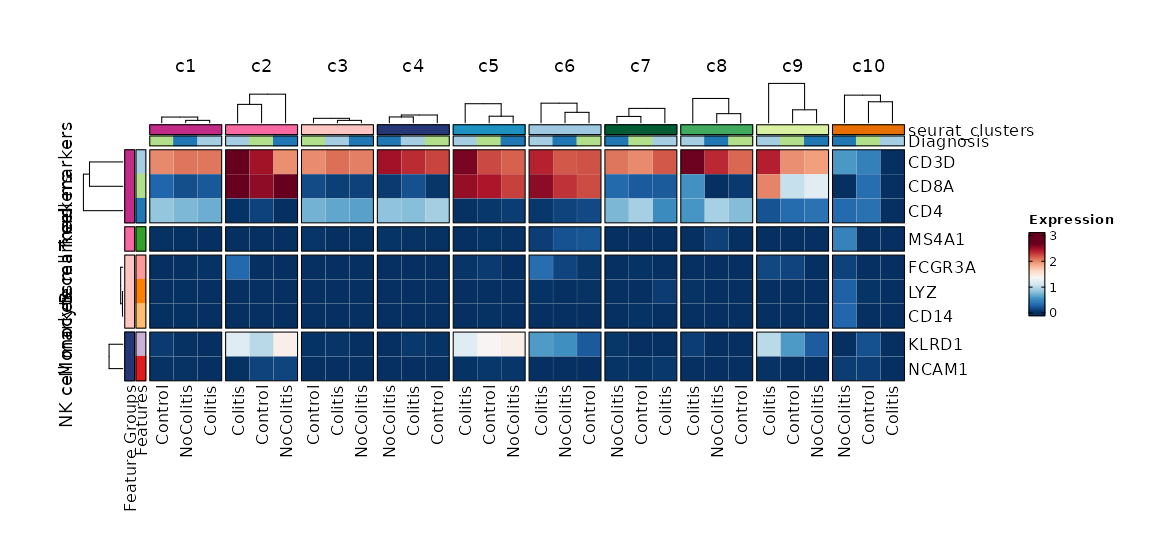
### Feature Expression in Clusters by Diagnosis (Heatmap)
```toml
[SeuratClusterStats.envs.features."Feature Expression in Clusters by Diagnosis (Heatmap)"]
# Grouped features
features = {"T cell markers" = ["CD3D", "CD4", "CD8A"], "B cell markers" = ["MS4A1"], "Monocyte markers" = ["CD14", "LYZ", "FCGR3A"], "NK cell markers" = ["NCAM1", "KLRD1"]}
plot_type = "heatmap"
ident = "Diagnosis"
columns_split_by = "seurat_clusters"
name = "Expression"
devpars = {height = 560}
```
{: width="80%" }
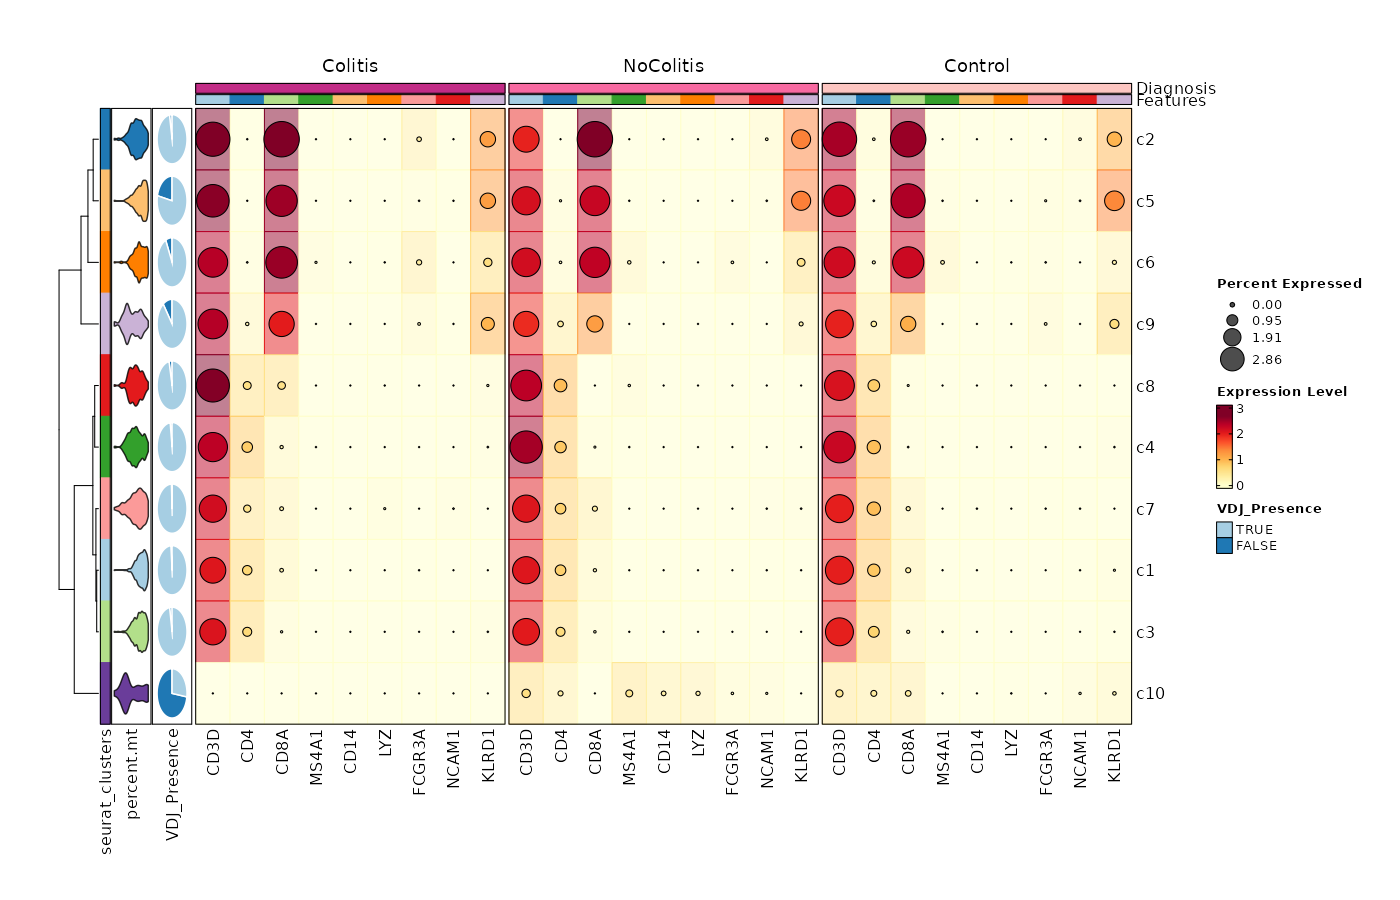
### Feature Expression in Clusters by Diagnosis (Heatmap with annotations)
```toml
# Using the default features
[SeuratClusterStats.envs.features."Feature Expression in Clusters by Diagnosis (Heatmap with annotations)"]
ident = "seurat_clusters"
cell_type = "dot"
plot_type = "heatmap"
name = "Expression Level"
dot_size = "nanmean"
dot_size_name = "Percent Expressed"
add_bg = true
rows_split_by = "Diagnosis"
cluster_rows = false
flip = true
palette = "YlOrRd"
column_annotation = ["percent.mt", "VDJ_Presence"]
column_annotation_type = {"percent.mt" = "violin", VDJ_Presence = "pie"}
column_annotation_params = {"percent.mt" = {show_legend = false}}
devpars = {width = 1400, height = 900}
```
{: width="80%" }
### Dimensional reduction plot
```toml
[SeuratClusterStats.envs.features."Dimensional reduction plot"]
label = true
```
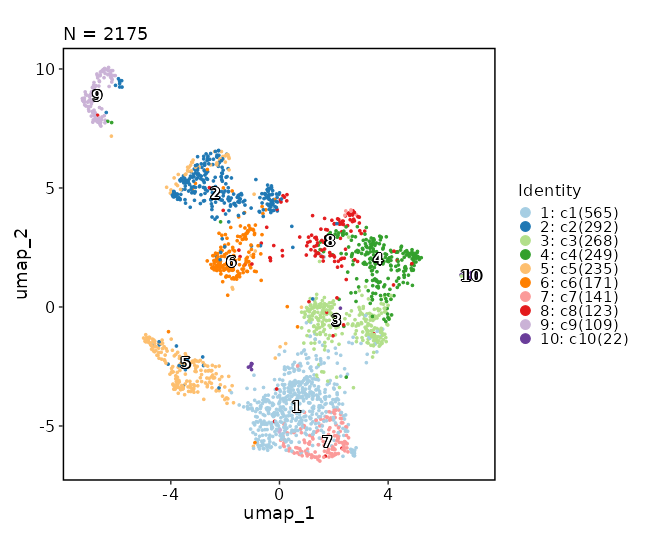{: width="80%" }
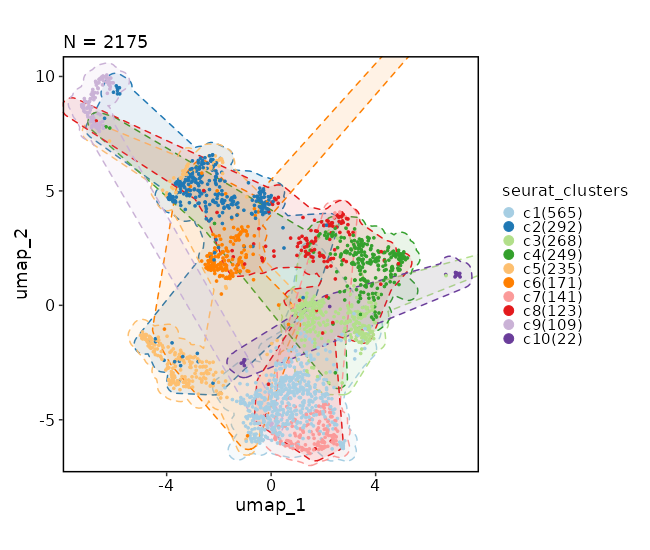
### Dimensional reduction plot (with marks)
```toml
[SeuratClusterStats.envs.dimplots."Dimensional reduction plot (with marks)"]
add_mark = true
mark_linetype = 2
```
{: width="80%" }
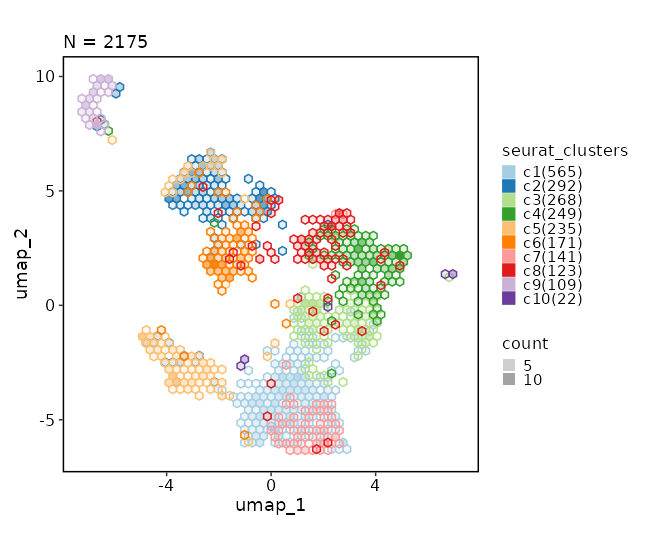
### Dimensional reduction plot (with hex bins)
```toml
[SeuratClusterStats.envs.dimplots."Dimensional reduction plot (with hex bins)"]
hex = true
hex_bins = 50
```
{: width="80%" }
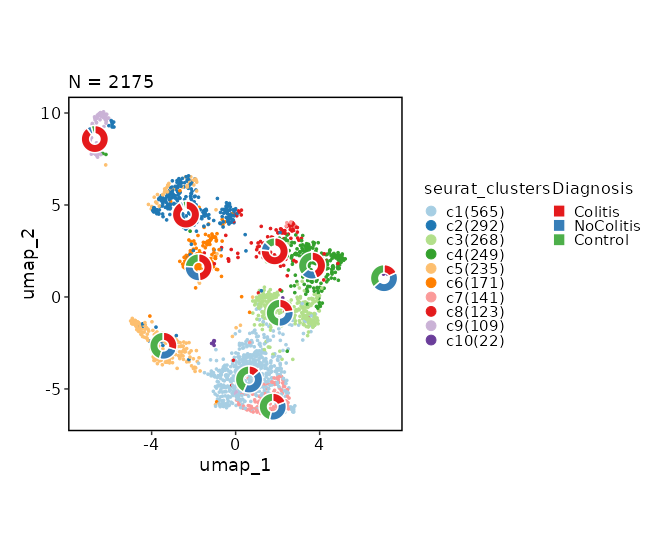
### Dimensional reduction plot (with Diagnosis stats)
```toml
[SeuratClusterStats.envs.dimplots."Dimensional reduction plot (with Diagnosis stats)"]
stat_by = "Diagnosis"
stat_plot_type = "ring"
stat_plot_size = 0.15
```
{: width="80%" }
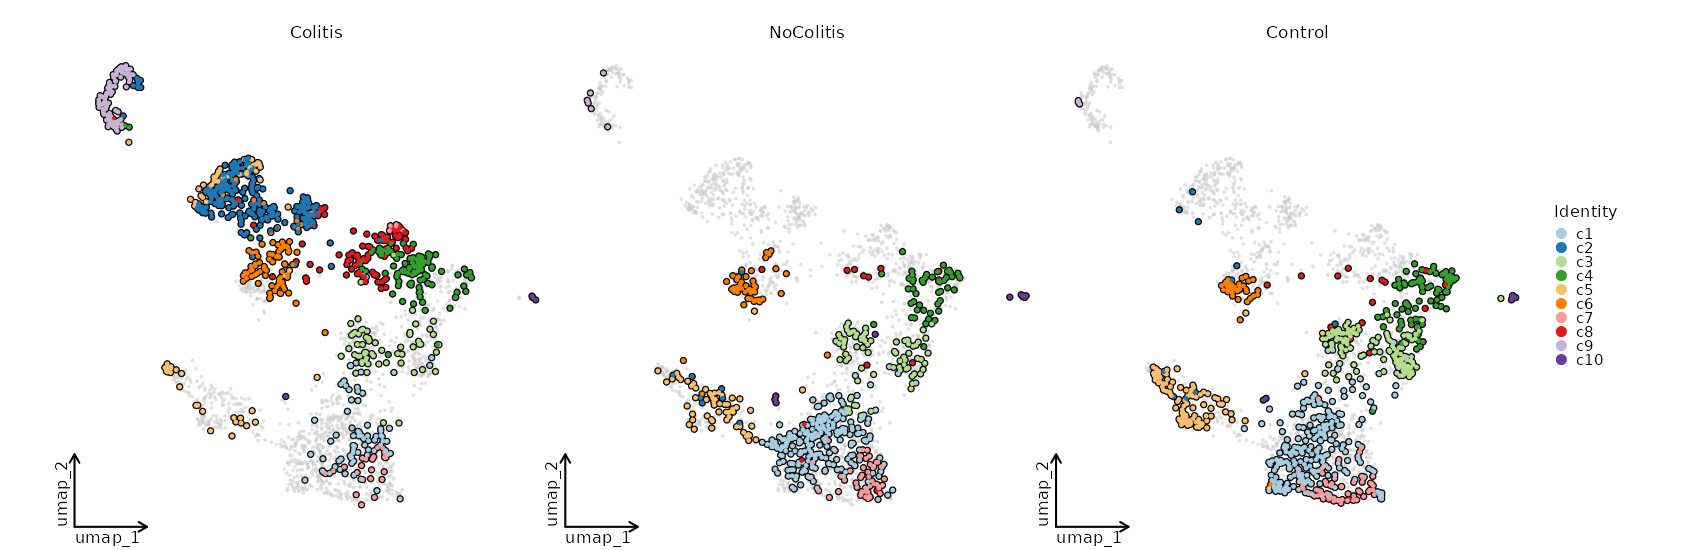
### Dimensional reduction plot by Diagnosis
```toml
[SeuratClusterStats.envs.dimplots."Dimensional reduction plot by Diagnosis"]
facet_by = "Diagnosis"
highlight = true
theme = "theme_blank"
```
{: width="80%" }
Input:
srtobj: The seurat object loaded by `SeuratClustering`
Output:
outdir: The output directory.
Different types of plots will be saved in different subdirectories.
For example, `clustree` plots will be saved in `clustrees` subdirectory.
For each case in `envs.clustrees`, both the png and pdf files will be saved.
Envs:
mutaters (type=json): The mutaters to mutate the metadata to subset the cells.
The mutaters will be applied in the order specified.
You can also use the clone selectors to select the TCR clones/clusters.
See <https://pwwang.github.io/scplotter/reference/clone_selectors.html>.
You can also use key `<newcol>:ident` to set the `<newcol>` as the default
ident for the stats.
See also <https://pwwang.github.io/biopipen.utils.R/reference/MutateSeuratMeta.html>
cache (type=auto): Whether to cache the plots.
Currently only plots for features are supported, since creating the those
plots can be time consuming.
If `True`, the plots will be cached in the job output directory, which will
be not cleaned up when job is rerunning.
clustrees_defaults (ns): The parameters for the clustree plots.
- devpars (ns): The device parameters for the clustree plot.
- res (type=int): The resolution of the plots.
- height (type=int): The height of the plots.
- width (type=int): The width of the plots.
- more_formats (type=list): The formats to save the plots other than `png`.
- save_code (flag): Whether to save the code to reproduce the plot.
- prefix (type=auto): string indicating columns containing clustering information.
The trailing dot is not necessary and will be added automatically.
When `TRUE`, clustrees will be plotted when there is `FindClusters` or
`FindClusters.*` in the `obj@commands`.
The latter is generated by `SeuratSubClustering`.
This will be ignored when `envs.clustrees` is specified
(the prefix of each case must be specified separately).
- <more>: Other arguments passed to `scplotter::ClustreePlot`.
See <https://pwwang.github.io/scplotter/reference/ClustreePlot.html>
clustrees (type=json): The cases for clustree plots.
Keys are the names of the plots and values are the dicts inherited from `env.clustrees_defaults` except `prefix`.
There is no default case for `clustrees`.
stats_defaults (ns): The default parameters for `stats`.
This is to do some basic statistics on the clusters/cells. For more comprehensive analysis,
see <https://pwwang.github.io/scplotter/reference/CellStatPlot.html>.
The parameters from the cases can overwrite the default parameters.
- subset: An expression to subset the cells, will be passed to `tidyrseurat::filter()`.
- devpars (ns): The device parameters for the clustree plot.
- res (type=int): The resolution of the plots.
- height (type=int): The height of the plots.
- width (type=int): The width of the plots.
- descr: The description of the plot, showing in the report.
- more_formats (type=list): The formats to save the plots other than `png`.
- save_code (flag): Whether to save the code to reproduce the plot.
- save_data (flag): Whether to save the data used to generate the plot.
- <more>: Other arguments passed to `scplotter::CellStatPlot`.
See <https://pwwang.github.io/scplotter/reference/CellStatPlot.html>.
stats (type=json): The number/fraction of cells to plot.
Keys are the names of the plots and values are the dicts inherited from `env.stats_defaults`.
ngenes_defaults (ns): The default parameters for `ngenes`.
The default parameters to plot the number of genes expressed in each cell.
- more_formats (type=list): The formats to save the plots other than `png`.
- subset: An expression to subset the cells, will be passed to `tidyrseurat::filter()`.
- devpars (ns): The device parameters for the plots.
- res (type=int): The resolution of the plots.
- height (type=int): The height of the plots.
- width (type=int): The width of the plots.
ngenes (type=json): The number of genes expressed in each cell.
Keys are the names of the plots and values are the dicts inherited from `env.ngenes_defaults`.
features_defaults (ns): The default parameters for `features`.
- features (type=auto): The features to plot.
It can be either a string with comma separated features, a list of features, a file path with `file://` prefix with features
(one per line), or an integer to use the top N features from `VariantFeatures(srtobj)`.
It can also be a dict with the keys as the feature group names and the values as the features, which
is used for heatmap to group the features.
- order_by (type=auto): The order of the clusters to show on the plot.
An expression passed to `dplyr::arrange()` on the grouped meta data frame (by `ident`).
For example, you can order the clusters by the activation score of
the cluster: `desc(mean(ActivationScore, na.rm = TRUE))`, suppose you have a column
`ActivationScore` in the metadata.
You may also specify the literal order of the clusters by a list of strings (at least two).
- subset: An expression to subset the cells, will be passed to `tidyrseurat::filter()`.
- devpars (ns): The device parameters for the plots.
- res (type=int): The resolution of the plots.
- height (type=int): The height of the plots.
- width (type=int): The width of the plots.
- descr: The description of the plot, showing in the report.
- more_formats (type=list): The formats to save the plots other than `png`.
- save_code (flag): Whether to save the code to reproduce the plot.
- save_data (flag): Whether to save the data used to generate the plot.
- <more>: Other arguments passed to `scplotter::FeatureStatPlot`.
See <https://pwwang.github.io/scplotter/reference/FeatureStatPlot.html>
features (type=json): The plots for features, include gene expressions, and columns from metadata.
Keys are the titles of the cases and values are the dicts inherited from `env.features_defaults`.
dimplots_defaults (ns): The default parameters for `dimplots`.
You can also set `dims` to `[1, 2, 3]` to make a 3D dimensional reduction plot.
Note that the default `n.components` for `RunUMAP` is 2, so if you want to make a 3D UMAP plot,
you need to set `n.components` to 3 in `RunUMAP` parameters in `SeuratSubClustering` or `SeuratClustering`.
- group_by: The identity to use.
- split_by: The column name in metadata to split the cells into different plots.
- subset: An expression to subset the cells, will be passed to `tidyrseurat::filter()`.
- devpars (ns): The device parameters for the plots.
- res (type=int): The resolution of the plots.
- height (type=int): The height of the plots.
- width (type=int): The width of the plots.
- reduction (choice): Which dimensionality reduction to use.
- dim: If `ident` is from subclustering, `<group_by>.<reduction>` will be used.
Otherwise, `scplotter:::default_dimreduc(obj)` will be used to determine
the default dimensionality reduction to use based on the reductions available in the object.
- auto: Same as `dim`
- umap: Use `Seurat::UMAPPlot`.
- tsne: Use `Seurat::TSNEPlot`.
- pca: Use `Seurat::PCAPlot`.
- <more>: See <https://pwwang.github.io/scplotter/reference/CellDimPlot.html>
dimplots (type=json): The dimensional reduction plots.
Keys are the titles of the plots and values are the dicts inherited from `env.dimplots_defaults`. It can also have other parameters from
[`scplotter::CellDimPlot`](https://pwwang.github.io/scplotter/reference/CellDimPlot.html).
Requires:
r-seurat:
- check: {{proc.lang}} -e "library(Seurat)"
""" # noqa: E501
input = "srtobj:file"
output = "outdir:dir:{{in.srtobj | stem}}.cluster_stats"
lang = config.lang.rscript
envs = {
"mutaters": {},
"cache": config.path.tmpdir,
"clustrees_defaults": {
"devpars": {"res": 100},
"more_formats": [],
"save_code": False,
"prefix": True,
},
"clustrees": {},
"stats_defaults": {
"subset": None,
"descr": None,
"devpars": {"res": 100},
"more_formats": [],
"save_code": False,
"save_data": False,
},
"stats": {
"Number of cells in each cluster (Bar Chart)": {
"plot_type": "bar",
"x_text_angle": 90,
},
"Number of cells in each cluster by Sample (Bar Chart)": {
"plot_type": "bar",
"group_by": "Sample",
"x_text_angle": 90,
},
},
"ngenes_defaults": {
"subset": None,
"more_formats": [],
"add_box": True,
"devpars": {"res": 100, "height": 800, "width": 1000},
},
"ngenes": {
"Number of genes expressed in each cluster": {},
},
"features_defaults": {
"features": None,
"order_by": None,
"subset": None,
"devpars": {"res": 100},
"descr": None,
"more_formats": [],
"save_code": False,
"save_data": False,
},
"features": {},
"dimplots_defaults": {
"group_by": None, # use default ident
"split_by": None,
"subset": None,
"reduction": "dim",
"devpars": {"res": 100},
},
"dimplots": {
"Dimensional reduction plot": {
"label": True,
},
},
}
script = "file://../scripts/scrna/SeuratClusterStats.R"
plugin_opts = {
"report": "file://../reports/common.svelte",
"report_paging": 8,
}
class ModuleScoreCalculator(Proc):DOCS
"""Calculate the module scores for each cell
The module scores are calculated by
[`Seurat::AddModuleScore()`](https://satijalab.org/seurat/reference/addmodulescore)
or [`Seurat::CellCycleScoring()`](https://satijalab.org/seurat/reference/cellcyclescoring)
for cell cycle scores.
The module scores are calculated as the average expression levels of each
program on single cell level, subtracted by the aggregated expression of
control feature sets. All analyzed features are binned based on averaged
expression, and the control features are randomly selected from each bin.
Input:
srtobj: The seurat object loaded by `SeuratClustering`
Output:
rdsfile: The seurat object with module scores added to the metadata.
Envs:
defaults (ns): The default parameters for `modules`.
- features: The features to calculate the scores. Multiple features
should be separated by comma.
You can also specify `cc.genes` or `cc.genes.updated.2019` to
use the cell cycle genes to calculate cell cycle scores.
If so, three columns will be added to the metadata, including
`S.Score`, `G2M.Score` and `Phase`.
Only one type of cell cycle scores can be calculated at a time.
- nbin (type=int): Number of bins of aggregate expression levels
for all analyzed features.
- ctrl (type=int): Number of control features selected from
the same bin per analyzed feature.
- k (flag): Use feature clusters returned from `DoKMeans`.
- assay: The assay to use.
- seed (type=int): Set a random seed.
- search (flag): Search for symbol synonyms for features in
features that don't match features in object?
- keep (flag): Keep the scores for each feature?
Only works for non-cell cycle scores.
- agg (choice): The aggregation function to use.
Only works for non-cell cycle scores.
- mean: The mean of the expression levels
- median: The median of the expression levels
- sum: The sum of the expression levels
- max: The max of the expression levels
- min: The min of the expression levels
- var: The variance of the expression levels
- sd: The standard deviation of the expression levels
- <more>: Other arguments passed to `Seurat::AddModuleScore()` or `Seurat::CellCycleScoring()`.
See <https://satijalab.org/seurat/reference/addmodulescore> and
<https://satijalab.org/seurat/reference/cellcyclescoring>
modules (type=json): The modules to calculate the scores.
Keys are the names of the expression programs and values are the
dicts inherited from `env.defaults`.
Here are some examples -
>>> {
>>> "CellCycleMouse": {"features": "cc.genes.mouse"},
>>> "CellCycle": {"features": "cc.genes.updated.2019"},
>>> "Exhaustion": {"features": "HAVCR2,ENTPD1,LAYN,LAG3"},
>>> "Activation": {"features": "IFNG"},
>>> "Proliferation": {"features": "STMN1,TUBB"}
>>> }
For `CellCycle`, the columns `S.Score`, `G2M.Score` and `Phase` will
be added to the metadata. `S.Score` and `G2M.Score` are the cell cycle
scores for each cell, and `Phase` is the cell cycle phase for each cell.
You can also add Diffusion Components (DC) to the modules
>>> {"DC": {"features": 2, "kind": "diffmap"}}
will perform diffusion map as a reduction and add the first 2
components as `DC_1` and `DC_2` to the metadata. `diffmap` is a shortcut
for `diffusion_map`. Other key-value pairs will pass to
[`destiny::DiffusionMap()`](https://www.rdocumentation.org/packages/destiny/versions/2.0.4/topics/DiffusionMap class).
You can later plot the diffusion map by using
`reduction = "DC"` in `env.dimplots` in `SeuratClusterStats`.
This requires [`SingleCellExperiment`](https://bioconductor.org/packages/release/bioc/html/SingleCellExperiment.html)
and [`destiny`](https://bioconductor.org/packages/release/bioc/html/destiny.html) R packages.
post_mutaters (type=json): The mutaters to mutate the metadata after
calculating the module scores.
The mutaters will be applied in the order specified.
This is useful when you want to create new scores based on the
calculated module scores.
""" # noqa: E501
input = "srtobj:file"
output = "rdsfile:file:{{in.srtobj | stem}}.qs"
lang = config.lang.rscript
envs = {
"defaults": {
"features": None,
"nbin": 24,
"ctrl": 100,
"k": False,
"assay": None,
"seed": 8525,
"search": False,
"keep": False,
"agg": "mean",
},
"modules": {
# "CellCycle": {"features": "cc.genes.updated.2019"},
# "Exhaustion": {"features": "HAVCR2,ENTPD1,LAYN,LAG3"},
# "Activation": {"features": "IFNG"},
# "Proliferation": {"features": "STMN1,TUBB"},
},
"post_mutaters": {},
}
script = "file://../scripts/scrna/ModuleScoreCalculator.R"
@mark(DOCS
deprecated=(
"[{proc.name}] is deprecated, "
"use [SeuratClusterStats] or [ClonalStats] instead."
)
)
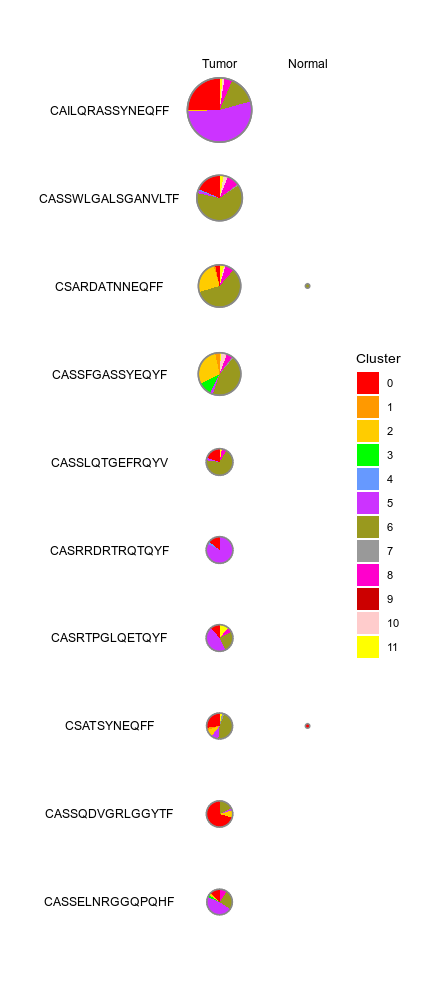
class CellsDistribution(Proc):
"""Distribution of cells (i.e. in a TCR clone) from different groups
for each cluster
This generates a set of pie charts with proportion of cells in each cluster
Rows are the cells identities (i.e. TCR clones or TCR clusters), columns
are groups (i.e. clinic groups).
Examples:
```toml
[CellsDistribution.envs.mutaters]
# Add Patient1_Tumor_Expanded column with CDR3.aa that
# expands in Tumor of patient 1
Patient1_Tumor_Expanded = '''
expanded(., region, "Tumor", subset = patient == "Lung1", uniq = FALSE)
'''
[CellsDistribution.envs.cases.Patient1_Tumor_Expanded]
cells_by = "Patient1_Tumor_Expanded"
cells_orderby = "desc(CloneSize)"
group_by = "region"
group_order = [ "Tumor", "Normal" ]
```
Input:
srtobj: The seurat object in RDS format
Output:
outdir: The output directory.
The results for each case will be saved in a subdirectory.
Envs:
mutaters (type=json): The mutaters to mutate the metadata
Keys are the names of the mutaters and values are the R expressions
passed by `dplyr::mutate()` to mutate the metadata.
cluster_orderby: The order of the clusters to show on the plot.
An expression passed to `dplyr::summarise()` on the grouped data frame (by `seurat_clusters`).
The summary stat will be passed to `dplyr::arrange()` to order the clusters. It's applied on the whole meta.data before grouping and subsetting.
For example, you can order the clusters by the activation score of
the cluster: `desc(mean(ActivationScore, na.rm = TRUE))`, suppose you have a column
`ActivationScore` in the metadata.
group_by: The column name in metadata to group the cells for the columns of the plot.
group_order (list): The order of the groups (columns) to show on the plot
cells_by: The column name in metadata to group the cells for the rows of the plot.
If your cell groups have overlapping cells, you can also use multiple columns, separated by comma (`,`).
These columns will be concatenated to form the cell groups. For the overlapping cells, they will be
counted multiple times for different groups. So make sure the cell group names in different columns
are unique.
cells_order (list): The order of the cells (rows) to show on the plot
cells_orderby: An expression passed to `dplyr::arrange()` to order the cells (rows) of the plot.
Only works when `cells-order` is not specified.
The data frame passed to `dplyr::arrange()` is grouped by `cells_by` before ordering.
You can have multiple expressions separated by semicolon (`;`). The expessions will be parsed by `rlang::parse_exprs()`.
4 extra columns were added to the metadata for ordering the rows in the plot:
* `CloneSize`: The size (number of cells) of clones (identified by `cells_by`)
* `CloneGroupSize`: The clone size in each group (identified by `group_by`)
* `CloneClusterSize`: The clone size in each cluster (identified by `seurat_clusters`)
* `CloneGroupClusterSize`: The clone size in each group and cluster (identified by `group_by` and `seurat_clusters`)
cells_n (type=int): The max number of groups to show for each cell group identity (row).
Ignored if `cells_order` is specified.
subset: An expression to subset the cells, will be passed to `dplyr::filter()` on metadata.
This will be applied prior to `each`.
descr: The description of the case, will be shown in the report.
hm_devpars (ns): The device parameters for the heatmaps.
- res (type=int): The resolution of the heatmaps.
- height (type=int): The height of the heatmaps.
- width (type=int): The width of the heatmaps.
devpars (ns): The device parameters for the plots of pie charts.
- res (type=int): The resolution of the plots
- height (type=int): The height of the plots
- width (type=int): The width of the plots
each: The column name in metadata to separate the cells into different plots.
prefix_each (flag): Whether to prefix the `each` column name to the
value as the case/section name.
section: The section to show in the report. This allows different cases to be put in the same section in report.
Only works when `each` is not specified.
overlap (list): Plot the overlap of cell groups (values of `cells_by`) in different cases
under the same section.
The section must have at least 2 cases, each case should have a single `cells_by` column.
cases (type=json;order=99): If you have multiple cases, you can specify them here.
Keys are the names of the cases and values are the options above except `mutaters`.
If some options are not specified, the options in `envs` will be used.
If no cases are specified, a default case will be used with case name `DEFAULT`.
Requires:
r-seurat:
- check: {{proc.lang}} -e "library(Seurat)"
r-dplyr:
- check: {{proc.lang}} -e "library(dplyr)"
r-tidyr:
- check: {{proc.lang}} -e "library(tidyr)"
""" # noqa: E501
input = "srtobj:file"
output = "outdir:dir:{{in.srtobj | stem}}.cells_distribution"
lang = config.lang.rscript
envs = {
"mutaters": {},
"cluster_orderby": None,
"group_by": None,
"group_order": [],
"cells_by": None,
"cells_order": [],
"cells_orderby": None,
"cells_n": 10,
"subset": None,
"descr": None,
"devpars": {},
"hm_devpars": {},
"each": None,
"prefix_each": True,
"section": "DEFAULT",
"overlap": [],
"cases": {},
}
script = "file://../scripts/scrna/CellsDistribution.R"
plugin_opts = {
"report": "file://../reports/scrna/CellsDistribution.svelte",
"report_paging": 8,
}
class SeuratMetadataMutater(Proc):DOCS
"""Mutate the metadata of the seurat object
Input:
srtobj: The seurat object loaded by SeuratPreparing
metafile: Additional metadata
A tab-delimited file with columns as meta columns and rows as
cells.
Output:
outfile: The seurat object with the additional metadata
Envs:
mutaters (type=json): The mutaters to mutate the metadata.
The key-value pairs will be passed the `dplyr::mutate()` to mutate the metadata.
See <https://pwwang.github.io/biopipen.utils.R/reference/MutateSeuratMeta.html>
subset: An expression to subset the cells, will be passed to `dplyr::filter()`.
This will be applied after mutating the metadata.
Requires:
r-seurat:
- check: {{proc.lang}} <(echo "library(Seurat)")
r-tibble:
- check: {{proc.lang}} <(echo "library(tibble)")
r-dplyr:
- check: {{proc.lang}} <(echo "library(dplyr)")
""" # noqa: E501
input = "srtobj:file, metafile:file"
output = "outfile:file:{{in.srtobj | stem}}.qs"
lang = config.lang.rscript
envs = {"mutaters": {}, "subset": None}
script = "file://../scripts/scrna/SeuratMetadataMutater.R"
@mark(deprecated="[{proc.name}] is deprecated, use [SeuratClusterStats] instead.")DOCS
class DimPlots(Proc):
"""Seurat - Dimensional reduction plots
Input:
srtobj: The seruat object in RDS format
configfile: A toml configuration file with "cases"
If this is given, `envs.cases` will be overriden
name: The name of the job, used in report
Output:
outdir: The output directory
Envs:
cases: The cases for the dim plots
Keys are the names and values are the arguments to
`Seurat::Dimplots`
"""
input = "srtobj:file, configfile:file, name:var"
output = "outdir:dir:{{in.srtobj | stem}}.dimplots"
lang = config.lang.rscript
script = "file://../scripts/scrna/DimPlots.R"
envs = {"cases": {"Ident": {"group.by": "ident"}}}
plugin_opts = {
"report": "file://../reports/scrna/DimPlots.svelte",
"report_toc": False,
}
class MarkersFinder(Proc):DOCS
"""Find markers between different groups of cells
When only `group_by` is specified as identity column in
`envs.cases`, the markers will be found for all the clusters.
You can also find the differentially expressed genes between
any two groups of cells by setting `group_by` to a different
column name in metadata. Follow `envs.cases` for more details.
Input:
srtobj: The seurat object loaded by `SeuratPreparing`
If you have your `Seurat` object prepared by yourself, you can also
use it here, but you should make sure that the object has been processed
by `PrepSCTFindMarkers` if data is not normalized using `SCTransform`.
Output:
outdir: The output directory for the markers and plots
Envs:
ncores (type=int): Number of cores to use for parallel computing for some `Seurat` procedures.
* Used in `future::plan(strategy = "multicore", workers = <ncores>)` to parallelize some Seurat procedures.
* See also: <https://satijalab.org/seurat/articles/future_vignette.html>
mutaters (type=json): The mutaters to mutate the metadata.
You can also use the clone selectors to select the TCR clones/clusters.
See <https://pwwang.github.io/scplotter/reference/clone_selectors.html>.
You can also use key `<newcol>:ident` to set the `<newcol>` as the default
ident for the stats.
See also <https://pwwang.github.io/biopipen.utils.R/reference/MutateSeuratMeta.html>
group_by: The column name in metadata to group the cells.
If only `group_by` is specified, and `ident_1` and `ident_2` are
not specified, markers will be found for all groups in this column
in the manner of "group vs rest" comparison.
`NA` group will be ignored.
If `None`, `Seurat::Idents(srtobj)` will be used, which is usually
`"seurat_clusters"` after unsupervised clustering.
ident_1: The first group of cells to compare
When this is empty, the comparisons will be expanded to each group v.s. the rest of the cells in `group_by`.
ident_2: The second group of cells to compare
If not provided, the rest of the cells are used for `ident_2`.
each: The column name in metadata to separate the cells into different
cases.
When this is specified, the case will be expanded for each value of
the column in metadata. For example, when you have `envs.cases."Cluster Markers".each = "Sample"`,
then the case will be expanded as `envs.cases."Cluster Markers - Sample1"`, `envs.cases."Cluster Markers - Sample2"`, etc.
You can specify `allmarker_plots` and `overlaps` to plot the markers for all cases in the same plot and plot the overlaps of the markers
between different cases by values in this column.
`"ident"` can be used as an alias for the default identity column (e.g. `"seurat_clusters"`).
dbs (list): The dbs to do enrichment analysis for significant markers.
You can use built-in dbs in `enrichit`, or provide your own gmt files.
See also <https://pwwang.github.io/enrichit/reference/FetchGMT.html>.
The built-in dbs include:
* "BioCarta" or "BioCarta_2016"
* "GO_Biological_Process" or "GO_Biological_Process_2025"
* "GO_Cellular_Component" or "GO_Cellular_Component_2025"
* "GO_Molecular_Function" or "GO_Molecular_Function_2025"
* "KEGG", "KEGG_Human", "KEGG_2021", or "KEGG_2021_Human"
* "Hallmark", "MSigDB_Hallmark", or "MSigDB_Hallmark_2020"
* "Reactome", "Reactome_Pathways", or "Reactome_Pathways_2024"
* "WikiPathways", "WikiPathways_2024", "WikiPathways_Human", or "WikiPathways_2024_Human"
You can also fetch more dbs from <https://maayanlab.cloud/Enrichr/#libraries>.
sigmarkers: An expression passed to `dplyr::filter()` to filter the
significant markers for enrichment analysis.
Available variables are `p_val`, `avg_log2FC`, `pct.1`, `pct.2` and
`p_val_adj`. For example, `"p_val_adj < 0.05 & abs(avg_log2FC) > 1"`
to select markers with adjusted p-value < 0.05 and absolute log2
fold change > 1.
enrich_style (choice): The style of the enrichment analysis.
The enrichment analysis will be done by `EnrichIt()` from [`enrichit`](https://pwwang.github.io/enrichit/).
Two styles are available:
- enrichr: `enrichr` style enrichment analysis (fisher's exact test will be used).
- clusterprofiler: `clusterProfiler` style enrichment analysis (hypergeometric test will be used).
- clusterProfiler: alias for `clusterprofiler`
assay: The assay to use.
subset: An expression to subset the cells for each case.
error (flag): Stop the job if errors happen.
Helpful when no/not enough markers are found or no pathways are enriched.
If `False`, empty results will be returned.
cache (type=auto): Where to cache the results.
If `True`, cache to `outdir` of the job. If `False`, don't cache.
Otherwise, specify the directory to cache to.
rest (ns): Rest arguments for `Seurat::FindMarkers()`.
Use `-` to replace `.` in the argument name. For example,
use `min-pct` instead of `min.pct`.
- <more>: See <https://satijalab.org/seurat/reference/findmarkers>
allmarker_plots_defaults (ns): Default options for the plots for all markers when `ident_1` is not specified.
- plot_type: The type of the plot.
See <https://pwwang.github.io/biopipen.utils.R/reference/VizDEGs.html>.
Available types are `violin`, `box`, `bar`, `ridge`, `dim`, `heatmap` and `dot`.
- more_formats (type=list): The extra formats to save the plot in.
- save_code (flag): Whether to save the code to generate the plot.
- devpars (ns): The device parameters for the plots.
- res (type=int): The resolution of the plots.
- height (type=int): The height of the plots.
- width (type=int): The width of the plots.
- <more>: Other arguments passed to [`biopipen.utils::VizDEGs()`](https://pwwang.github.io/biopipen.utils.R/reference/VizDEGs.html).
allmarker_plots (type=json): All marker plot cases.
The keys are the names of the cases and the values are the dicts inherited from `allmarker_plots_defaults`.
allenrich_plots_defaults (ns): Default options for the plots to generate for the enrichment analysis.
- plot_type: The type of the plot.
- devpars (ns): The device parameters for the plots.
- res (type=int): The resolution of the plots.
- height (type=int): The height of the plots.
- width (type=int): The width of the plots.
- db (type=str): The database(s) to apply for the plot. If not specified, all databases will be applied.
`dbs` can also be used as an alias for this parameter.
- <more>: See <https://pwwang.github.io/scplotter/reference/EnrichmentPlot.html>.
allenrich_plots (type=json): Cases of the plots to generate for the enrichment analysis.
The keys are the names of the cases and the values are the dicts inherited from `allenrich_plots_defaults`.
The cases under `envs.cases` can inherit this options.
marker_plots_defaults (ns): Default options for the plots to generate for the markers.
- plot_type: The type of the plot.
See <https://pwwang.github.io/biopipen.utils.R/reference/VizDEGs.html>.
Available types are `violin`, `box`, `bar`, `ridge`, `dim`, `heatmap` and `dot`.
There are two additional types available - `volcano_pct` and `volcano_log2fc`.
- more_formats (type=list): The extra formats to save the plot in.
- save_code (flag): Whether to save the code to generate the plot.
- devpars (ns): The device parameters for the plots.
- res (type=int): The resolution of the plots.
- height (type=int): The height of the plots.
- width (type=int): The width of the plots.
- <more>: Other arguments passed to [`biopipen.utils::VizDEGs()`](https://pwwang.github.io/biopipen.utils.R/reference/VizDEGs.html).
If `plot_type` is `volcano_pct` or `volcano_log2fc`, they will be passed to
[`scplotter::VolcanoPlot()`](https://pwwang.github.io/plotthis/reference/VolcanoPlot.html).
marker_plots (type=json): Cases of the plots to generate for the markers.
Plot cases. The keys are the names of the cases and the values are the dicts inherited from `marker_plots_defaults`.
The cases under `envs.cases` can inherit this options.
enrich_plots_defaults (ns): Default options for the plots to generate for the enrichment analysis.
- plot_type: The type of the plot.
See <https://pwwang.github.io/scplotter/reference/EnrichmentPlot.html>.
Available types are `bar`, `dot`, `lollipop`, `network`, `enrichmap` and `wordcloud`.
- more_formats (type=list): The extra formats to save the plot in.
- save_code (flag): Whether to save the code to generate the plot.
- devpars (ns): The device parameters for the plots.
- res (type=int): The resolution of the plots.
- height (type=int): The height of the plots.
- width (type=int): The width of the plots.
- <more>: See <https://pwwang.github.io/scplotter/reference/EnrichmentPlot.html>.
enrich_plots (type=json): Cases of the plots to generate for the enrichment analysis.
The keys are the names of the cases and the values are the dicts inherited from `enrich_plots_defaults`.
The cases under `envs.cases` can inherit this options.
overlaps_defaults (ns): Default options for investigating the overlapping of significant markers between different cases or comparisons.
This means either `ident_1` should be empty, so that they can be expanded to multiple comparisons.
- sigmarkers: The expression to filter the significant markers for each case.
If not provided, `envs.sigmarkers` will be used.
- plot_type (choice): The type of the plot to generate for the overlaps.
- venn: Use `plotthis::VennDiagram()`.
- upset: Use `plotthis::UpsetPlot()`.
- more_formats (type=list): The extra formats to save the plot in.
- save_code (flag): Whether to save the code to generate the plot.
- devpars (ns): The device parameters for the plots.
- res (type=int): The resolution of the plots.
- height (type=int): The height of the plots.
- width (type=int): The width of the plots.
- <more>: More arguments pased to `plotthis::VennDiagram()`
(<https://pwwang.github.io/plotthis/reference/venndiagram1.html>)
or `plotthis::UpsetPlot()`
(<https://pwwang.github.io/plotthis/reference/upsetplot1.html>)
overlaps (type=json): Cases for investigating the overlapping of significant markers between different cases or comparisons.
The keys are the names of the cases and the values are the dicts inherited from `overlaps_defaults`.
There are two situations that we can perform overlaps:
1. If `ident_1` is not specified, the overlaps can be performed between different comparisons.
2. If `each` is specified, the overlaps can be performed between different cases, where in each case, `ident_1` must be specified.
cases (type=json): If you have multiple cases for marker discovery, you can specify them
here. The keys are the names of the cases and the values are the above options. If some options are
not specified, the default values specified above (under `envs`) will be used.
If no cases are specified, the default case will be added with the default values under `envs` with the name `Marker Discovery`.
""" # noqa: E501
input = "srtobj:file"
output = "outdir:dir:{{in.srtobj | stem0}}.markers"
lang = config.lang.rscript
envs = {
"ncores": config.misc.ncores,
"mutaters": {},
"group_by": None,
"ident_1": None,
"ident_2": None,
"each": None,
"dbs": ["KEGG_2021_Human", "MSigDB_Hallmark_2020"],
"sigmarkers": "p_val_adj < 0.05",
"enrich_style": "enrichr",
"assay": None,
"error": True,
"subset": None,
"cache": config.path.tmpdir,
"rest": {},
"allmarker_plots_defaults": {
"plot_type": None,
"more_formats": [],
"save_code": False,
"devpars": {"res": 100},
},
"allmarker_plots": {},
"allenrich_plots_defaults": {
"plot_type": "heatmap",
"devpars": {"res": 100},
},
"allenrich_plots": {},
"marker_plots_defaults": {
"plot_type": None,
"more_formats": [],
"save_code": False,
"devpars": {"res": 100},
},
"marker_plots": {
"Volcano Plot (diff_pct)": {"plot_type": "volcano_pct"},
"Volcano Plot (log2FC)": {"plot_type": "volcano_log2fc"},
"Dot Plot": {
"plot_type": "dot",
"devpars": {"width": 500, "height": 720},
},
},
"enrich_plots_defaults": {
"more_formats": [],
"save_code": False,
"devpars": {"res": 100},
},
"enrich_plots": {
"Bar Plot": {"plot_type": "bar", "ncol": 1, "top_term": 10},
},
"overlaps_defaults": {
"sigmarkers": None,
"plot_type": "venn",
"more_formats": [],
"save_code": False,
"devpars": {"res": 100},
},
"overlaps": {},
"cases": {},
}
order = 5
script = "file://../scripts/scrna/MarkersFinder.R"
plugin_opts = {
"report": "file://../reports/scrna/MarkersFinder.svelte",
"report_paging": 8,
}
class TopExpressingGenes(Proc):DOCS
"""Find the top expressing genes in each cluster
Input:
srtobj: The seurat object in RDS or qs/qs2 format
Output:
outdir: The output directory for the tables and plots
Envs:
mutaters (type=json): The mutaters to mutate the metadata.
You can also use the clone selectors to select the TCR clones/clusters.
See <https://pwwang.github.io/scplotter/reference/clone_selectors.html>.
You can also use key `<newcol>:ident` to set the `<newcol>` as the default
ident for the stats.
See also <https://pwwang.github.io/biopipen.utils.R/reference/MutateSeuratMeta.html>
ident: The group of cells to find the top expressing genes.
The cells will be selected by the `group_by` column with this
`ident` value in metadata.
If not provided, the top expressing genes will be found for all
groups of cells in the `group_by` column.
group_by: The column name in metadata to group the cells.
each: The column name in metadata to separate the cells into different
cases.
`"ident"` can be used as an alias for the default identity column (e.g. `"seurat_clusters"`).
dbs (list): The dbs to do enrichment analysis for significant markers.
You can use built-in dbs in `enrichit`, or provide your own gmt files.
See also <https://pwwang.github.io/enrichit/reference/FetchGMT.html>.
The built-in dbs include:
* "BioCarta" or "BioCarta_2016"
* "GO_Biological_Process" or "GO_Biological_Process_2025"
* "GO_Cellular_Component" or "GO_Cellular_Component_2025"
* "GO_Molecular_Function" or "GO_Molecular_Function_2025"
* "KEGG", "KEGG_Human", "KEGG_2021", or "KEGG_2021_Human"
* "Hallmark", "MSigDB_Hallmark", or "MSigDB_Hallmark_2020"
* "Reactome", "Reactome_Pathways", or "Reactome_Pathways_2024"
* "WikiPathways", "WikiPathways_2024", "WikiPathways_Human", or "WikiPathways_2024_Human"
You can also fetch more dbs from <https://maayanlab.cloud/Enrichr/#libraries>.
n (type=int): The number of top expressing genes to find.
enrich_style (choice): The style of the enrichment analysis.
The enrichment analysis will be done by `EnrichIt()` from [`enrichit`](https://pwwang.github.io/enrichit/).
Two styles are available:
- enrichr: `enrichr` style enrichment analysis (fisher's exact test will be used).
- clusterprofiler: `clusterProfiler` style enrichment analysis (hypergeometric test will be used).
- clusterProfiler: alias for `clusterprofiler`
enrich_plots_defaults (ns): Default options for the plots to generate for the enrichment analysis.
- plot_type: The type of the plot.
See <https://pwwang.github.io/scplotter/reference/EnrichmentPlot.html>.
Available types are `bar`, `dot`, `lollipop`, `network`, `enrichmap` and `wordcloud`.
- more_formats (type=list): The extra formats to save the plot in.
- save_code (flag): Whether to save the code to generate the plot.
- devpars (ns): The device parameters for the plots.
- res (type=int): The resolution of the plots.
- height (type=int): The height of the plots.
- width (type=int): The width of the plots.
- <more>: See <https://pwwang.github.io/scplotter/reference/EnrichmentPlot.htmll>.
enrich_plots (type=json): Cases of the plots to generate for the enrichment analysis.
The keys are the names of the cases and the values are the dicts inherited from `enrich_plots_defaults`.
The cases under `envs.cases` can inherit this options.
subset: An expression to subset the cells for each case.
error (flag): Stop the job if errors happen.
Helpful when no/not enough markers are found or no pathways are enriched.
If `False`, empty results will be returned.
cases (type=json): If you have multiple cases, you can specify them
here. The keys are the names of the cases and the values are the
above options except `mutaters`. If some options are
not specified, the default values specified above will be used.
If no cases are specified, the default case will be added with
the default values under `envs` with the name `Top Expressing Genes`.
""" # noqa: E501
input = "srtobj:file"
output = "outdir:dir:{{in.srtobj | stem}}.top_expressing_genes"
lang = config.lang.rscript
script = "file://../scripts/scrna/TopExpressingGenes.R"
envs = {
"mutaters": {},
"ident": None,
"group_by": None,
"each": None,
"dbs": ["KEGG_2021_Human", "MSigDB_Hallmark_2020"],
"n": 250,
"subset": None,
"error": False,
"enrich_style": "enrichr",
"enrich_plots_defaults": {
"more_formats": [],
"save_code": False,
"devpars": {"res": 100},
},
"enrich_plots": {
"Bar Plot": {"plot_type": "bar", "ncol": 1, "top_term": 10},
},
"cases": {},
}
plugin_opts = {
"report": "file://../reports/common.svelte",
"report_paging": 8,
}
class ExprImputation(Proc):DOCS
"""This process imputes the dropout values in scRNA-seq data.
It takes the Seurat object as input and outputs the Seurat object with
imputed expression data.
Reference:
- [Linderman, George C., Jun Zhao, and Yuval Kluger. "Zero-preserving imputation of scRNA-seq data using low-rank approximation." BioRxiv (2018): 397588.](https://www.nature.com/articles/s41467-021-27729-z)
- [Li, Wei Vivian, and Jingyi Jessica Li. "An accurate and robust imputation method scImpute for single-cell RNA-seq data." Nature communications 9.1 (2018): 997.](https://www.nature.com/articles/s41467-018-03405-7)
- [Dijk, David van, et al. "MAGIC: A diffusion-based imputation method reveals gene-gene interactions in single-cell RNA-sequencing data." BioRxiv (2017): 111591.](https://www.cell.com/cell/abstract/S0092-8674(18)30724-4)
Input:
infile: The input file in RDS/qs format of Seurat object
Output:
outfile: The output file in RDS format of Seurat object
Note that with rmagic and alra, the original default assay will be
renamed to `RAW` and the imputed RNA assay will be
renamed to `RNA` and set as default assay.
Envs:
tool (choice): Either alra, scimpute or rmagic
- alra: Use RunALRA() from Seurat
- scimpute: Use scImpute() from scimpute
- rmagic: Use magic() from Rmagic
scimpute_args (ns): The arguments for scimpute
- drop_thre (type=float): The dropout threshold
- kcluster (type=int): Number of clusters to use
- ncores (type=int): Number of cores to use
- refgene: The reference gene file
rmagic_args (ns): The arguments for rmagic
- python: The python path where magic-impute is installed.
- threshold (type=float): The threshold for magic imputation.
Only the genes with dropout rates greater than this threshold (No. of
cells with non-zero expression / total number of cells) will be imputed.
alra_args (type=json): The arguments for `RunALRA()`
Requires:
r-scimpute:
- if: {{proc.envs.tool == "scimpute"}}
- check: {{proc.lang}} <(echo "library(scImpute)")
r-rmagic:
- if: {{proc.envs.tool == "rmagic"}}
- check: |
{{proc.lang}} <(\
echo "\
tryCatch(\
{ setwd(dirname(Sys.getenv('CONDA_PREFIX'))) }, \
error = function(e) NULL \
); \
library(Rmagic)\
"\
)
magic-impute:
- if: {{proc.envs.tool == "rmagic"}}
- check: {{proc.envs.rmagic_args.python}} -c "import magic")
r-dplyr:
- if: {{proc.envs.tool == "scimpute"}}
- check: {{proc.lang}} <(echo "library(dplyr)")
r-seurat:
- check: {{proc.lang}} <(echo "library(Seurat)")
r-seuratwrappers:
- if: {{proc.envs.tool == "alra"}}
- check: {{proc.lang}} <(echo "library(SeuratWrappers)")
""" # noqa: E501
input = "infile:file"
output = "outfile:file:{{in.infile | stem}}.imputed.qs"
lang = config.lang.rscript
envs = {
"tool": "alra",
"rmagic_args": {"python": config.exe.magic_python, "threshold": 0.5},
"scimpute_args": {
"drop_thre": 0.5,
"kcluster": None,
"ncores": config.misc.ncores,
"refgene": config.ref.refgene,
},
"alra_args": {},
}
script = "file://../scripts/scrna/ExprImputation.R"
class SCImpute(Proc):DOCS
"""Impute the dropout values in scRNA-seq data.
Deprecated. Use `ExprImputation` instead.
Input:
infile: The input file for imputation
Either a SeuratObject or a matrix of count/TPM
groupfile: The file to subset the matrix or label the cells
Could be an output from ImmunarchFilter
Output:
outfile: The output matrix
Envs:
infmt: The input format.
Either `seurat` or `matrix`
"""
input = "infile:file, groupfile:file"
output = [
"outfile:file:{{in.infile | stem | replace: '.seurat', ''}}." "{{envs.outfmt}}"
]
lang = config.lang.rscript
envs = {
"infmt": "seurat", # or matrix
"outfmt": "txt", # or csv, rds
"type": "count", # or TPM
"drop_thre": 0.5,
"kcluster": None, # or Kcluster
"ncores": config.misc.ncores,
"refgene": config.ref.refgene,
}
script = "file://../scripts/scrna/SCImpute.R"
class SeuratFilter(Proc):DOCS
"""Filtering cells from a seurat object
Input:
srtobj: The seurat object in RDS
filters: The filters to apply. Could be a file or string in TOML, or
a python dictionary, with following keys:
- mutaters: Create new columns in the metadata
- filter: A R expression that will pass to
`subset(sobj, subset = ...)` to filter the cells
Output:
outfile: The filtered seurat object in RDS
Envs:
invert: Invert the selection?
Requires:
r-seurat:
- check: {{proc.lang}} <(echo "library('Seurat')")
r-dplyr:
- check: {{proc.lang}} <(echo "library('dplyr')")
"""
input = "srtobj:file, filters:var"
output = "outfile:file:{{in.srtobj | stem}}.filtered.RDS"
lang = config.lang.rscript
envs = {"invert": False}
script = "file://../scripts/scrna/SeuratFilter.R"
class SeuratSubset(Proc):DOCS
"""Subset a seurat object into multiple seruat objects
Input:
srtobj: The seurat object in RDS
subsets: The subsettings to apply. Could be a file or string in TOML, or
a python dictionary, with following keys:
- <name>: Name of the case
mutaters: Create new columns in the metadata
subset: A R expression that will pass to
`subset(sobj, subset = ...)`
groupby: The column to group by, each value will be a case
If groupby is given, subset will be ignored, each value
of the groupby column will be a case
Output:
outdir: The output directory with the subset seurat objects
Envs:
ignore_nas: Ignore NA values?
Requires:
r-seurat:
- check: {{proc.lang}} <(echo "library('Seurat')")
r-dplyr:
- check: {{proc.lang}} <(echo "library('dplyr')")
"""
input = "srtobj:file, subsets:var"
output = "outdir:dir:{{in.srtobj | stem}}.subsets"
envs = {"ignore_nas": True}
lang = config.lang.rscript
script = "file://../scripts/scrna/SeuratSubset.R"
class SeuratSplit(Proc):DOCS
"""Split a seurat object into multiple seruat objects
Input:
srtobj: The seurat object in RDS
by: The metadata column to split by
Output:
outdir: The output directory with the subset seurat objects
Envs:
by: The metadata column to split by
Ignored if `by` is given in the input
recell: Rename the cell ids using the `by` column
A string of R function taking the original cell ids and `by`
"""
input = "srtobj:file, by:var"
output = "outdir:dir:{{in.srtobj | stem}}.subsets"
envs = {
"by": None,
"recell": None, # "function(cellid, by) {}",
}
lang = config.lang.rscript
script = "file://../scripts/scrna/SeuratSplit.R"
class Subset10X(Proc):DOCS
"""Subset 10X data, mostly used for testing
Requires r-matrix to load matrix.mtx.gz
Input:
indir: The input directory
Output:
outdir: The output directory
Envs:
seed: The seed for random number generator
nfeats: The number of features to keep.
If <=1 then it will be the percentage of features to keep
ncells: The number of cells to keep.
If <=1 then it will be the percentage of cells to keep
feats_to_keep: The features/genes to keep.
The final features list will be `feats_to_keep` + `nfeats`
"""
input = "indir:dir"
output = "outdir:dir:{{in.indir | stem}}"
envs = {
"seed": 8525,
"nfeats": 0.1,
"ncells": 0.1,
"feats_to_keep": [],
}
lang = config.lang.rscript
script = "file://../scripts/scrna/Subset10X.R"
class SeuratTo10X(Proc):DOCS
"""Write a Seurat object to 10X format
using `write10xCounts` from `DropletUtils`
Input:
srtobj: The seurat object in RDS
Output:
outdir: The output directory.
When `envs.split_by` is specified, the subdirectories will be
created for each distinct value of the column.
Otherwise, the matrices will be written to the output directory.
Envs:
version: The version of 10X format
"""
input = "srtobj:file"
output = "outdir:dir:{{in.srtobj | stem}}"
envs = {"version": "3", "split_by": None}
lang = config.lang.rscript
script = "file://../scripts/scrna/SeuratTo10X.R"
class ScFGSEA(Proc):DOCS
"""Gene set enrichment analysis for cells in different groups using `fgsea`
This process allows us to do Gene Set Enrichment Analysis (GSEA) on the expression data,
but based on variaties of grouping, including the from the meta data and the
scTCR-seq data as well.
The GSEA is done using the
[fgsea](https://bioconductor.org/packages/release/bioc/html/fgsea.html) package,
which allows to quickly and accurately calculate arbitrarily low GSEA P-values
for a collection of gene sets.
The fgsea package is based on the fast algorithm for preranked GSEA described in
[Subramanian et al. 2005](https://www.pnas.org/content/102/43/15545).
For each case, the process will generate a table with the enrichment scores for
each gene set, and GSEA plots for the top gene sets.
Examples:
### The summary and GSEA plots
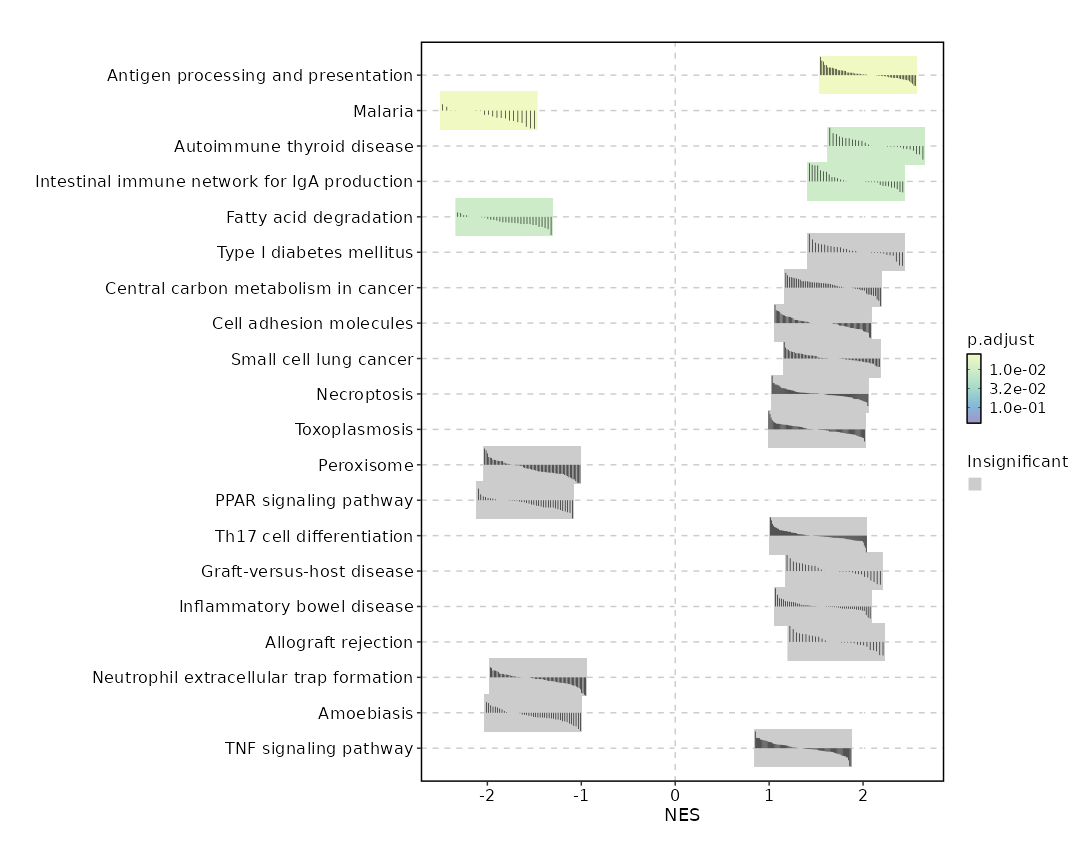{: width="80%"}
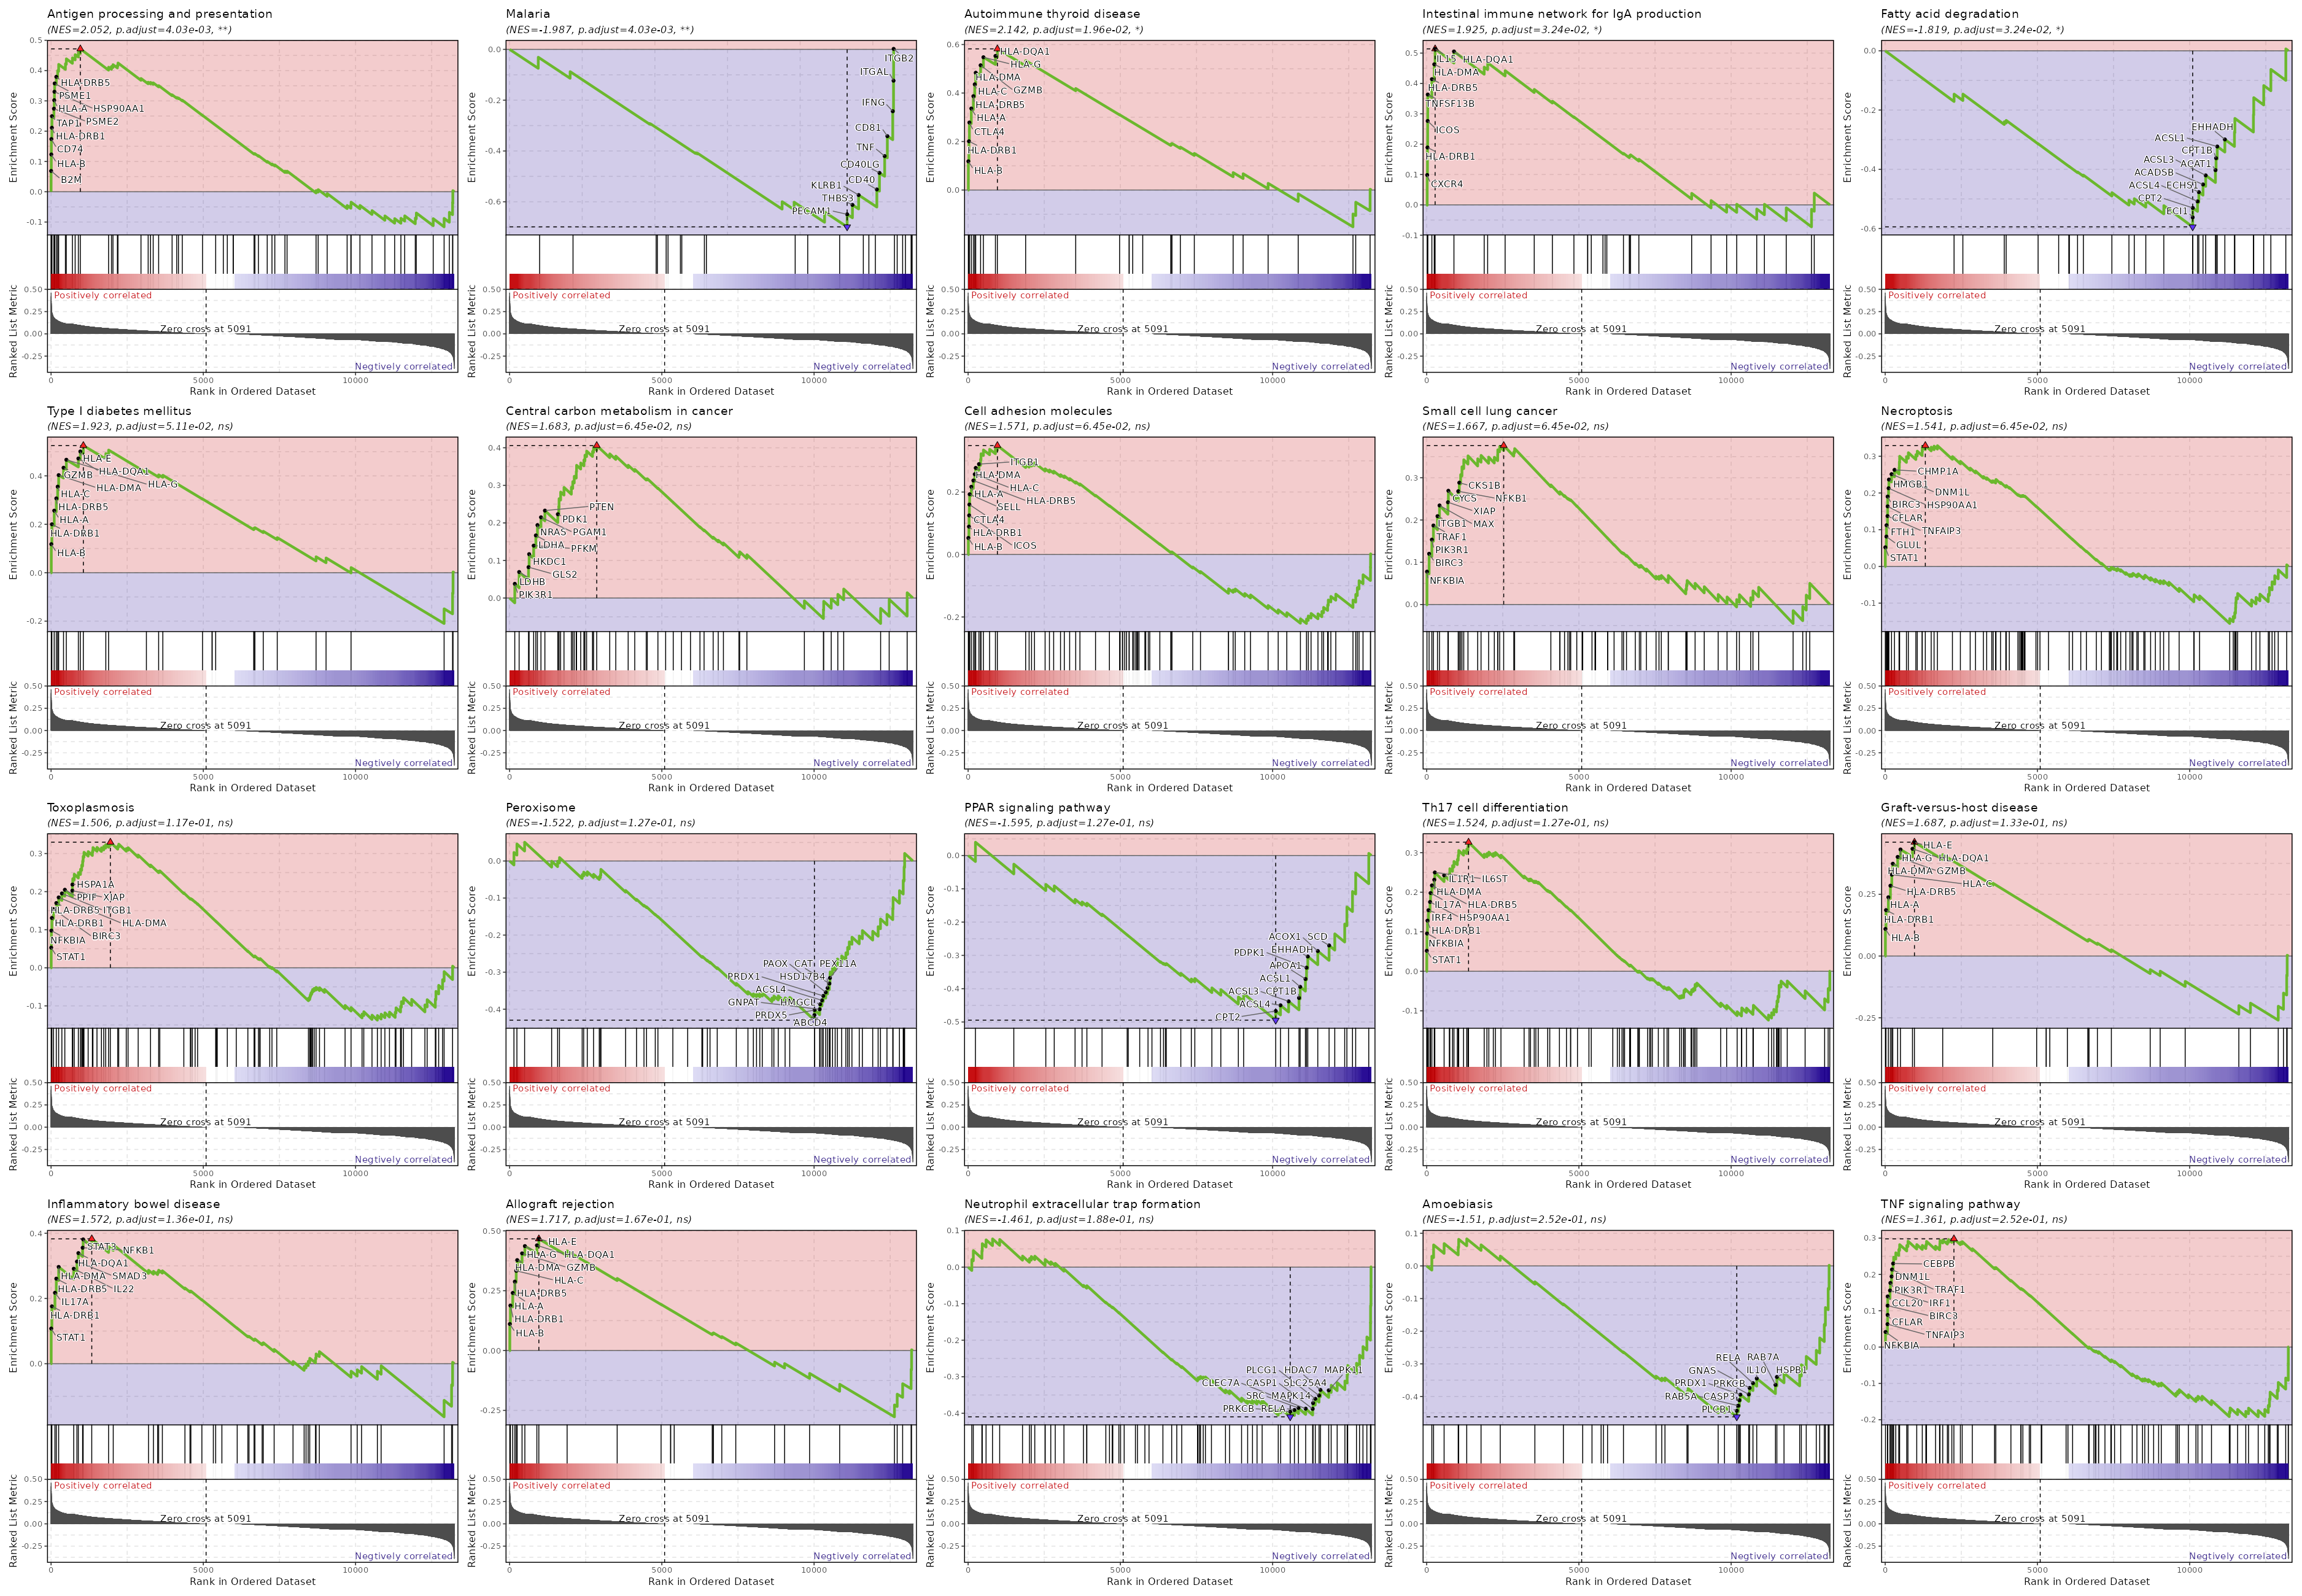{: width="80%"}
### Summary plot for all subsets or idents
If you use `each` to separate the cells into different subsets, this is useful to
make a summary plot for all subsets. Or if you don't specify `ident_1`, the summary plot for all idents in `group_by` will be generated.
```toml
[ScFGSEA.envs]
group_by = "Diagnosis"
ident_1 = "Colitis"
ident_2 = "Control"
each = "seurat_clusters"
[ScFGSEA.envs.alleach_plots.Heatmap]
plot_type = "heatmap"
group_by = "Diagnosis"
```
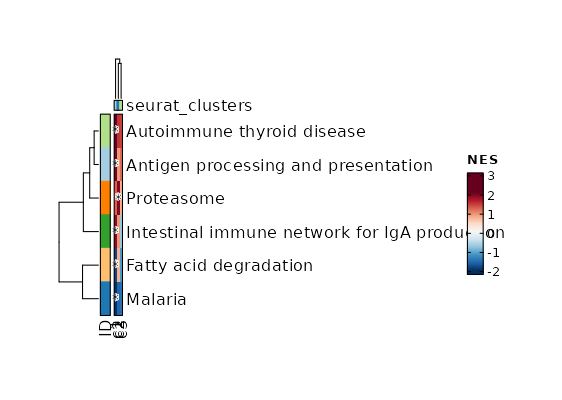{: width="80%"}
Input:
srtobj: The seurat object in RDS format
Output:
outdir: The output directory for the results and plots
Envs:
ncores (type=int): Number of cores for parallelization
Passed to `nproc` of `fgseaMultilevel()`.
cache (type=auto): Where to cache the results.
If `True`, cache to `outdir` of the job. If `False`, don't cache.
Otherwise, specify the directory to cache to.
mutaters (type=json): The mutaters to mutate the metadata.
The key-value pairs will be passed the `dplyr::mutate()` to mutate the metadata.
You can also use the clone selectors to select the TCR clones/clusters.
See <https://pwwang.github.io/scplotter/reference/clone_selectors.html>.
You can also use key `<newcol>:ident` to set the `<newcol>` as the default
ident for the stats.
See also <https://pwwang.github.io/biopipen.utils.R/reference/MutateSeuratMeta.html>
group_by: The column name in metadata to group the cells.
ident_1: The first group of cells to compare
ident_2: The second group of cells to compare, if not provided, the rest of the cells that are not `NA`s in `group_by` column are used for `ident_2`.
assay: The assay to use. If not provided, the default assay will be used.
each: The column name in metadata to separate the cells into different subsets to do the analysis.
`"ident"` can be used as an alias for the default identity column (e.g. `"seurat_clusters"`).
subset: An expression to subset the cells.
error (flag): Stop the job if errors happen.
Helpful when no/not enough markers are found or no pathways are enriched.
If `False`, empty results will be returned.
gmtfile: The pathways in GMT format, with the gene names/ids in the same format as the seurat object.
You can use built-in dbs in `enrichit`, or provide your own gmt files.
See also <https://pwwang.github.io/enrichit/reference/FetchGMT.html>.
The built-in dbs include:
* "BioCarta" or "BioCarta_2016"
* "GO_Biological_Process" or "GO_Biological_Process_2025"
* "GO_Cellular_Component" or "GO_Cellular_Component_2025"
* "GO_Molecular_Function" or "GO_Molecular_Function_2025"
* "KEGG", "KEGG_Human", "KEGG_2021", or "KEGG_2021_Human"
* "Hallmark", "MSigDB_Hallmark", or "MSigDB_Hallmark_2020"
* "Reactome", "Reactome_Pathways", or "Reactome_Pathways_2024"
* "WikiPathways", "WikiPathways_2024", "WikiPathways_Human", or "WikiPathways_2024_Human"
You can also fetch more dbs from <https://maayanlab.cloud/Enrichr/#libraries>.
method (choice): The method to do the preranking.
- signal_to_noise: Signal to noise.
The larger the differences of the means (scaled by the standard deviations);
that is, the more distinct the gene expression is in each phenotype and the more the gene
acts as a "class marker".
- s2n: Alias of signal_to_noise.
- abs_signal_to_noise: The absolute value of signal_to_noise.
- abs_s2n: Alias of abs_signal_to_noise.
- t_test: T test.
Uses the difference of means scaled by the standard deviation and number of samples.
- ratio_of_classes: Also referred to as fold change.
Uses the ratio of class means to calculate fold change for natural scale data.
- diff_of_classes: Difference of class means.
Uses the difference of class means to calculate fold change for nature scale data
- log2_ratio_of_classes: Log2 ratio of class means.
Uses the log2 ratio of class means to calculate fold change for natural scale data.
This is the recommended statistic for calculating fold change for log scale data.
top (type=auto): Do gsea table and enrich plot for top N pathways.
If it is < 1, will apply it to `padj`, selecting pathways with `padj` < `top`.
eps (type=float): This parameter sets the boundary for calculating the p value.
See <https://rdrr.io/bioc/fgsea/man/fgseaMultilevel.html>
alleach_plots_defaults (ns): Default options for the plots to generate for all pathways.
- plot_type: The type of the plot, currently either dot or heatmap (default)
- devpars (ns): The device parameters for the plots.
- res (type=int): The resolution of the plots.
- height (type=int): The height of the plots.
- width (type=int): The width of the plots.
- <more>: See <https://pwwang.github.io/biopipen.utils.R/reference/VizGSEA.html>.
alleach_plots (type=json): Cases of the plots to generate for all pathways.
The keys are the names of the cases and the values are the dicts inherited from `alleach_plots_defaults`.
minsize (type=int): Minimal size of a gene set to test. All pathways below the threshold are excluded.
maxsize (type=int): Maximal size of a gene set to test. All pathways above the threshold are excluded.
rest (type=json;order=98): Rest arguments for [`fgsea()`](https://rdrr.io/bioc/fgsea/man/fgsea.html)
See also <https://rdrr.io/bioc/fgsea/man/fgseaMultilevel.html>
cases (type=json;order=99): If you have multiple cases, you can specify them here.
The keys are the names of the cases and the values are the above options except `mutaters`.
If some options are not specified, the default values specified above will be used.
If no cases are specified, the default case will be added with the name `GSEA`.
Requires:
bioconductor-fgsea:
- check: {{proc.lang}} -e "library(fgsea)"
r-seurat:
- check: {{proc.lang}} -e "library(seurat)"
""" # noqa: E501
input = "srtobj:file"
output = "outdir:dir:{{(in.casefile or in.srtobj) | stem0}}.fgsea"
lang = config.lang.rscript
envs = {
"mutaters": {},
"ncores": config.misc.ncores,
"cache": config.path.tmpdir,
"assay": None,
"group_by": None,
"ident_1": None,
"ident_2": None,
"each": None,
"subset": None,
"error": False,
"gmtfile": "KEGG_2021_Human",
"method": "s2n",
"top": 20,
"minsize": 10,
"maxsize": 100,
"eps": 0,
"alleach_plots_defaults": {
"plot_type": "heatmap",
"devpars": {"res": 100},
},
"alleach_plots": {},
"rest": {},
"cases": {},
}
script = "file://../scripts/scrna/ScFGSEA.R"
plugin_opts = {
"report": "file://../reports/common.svelte",
"report_paging": 8,
}
class CellTypeAnnotation(Proc):DOCS
"""Annotate the cell clusters. Currently, four ways are supported:
1. Pass the cell type annotation directly
2. Use [`ScType`](https://github.com/IanevskiAleksandr/sc-type)
3. Use [`scCATCH`](https://github.com/ZJUFanLab/scCATCH)
4. Use [`hitype`](https://github.com/pwwang/hitype)
5. Use [`celltypist`](https://github.com/Teichlab/celltypist)
The annotated cell types will replace the original identity column in the metadata,
so that the downstream processes will use the annotated cell types.
/// Note
When cell types are annotated, the original identity column (e.g. `seurat_clusters`) will be renamed
to `envs.backup_col` (e.g. `seurat_clusters_id`), and the new identity column will be added.
///
If you are using `ScType`, `scCATCH`, or `hitype`, a text file containing the mapping from
the original identity to the new cell types will be generated and saved to
`cluster2celltype.tsv` under `<workdir>/<pipline_name>/CellTypeAnnotation/0/output/`.
Examples:
```toml
[CellTypeAnnotation.envs]
tool = "direct"
cell_types = ["CellType1", "CellType2", "-", "CellType4"]
```
The cell types will be assigned as:
```
0 -> CellType1
1 -> CellType2
2 -> 2
3 -> CellType4
```
Input:
sobjfile: The single-cell object in RDS/qs/qs2/h5ad format.
Output:
outfile: The rds/qs/qs2/h5ad file of seurat object with cell type annotated.
A text file containing the mapping from the old identity to the new cell types
will be generated and saved to `cluster2celltype.tsv` under the job output directory.
Note that if `envs.ident` is specified, the output Seurat object will have
the identity set to the specified column in metadata.
Envs:
tool (choice): The tool to use for cell type annotation.
- sctype: Use `scType` to annotate cell types.
See <https://github.com/IanevskiAleksandr/sc-type>
- hitype: Use `hitype` to annotate cell types.
See <https://github.com/pwwang/hitype>
- sccatch: Use `scCATCH` to annotate cell types.
See <https://github.com/ZJUFanLab/scCATCH>
- celltypist: Use `celltypist` to annotate cell types.
See <https://github.com/Teichlab/celltypist>
- direct: Directly assign cell types
sctype_tissue: The tissue to use for `sctype`.
Avaiable tissues should be the first column (`tissueType`) of `sctype_db`.
If not specified, all rows in `sctype_db` will be used.
sctype_db: The database to use for sctype.
Check examples at <https://github.com/IanevskiAleksandr/sc-type/blob/master/ScTypeDB_full.xlsx>
ident: The column name in metadata to use as the clusters.
If not specified, the identity column will be used when input is rds/qs/qs2 (supposing we have a Seurat object).
If input data is h5ad, this is required to run cluster-based annotation tools.
For `celltypist`, this is a shortcut to set `over_clustering` in `celltypist_args`.
backup_col: The backup column name to store the original identities.
If not specified, the original identity column will not be stored.
If `envs.newcol` is specified, this will be ignored.
hitype_tissue: The tissue to use for `hitype`.
Avaiable tissues should be the first column (`tissueType`) of `hitype_db`.
If not specified, all rows in `hitype_db` will be used.
hitype_db: The database to use for hitype.
Compatible with `sctype_db`.
See also <https://pwwang.github.io/hitype/articles/prepare-gene-sets.html>
You can also use built-in databases, including `hitypedb_short`, `hitypedb_full`, and `hitypedb_pbmc3k`.
cell_types (type=auto): The cell types to use for direct annotation.
If given as a list (array), you can use `"-"` or `""` as the placeholder for the clusters that
you want to keep the original cell types. If the length of `cell_types` is shorter than the number of
clusters, the remaining clusters will be kept as the original cell types.
You can also use `NA` to remove the clusters from downstream analysis. This
only works when `envs.newcol` is not specified.
If given as a dict (map), the keys are the original cluster names and the values are the new cell types.
/// Note
If `tool` is `direct` and `cell_types` is not specified or an empty list,
the original cell types will be kept and nothing will be changed.
///
more_cell_types (type=json): The additional cell type annotations to add to the metadata.
The keys are the new column names and the values are the cell types lists.
The cell type lists work the same as `cell_types` above.
This is useful when you want to keep multiple annotations of cell types.
sccatch_args (ns): The arguments for `scCATCH::findmarkergene()` if `tool` is `sccatch`.
- species: The specie of cells.
- cancer: If the sample is from cancer tissue, then the cancer type may be defined.
- tissue: Tissue origin of cells must be defined.
- marker: The marker genes for cell type identification.
- if_use_custom_marker (flag): Whether to use custom marker genes. If `True`, no `species`, `cancer`, and `tissue` are needed.
- <more>: Other arguments for [`scCATCH::findmarkergene()`](https://rdrr.io/cran/scCATCH/man/findmarkergene.html).
You can pass an RDS file to `sccatch_args.marker` to work as custom marker. If so,
`if_use_custom_marker` will be set to `TRUE` automatically.
celltypist_args (ns): The arguments for `celltypist::celltypist()` if `tool` is `celltypist`.
- model: The path to model file.
- python: The python path where celltypist is installed.
- majority_voting: When true, it refines cell identities within local subclusters after an over-clustering approach
at the cost of increased runtime.
- over_clustering (type=auto): The column name in metadata to use as clusters for majority voting.
Set to `False` to disable over-clustering.
When `in.sobjfile` is rds/qs/qs2 (supposing we have a Seurat object), the default ident is used by default.
Otherwise, it is False by default.
- assay: When converting a Seurat object to AnnData, the assay to use.
If input is h5seurat, this defaults to RNA.
If input is Seurat object in RDS, this defaults to the default assay.
merge (flag): Whether to merge the clusters with the same cell types.
Otherwise, a suffix will be added to the cell types (ie. `.1`, `.2`, etc).
newcol: The new column name to store the cell types.
If not specified, the identity column will be overwritten.
If specified, the original identity column will be kept and `Idents` will be kept as the original identity.
outtype (choice): The output file type. Currently only works for `celltypist`.
An RDS file will be generated for other tools.
- input: Use the same file type as the input.
- rds: Use RDS file.
- qs: Use qs2 file.
- qs2: Use qs2 file.
- h5ad: Use AnnData file.
Requires:
r-HGNChelper:
- if: {{proc.envs.tool == 'sctype'}}
- check: {{proc.lang}} -e "library(HGNChelper)"
r-seurat:
- if: {{proc.envs.tool == 'sctype'}}
- check: {{proc.lang}} -e "library(Seurat)"
r-dplyr:
- if: {{proc.envs.tool == 'sctype'}}
- check: {{proc.lang}} -e "library(dplyr)"
r-openxlsx:
- if: {{proc.envs.tool == 'sctype'}}
- check: {{proc.lang}} -e "library(openxlsx)"
""" # noqa: E501
input = "sobjfile:file"
output = (
"outfile:file:"
"{{in.sobjfile | stem}}.annotated."
"{{- ext0(in.sobjfile) if envs.outtype == 'input' else envs.outtype -}}"
)
lang = config.lang.rscript
envs = {
"tool": "hitype",
"sctype_tissue": None,
"sctype_db": config.ref.sctype_db,
"ident": None,
"backup_col": "seurat_clusters_id",
"cell_types": [],
"more_cell_types": None,
"sccatch_args": {
"species": None,
"cancer": "Normal",
"tissue": None,
"marker": None,
"if_use_custom_marker": False,
},
"hitype_tissue": None,
"hitype_db": None,
"celltypist_args": {
"model": None,
"python": config.lang.python,
"majority_voting": True,
"over_clustering": None,
"assay": None,
},
"merge": False,
"newcol": None,
"outtype": "input",
}
script = "file://../scripts/scrna/CellTypeAnnotation.R"
class SeuratMap2Ref(Proc):DOCS
"""Map the seurat object to reference
See: <https://satijalab.org/seurat/articles/integration_mapping.html>
and <https://satijalab.org/seurat/articles/multimodal_reference_mapping.html>
Details:
### Preparing a Seurat reference for mapping
#### Step 0: Create the Seurat reference object
Start from raw counts.
```r
reference <- CreateSeuratObject(counts = reference_counts)
```
At this stage the object should contain at least:
* RNA counts
* cell barcodes
#### Step 1: Choose normalization strategy
Two main normalization strategies are supported for reference mapping.
##### Option A — LogNormalize workflow
Recommended for:
* standard scRNA-seq
* single modality datasets
* smaller references
```r
reference <- NormalizeData(reference, normalization.method = "LogNormalize", scale.factor = 10000)
reference <- FindVariableFeatures(reference, selection.method = "vst", nfeatures = 2000)
reference <- ScaleData(reference)
```
This produces the normalized expression matrix used for PCA.
##### Option B — SCTransform workflow
Recommended for:
* large datasets
* heterogeneous samples
* multimodal references (e.g. CITE-seq)
```r
reference <- SCTransform(reference, verbose = FALSE)
```
Important notes:
* Creates an **SCT assay**
* Variable features and scaling are performed automatically
* Mapping later requires `normalization.method = "SCT"`
#### Step 2: Choose dimensional reduction
The reference must contain a dimensional reduction used for mapping.
##### Option A — PCA (standard references)
Used with LogNormalize.
```r
reference <- RunPCA(reference, verbose = FALSE)
```
Typical usage:
* 30-50 PCs
##### Option B — SPCA (supervised PCA)
Used with SCTransform references and often in multimodal workflows.
```r
reference <- RunSPCA(reference, assay = "SCT")
```
SPCA learns a projection supervised by a cell‑cell similarity graph and is commonly used in reference atlases.
#### Step 3: Compute neighbors and clustering (optional but recommended)
Precomputing neighbors allows faster anchor finding.
##### PCA reference
```r
reference <- FindNeighbors(reference, reduction = "pca", dims = 1:30)
reference <- FindClusters(reference, resolution = 0.5)
```
##### SPCA / multimodal reference
```r
reference <- FindMultiModalNeighbors(
reference,
reduction.list = list("spca"),
dims.list = list(1:30)
)
```
This creates a **weighted nearest neighbor (WNN)** graph.
#### Step 4: Compute UMAP and store the model
To allow `MapQuery` to project new cells into the same UMAP space, the model must be saved.
```r
reference <- RunUMAP(
reference,
reduction = "pca",
dims = 1:30,
return.model = TRUE
)
```
For WNN references:
```r
reference <- RunUMAP(
reference,
nn.name = "weighted.nn",
reduction.name = "wnn.umap",
return.model = TRUE
)
```
Storing the model enables **ProjectUMAP / MapQuery** to reuse the trained embedding.
#### Step 5: Annotate the reference
Reference mapping transfers metadata labels.
Add cell type annotations to metadata:
```r
reference$celltype <- annotated_celltypes
reference$celltype_l1 <- broad_labels
reference$celltype_l2 <- fine_labels
```
Any metadata field can later be transferred.
#### Step 6: Save the reference
```r
saveRDS(reference, "reference.rds")
```
Or save it in [qs2](https://github.com/qsbase/qs2) format for faster loading:
```r
biopipen.utils::save_obj(reference, "reference.qs")
```
This allows the reference to be reused across multiple mapping runs.
### Prepare the query dataset (can be done with `SeuratPreparing` process)
The **query must use the same normalization method as the reference**.
If the query is not normalized in the same way as the reference, you can specify arguments
in `envs.NormalizeData` or `envs.SCTransform` for this process to reproduce the same normalization.
You can also specify `envs.skip_if_normalized = false` to force re‑normalization of the query dataset.
### Find transfer anchors (arguments specified in `envs.FindTransferAnchors`)
Anchors link cells between the query and reference.
#### LogNormalize reference
```r
anchors <- FindTransferAnchors(
reference = reference,
query = query,
reference.reduction = "pca",
dims = 1:30,
normalization.method = "LogNormalize"
)
```
#### SCTransform reference
```r
anchors <- FindTransferAnchors(
reference = reference,
query = query,
reference.reduction = "spca",
dims = 1:30,
normalization.method = "SCT"
)
```
Optional useful parameters:
* `reference.assay = "SCT"`
* `recompute.residuals = TRUE`
* `reference.neighbors = "pca.nn"` (reuse neighbor index if precomputed)
### Map the query (arguments specified in `envs.MapQuery`)
```r
query <- MapQuery(
anchorset = anchors,
query = query,
reference = reference,
refdata = list(celltype = "celltype"),
reference.reduction = "pca",
reduction.model = "umap"
)
```
`MapQuery` performs:
1. `TransferData`
2. `IntegrateEmbeddings`
3. `ProjectUMAP`
The query cells will:
* receive predicted cell type labels
* be projected into the reference UMAP
The reference UMAP reduction is reused and saved in the query object as `ref.umap`.
### Decision summary
| Reference type | Normalization | Reduction | Typical use |
| ----------------------- | ------------- | ---------- | --------------------------------- |
| Standard scRNA‑seq | LogNormalize | PCA | Single modality datasets |
| Large / atlas reference | SCTransform | SPCA | Large heterogeneous datasets |
| Multimodal reference | SCTransform | SPCA + WNN | CITE‑seq / multimodal integration |
---
### Important rules
1. Query and reference **must use the same normalization strategy**.
2. The **reference dimensional reduction must already exist**.
3. Metadata labels in the reference are required for label transfer.
4. Store a **UMAP model (`return.model = TRUE`)** to enable projection.
5. Precomputing neighbors improves performance for repeated mapping.
6. Use `ref.umap` for consistent visualization of mapped query cells.
### Practical advice
For high-quality reference atlases:
* integrate multiple datasets first
* curate annotations carefully
* use ~30-50 PCs
* keep metadata hierarchy (broad → fine labels)
The reference effectively acts as a **pretrained cell atlas** that new datasets can be projected onto.
Input:
sobjfile: The seurat object
Output:
outfile: The rds file of seurat object with cell type annotated.
Note that the reduction name will be `ref.umap` for the mapping.
To visualize the mapping, you should use `ref.umap` as the reduction name.
Envs:
ncores (type=int;order=-100): Number of cores to use.
When `split_by` is used, this will be the number of cores for each object to map to the reference.
When `split_by` is not used, this is used in `future::plan(strategy = "multicore", workers = <ncores>)`
to parallelize some Seurat procedures.
See also: <https://satijalab.org/seurat/archive/v3.0/future_vignette.html>
mutaters (type=json): The mutaters to mutate the metadata.
This is helpful when we want to create new columns for `split_by`.
See <https://pwwang.github.io/biopipen.utils.R/reference/MutateSeuratMeta.html>.
use: A column name of metadata from the reference
(e.g. `celltype.l1`, `celltype.l2`) to transfer to the query as the
cell types (ident) for downstream analysis. This field is required.
If you want to transfer multiple columns, you can use
`envs.MapQuery.refdata`.
ident: The name of the ident for query transferred from `envs.use` of the reference.
ref: The reference seurat object file.
Either an RDS file or a h5seurat file that can be loaded by
`Seurat::LoadH5Seurat()`.
The file type is determined by the extension. `.rds` or `.RDS` for
RDS file, `.h5seurat` or `.h5` for h5seurat file.
refnorm (choice): Normalization method the reference used. The same method will be used for the query.
- LogNormalize: Using [`NormalizeData`](https://satijalab.org/seurat/reference/normalizedata).
- SCTransform: Using [`SCTransform`](https://satijalab.org/seurat/reference/sctransform).
- SCT: Alias of SCTransform.
- auto: Automatically detect the normalization method.
If the default assay of reference is `SCT`, then `SCTransform` will be used.
split_by: The column name in metadata to split the query into multiple objects.
This helps when the original query is too large to process.
skip_if_normalized: Skip normalization if the query is already normalized.
Since the object is supposed to be generated by `SeuratPreparing`, it is already normalized.
However, a different normalization method may be used.
If the reference is normalized by the same method as the query, the normalization can be skipped.
Otherwise, the normalization cannot be skipped.
The normalization method used for the query set is determined by the default assay.
If `SCT`, then `SCTransform` is used; otherwise, `NormalizeData` is used.
You can set this to `False` to force re-normalization (with or without the arguments previously used).
SCTransform (ns): Arguments for [`SCTransform()`](https://satijalab.org/seurat/reference/sctransform)
- do-correct-umi (flag): Place corrected UMI matrix in assay counts layer?
- do-scale (flag): Whether to scale residuals to have unit variance?
- do-center (flag): Whether to center residuals to have mean zero?
- <more>: See <https://satijalab.org/seurat/reference/sctransform>.
Note that the hyphen (`-`) will be transformed into `.` for the keys.
NormalizeData (ns): Arguments for [`NormalizeData()`](https://satijalab.org/seurat/reference/normalizedata)
- normalization-method: Normalization method.
- <more>: See <https://satijalab.org/seurat/reference/normalizedata>.
Note that the hyphen (`-`) will be transformed into `.` for the keys.
FindTransferAnchors (ns): Arguments for [`FindTransferAnchors()`](https://satijalab.org/seurat/reference/findtransferanchors)
- normalization-method (choice): Name of normalization method used.
- LogNormalize: Log-normalize the data matrix
- SCT: Scale data using the SCTransform method
- auto: Automatically detect the normalization method.
See `envs.refnorm`.
- reference-reduction: Name of dimensional reduction to use from the reference if running the pcaproject workflow.
Optionally enables reuse of precomputed reference dimensional reduction.
- <more>: See <https://satijalab.org/seurat/reference/findtransferanchors>.
Note that the hyphen (`-`) will be transformed into `.` for the keys.
MapQuery (ns): Arguments for [`MapQuery()`](https://satijalab.org/seurat/reference/mapquery)
- reference-reduction: Name of reduction to use from the reference for neighbor finding
- reduction-model: `DimReduc` object that contains the umap model.
- refdata (type=json): Extra data to transfer from the reference to the query.
- <more>: See <https://satijalab.org/seurat/reference/mapquery>.
Note that the hyphen (`-`) will be transformed into `.` for the keys.
cache (type=auto): Whether to cache the information at different steps.
If `True`, the seurat object will be cached in the job output directory, which will be not cleaned up when job is rerunning.
The cached seurat object will be saved as `<signature>.<kind>.RDS` file, where `<signature>` is the signature determined by
the input and envs of the process.
See <https://github.com/satijalab/seurat/issues/7849>, <https://github.com/satijalab/seurat/issues/5358> and
<https://github.com/satijalab/seurat/issues/6748> for more details also about reproducibility issues.
To not use the cached seurat object, you can either set `cache` to `False` or delete the cached file at
`<signature>.RDS` in the cache directory.
plots (type=json): The plots to generate.
The keys are the names of the plots and the values are the arguments for the plot.
The arguments will be passed to `biopipen.utils::VizSeuratMap2Ref()` to generate the plots.
The plots will be saved to the output directory.
See <https://pwwang.github.io/biopipen.utils.R/reference/VizSeuratMap2Ref.html>.
Requires:
r-seurat:
- check: {{proc.lang}} -e "library(Seurat)"
""" # noqa: E501
input = "sobjfile:file"
output = "outfile:file:{{in.sobjfile | stem}}.qs"
lang = config.lang.rscript
envs_depth = 3
envs = {
"ncores": config.misc.ncores,
"use": None,
"ident": "seurat_clusters",
"mutaters": {},
"ref": None,
"refnorm": "auto",
"split_by": None,
"skip_if_normalized": True,
"SCTransform": {
"do-correct-umi": False,
"do-scale": False,
"do-center": True,
},
"NormalizeData": {
"normalization-method": "LogNormalize",
},
"FindTransferAnchors": {
# "reference-reduction": "spca",
},
"MapQuery": {
# "reference-reduction": "spca",
# "reduction-model": "wnn.umap",
"refdata": {
# "celltype-l1": "celltype.l1",
# "celltype-l2": "celltype.l2",
# "predicted_ADT": "ADT",
},
},
"cache": config.path.tmpdir,
"plots": {
"Mapped Identity": {
"features": "{ident}:{use}",
},
"Mapping Score": {
"features": "{ident}.score",
},
},
}
script = "file://../scripts/scrna/SeuratMap2Ref.R"
plugin_opts = {"report": "file://../reports/common.svelte"}
class RadarPlots(Proc):DOCS
"""Radar plots for cell proportion in different clusters.
This process generates the radar plots for the clusters of T cells.
It explores the proportion of cells in different groups (e.g. Tumor vs Blood)
in different T-cell clusters.
Examples:
Let's say we have a metadata like this:
| Cell | Source | Timepoint | seurat_clusters |
| ---- | ------ | --------- | --------------- |
| A | Blood | Pre | 0 |
| B | Blood | Pre | 0 |
| C | Blood | Post | 1 |
| D | Blood | Post | 1 |
| E | Tumor | Pre | 2 |
| F | Tumor | Pre | 2 |
| G | Tumor | Post | 3 |
| H | Tumor | Post | 3 |
With configurations:
```toml
[RadarPlots.envs]
by = "Source"
```
Then we will have a radar plots like this:
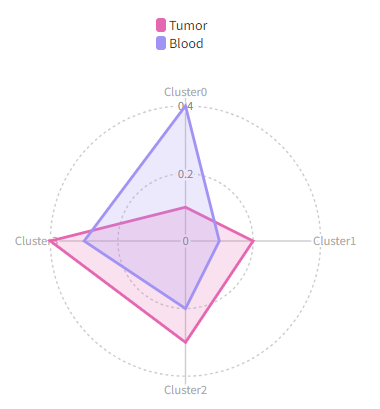
We can use `each` to separate the cells into different cases:
```toml
[RadarPlots.envs]
by = "Source"
each = "Timepoint"
```
Then we will have two radar plots, one for `Pre` and one for `Post`:
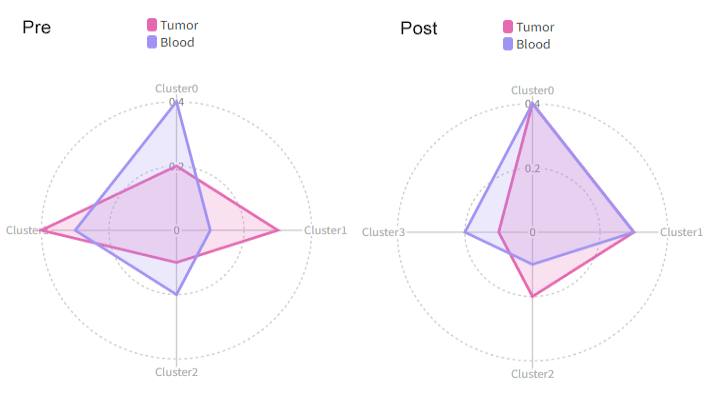
Using `cluster_order` to change the order of the clusters and show only the first 3 clusters:
```toml
[RadarPlots.envs]
by = "Source"
cluster_order = ["2", "0", "1"]
breaks = [0, 50, 100] # also change the breaks
```
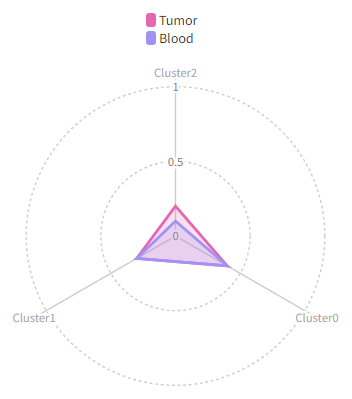
/// Attention
All the plots used in the examples are just for demonstration purpose. The real plots will have different appearance.
///
Input:
srtobj: The seurat object in RDS or qs/qs2 format
Output:
outdir: The output directory for the plots
Envs:
mutaters (type=json): Mutaters to mutate the metadata of the
seurat object. Keys are the column names and values are the
expressions to mutate the columns. These new columns will be
used to define your cases.
by: Which column to use to separate the cells in different groups.
`NA`s will be ignored. For example, If you have a column named `Source`
that marks the source of the cells, and you want to separate the cells
into `Tumor` and `Blood` groups, you can set `by` to `Source`.
The there will be two curves in the radar plot, one for `Tumor` and
one for `Blood`.
each: A column with values to separate all cells in different cases
When specified, the case will be expanded to multiple cases for
each value in the column.
If specified, `section` will be ignored, and the case name will
be used as the section name.
prefix_each (flag): Whether to prefix the `each` column name to the values as the
case/section name.
breakdown: An additional column with groups to break down the cells
distribution in each cluster. For example, if you want to see the
distribution of the cells in each cluster in different samples. In
this case, you should have multiple values in each `by`. These values
won't be plotted in the radar plot, but a barplot will be generated
with the mean value of each group and the error bar.
test (choice): The test to use to calculate the p values.
If there are more than 2 groups in `by`, the p values will be calculated
pairwise group by group. Only works when `breakdown` is specified and
`by` has 2 groups or more.
- wilcox: Wilcoxon rank sum test
- t: T test
- none: No test will be performed
order (list): The order of the values in `by`. You can also limit
(filter) the values we have in `by`. For example, if column `Source`
has values `Tumor`, `Blood`, `Spleen`, and you only want to plot
`Tumor` and `Blood`, you can set `order` to `["Tumor", "Blood"]`.
This will also have `Tumor` as the first item in the legend and `Blood`
as the second item.
colors: The colors for the groups in `by`. If not specified,
the default colors will be used.
Multiple colors can be separated by comma (`,`).
You can specify `biopipen` to use the `biopipen` palette.
ident: The column name of the cluster information.
cluster_order (list): The order of the clusters.
You may also use it to filter the clusters. If not given,
all clusters will be used.
If the cluster names are integers, use them directly for the order,
even though a prefix `Cluster` is added on the plot.
breaks (list;itype=int): breaks of the radar plots, from 0 to 100.
If not given, the breaks will be calculated automatically.
direction (choice): Direction to calculate the percentages.
- inter-cluster: the percentage of the cells in all groups
in each cluster (percentage adds up to 1 for each cluster).
- intra-cluster: the percentage of the cells in all clusters.
(percentage adds up to 1 for each group).
section: If you want to put multiple cases into a same section
in the report, you can set this option to the name of the section.
Only used in the report.
subset: The subset of the cells to do the analysis.
bar_devpars (ns): The parameters for `png()` for the barplot
- res (type=int): The resolution of the plot
- height (type=int): The height of the plot
- width (type=int): The width of the plot
devpars (ns): The parameters for `png()`
- res (type=int): The resolution of the plot
- height (type=int): The height of the plot
- width (type=int): The width of the plot
cases (type=json): The cases for the multiple radar plots.
Keys are the names of the cases and values are the arguments for
the plots (`each`, `by`, `order`, `breaks`, `direction`,
`ident`, `cluster_order` and `devpars`).
If not cases are given, a default case will be used, with the
key `DEFAULT`.
The keys must be valid string as part of the file name.
""" # noqa: E501
input = "srtobj:file"
output = "outdir:dir:{{in.srtobj | stem}}.radar_plots"
lang = config.lang.rscript
script = "file://../scripts/scrna/RadarPlots.R"
envs = {
"mutaters": {},
"by": None,
"each": None,
"prefix_each": True,
"order": None,
"colors": "biopipen",
"ident": "seurat_clusters",
"cluster_order": [],
"breakdown": None,
"test": "wilcox",
"breaks": [],
"direction": "intra-cluster",
"section": "DEFAULT",
"subset": None,
"bar_devpars": {
"res": 100,
"width": 1200,
"height": 800,
},
"devpars": {
"res": 100,
"width": 1200,
"height": 1000,
},
"cases": {},
}
plugin_opts = {
"report": "file://../reports/scrna/RadarPlots.svelte",
}
@mark(deprecated=True)DOCS
class MetaMarkers(Proc):
"""Find markers between three or more groups of cells, using one-way ANOVA
or Kruskal-Wallis test.
Sometimes, you may want to find the markers for cells from more than 2 groups.
In this case, you can use this process to find the markers for the groups and
do enrichment analysis for the markers. Each marker is examined using either
one-way ANOVA or Kruskal-Wallis test.
The p values are adjusted using the specified method. The significant markers
are then used for enrichment analysis using
[enrichr](https://maayanlab.cloud/Enrichr/) api.
Other than the markers and the enrichment analysis as outputs, this process also
generates violin plots for the top 10 markers.
Input:
srtobj: The seurat object loaded by `SeuratPreparing`
Output:
outdir: The output directory for the markers
Envs:
ncores (type=int): Number of cores to use to parallelize for genes
mutaters (type=json): The mutaters to mutate the metadata
The key-value pairs will be passed the `dplyr::mutate()` to mutate the metadata.
group-by: The column name in metadata to group the cells.
If only `group-by` is specified, and `idents` are
not specified, markers will be found for all groups in this column.
`NA` group will be ignored.
idents: The groups of cells to compare, values should be in the `group-by` column.
each: The column name in metadata to separate the cells into different cases.
prefix_each (flag): Whether to add the `each` value as prefix to the case name.
dbs (list): The dbs to do enrichment analysis for significant markers.
You can use built-in dbs in `enrichit`, or provide your own gmt files.
See also <https://pwwang.github.io/enrichit/reference/FetchGMT.html>.
The built-in dbs include:
* "BioCarta" or "BioCarta_2016"
* "GO_Biological_Process" or "GO_Biological_Process_2025"
* "GO_Cellular_Component" or "GO_Cellular_Component_2025"
* "GO_Molecular_Function" or "GO_Molecular_Function_2025"
* "KEGG", "KEGG_Human", "KEGG_2021", or "KEGG_2021_Human"
* "Hallmark", "MSigDB_Hallmark", or "MSigDB_Hallmark_2020"
* "Reactome", "Reactome_Pathways", or "Reactome_Pathways_2024"
* "WikiPathways", "WikiPathways_2024", "WikiPathways_Human", or "WikiPathways_2024_Human"
You can also fetch more dbs from <https://maayanlab.cloud/Enrichr/#libraries>.
subset: The subset of the cells to do the analysis.
An expression passed to `dplyr::filter()`.
p_adjust (choice): The method to adjust the p values, which can be used to filter the significant markers.
See also <https://rdrr.io/r/stats/p.adjust.html>
- holm: Holm-Bonferroni method
- hochberg: Hochberg method
- hommel: Hommel method
- bonferroni: Bonferroni method
- BH: Benjamini-Hochberg method
- BY: Benjamini-Yekutieli method
- fdr: FDR method of Benjamini-Hochberg
- none: No adjustment
sigmarkers: An expression passed to `dplyr::filter()` to filter the
significant markers for enrichment analysis. The default is `p.value < 0.05`.
If `method = 'anova'`, the variables that can be used for filtering are:
`sumsq`, `meansq`, `statistic`, `p.value` and `p_adjust`.
If `method = 'kruskal'`, the variables that can be used for filtering are:
`statistic`, `p.value` and `p_adjust`.
section: The section name for the report.
Worked only when `each` is not specified.
Otherwise, the section name will be constructed from `each` and `group-by`.
If `DEFAULT`, and it's the only section, it not included in the case/section names.
method (choice): The method for the test.
- anova: One-way ANOVA
- kruskal: Kruskal-Wallis test
cases (type=json): If you have multiple cases, you can specify them
here. The keys are the names of the cases and the values are the
above options except `ncores` and `mutaters`. If some options are
not specified, the default values specified above will be used.
If no cases are specified, the default case will be added with
the default values under `envs` with the name `DEFAULT`.
""" # noqa: E501
input = "srtobj:file"
output = "outdir:dir:{{in.srtobj | stem}}.meta_markers"
lang = config.lang.rscript
script = "file://../scripts/scrna/MetaMarkers.R"
envs = {
"ncores": config.misc.ncores,
"mutaters": {},
"group-by": None,
"idents": None,
"each": None,
"subset": None,
"prefix_each": True,
"p_adjust": "BH",
"dbs": ["KEGG_2021_Human", "MSigDB_Hallmark_2020"],
"sigmarkers": "p_adjust < 0.05",
"section": "DEFAULT",
"method": "anova",
"cases": {},
}
plugin_opts = {
"report": "file://../reports/scrna/MetaMarkers.svelte",
"report_paging": 8,
}
class Seurat2AnnData(Proc):DOCS
"""Convert seurat object to AnnData
Input:
sobjfile: The seurat object file, in RDS or qs/qs2 format
Output:
outfile: The AnnData file
Envs:
assay: The assay to use for AnnData.
If not specified, the default assay will be used.
"""
input = "sobjfile:file"
output = "outfile:file:{{in.sobjfile | stem}}.h5ad"
lang = config.lang.rscript
script = "file://../scripts/scrna/Seurat2AnnData.R"
envs = {"assay": None}
class AnnData2Seurat(Proc):DOCS
"""Convert AnnData to seurat object
Input:
adfile: The AnnData .h5ad file
Output:
outfile: The seurat object file in RDS or qs/qs2 format
Envs:
assay: The assay to use to convert to seurat object.
ident: The column name in `adfile.obs` to use as the identity
for the seurat object.
If not specified, no identity will be set.
dotplot_check (type=auto): Whether to do a check with a dot plot.
(`scplotter::FeatureStatPlot(plot_type = "dot", ..)` will be used)
to see if the conversion is successful.
Set to `False` to disable the check.
If `True`, top 10 variable genes will be used for the check.
You can give a list of genes or a string of genes with comma (`,`) separated
to use for the check.
"""
input = "adfile:file"
output = "outfile:file:{{in.adfile | stem}}.qs"
lang = config.lang.rscript
envs = {"assay": "RNA", "ident": None, "dotplot_check": True}
script = "file://../scripts/scrna/AnnData2Seurat.R"
class ScSimulation(Proc):DOCS
"""Simulate single-cell data using splatter.
See <https://www.bioconductor.org/packages/devel/bioc/vignettes/splatter/inst/doc/splatter.html#2_Quickstart>
Input:
seed: The seed for the simulation
You could also use string as the seed, and the seed will be
generated by `digest::digest2int()`.
So this could also work as a unique identifier for the simulation (ie. Sample ID).
Output:
outfile: The output Seurat object/SingleCellExperiment in qs/qs2 format
Envs:
ngenes (type=int): The number of genes to simulate
ncells (type=int): The number of cells to simulate
nspikes (type=int): The number of spike-ins to simulate
When `ngenes`, `ncells`, and `nspikes` are not specified, the default
params from `mockSCE()` will be used. By default, `ngenes = 2000`,
`ncells = 200`, and `nspikes = 100`.
outtype (choice): The output file type.
- seurat: Seurat object
- singlecellexperiment: SingleCellExperiment object
- sce: alias for `singlecellexperiment`
method (choice): which simulation method to use. Options are:
- single: produces a single population
- groups: produces distinct groups (eg. cell types), or
- paths: selects cells from continuous trajectories (eg. differentiation processes)
params (ns): Other parameters for simulation.
The parameters are initialized `splitEstimate(mockSCE())` and then
updated with the given parameters.
See <https://rdrr.io/bioc/splatter/man/SplatParams.html>.
Hyphens (`-`) will be transformed into dots (`.`) for the keys.
""" # noqa: E501
input = "seed:var"
output = "outfile:file:simulatied_{{in.seed}}.RDS"
lang = config.lang.rscript
envs = {
"ngenes": None,
"ncells": None,
"nspikes": None,
"outtype": "seurat",
"method": "single",
"params": {},
}
script = "file://../scripts/scrna/ScSimulation.R"
class CellCellCommunication(Proc):DOCS
"""Cell-cell communication inference
This is implemented based on [LIANA](https://liana-py.readthedocs.io/en/latest/index.html),
which is a Python package for cell-cell communication inference and provides a list of existing
methods including [CellPhoneDB](https://github.com/ventolab/CellphoneDB),
[Connectome](https://github.com/msraredon/Connectome/), log2FC,
[NATMI](https://github.com/forrest-lab/NATMI),
[SingleCellSignalR](https://github.com/SCA-IRCM/SingleCellSignalR), Rank_Aggregate, Geometric Mean,
[scSeqComm](https://gitlab.com/sysbiobig/scseqcomm), and [CellChat](https://github.com/jinworks/CellChat).
You can also try `python -c 'import liana; liana.mt.show_methods()'` to see the methods available.
Note that this process does not do any visualization. You can use `CellCellCommunicationPlots`
to visualize the results.
Reference:
- [Review](https://www.ncbi.nlm.nih.gov/pmc/articles/PMC9184522/).
- [LIANA](https://www.biorxiv.org/content/10.1101/2023.08.19.553863v1).
Input:
sobjfile: The seurat object file in RDS or h5seurat format or AnnData file.
Output:
outfile: The output file with the 'liana_res' data frame.
Stats are provided for both ligand and receptor entities, more specifically: ligand and receptor are
the two entities that potentially interact. As a reminder, CCC events are not limited to secreted signalling,
but we refer to them as ligand and receptor for simplicity.
Also, in the case of heteromeric complexes, the ligand and receptor columns represent the subunit with minimum
expression, while *_complex corresponds to the actual complex, with subunits being separated by _.
source and target columns represent the source/sender and target/receiver cell identity for each interaction, respectively
* `*_props`: represents the proportion of cells that express the entity.
By default, any interactions in which either entity is not expressed in above 10%% of cells per cell type
is considered as a false positive, under the assumption that since CCC occurs between cell types, a sufficient
proportion of cells within should express the genes.
* `*_means`: entity expression mean per cell type.
* `lr_means`: mean ligand-receptor expression, as a measure of ligand-receptor interaction magnitude.
* `cellphone_pvals`: permutation-based p-values, as a measure of interaction specificity.
A typical output will look like this:
| ligand | ligand_complex | ligand_props | ligand_trimean | mat_max | receptor | receptor_complex | receptor_props | receptor_trimean | source | target | lr_probs | cellchat_pvals | mag_score | spec_score |
|--------|---------------|--------------|----------------|---------|----------|------------------|----------------|------------------|--------|--------|----------|----------------|-----------|------------|
| VIM | VIM | 1.00 | 0.36 | 8.73 | CD44 | CD44 | 0.77 | 0.16 | c7 | c3 | 0.10 | 0.00 | 0.10 | 0.00 |
| MIF | MIF | 0.97 | 0.22 | 8.73 | CXCR4 | CD74_CXCR4 | 0.87 | 0.26 | c5 | c6 | 0.10 | 0.00 | 0.10 | 0.00 |
| HLA-B | HLA-B | 1.00 | 0.44 | 8.73 | KLRD1 | KLRD1 | 0.73 | 0.13 | c9 | c2 | 0.10 | 0.00 | 0.10 | 0.00 |
| HMGB1 | HMGB1 | 0.99 | 0.26 | 8.73 | CXCR4 | CXCR4 | 0.81 | 0.21 | c2 | c7 | 0.10 | 0.00 | 0.10 | 0.00 |
| CD48 | CD48 | 0.94 | 0.20 | 8.73 | CD2 | CD2 | 0.99 | 0.28 | c7 | c8 | 0.10 | 0.00 | 0.10 | 0.00 |
| HLA-C | HLA-C | 1.00 | 0.38 | 8.73 | CD8B | CD8B | 0.73 | 0.15 | c1 | c9 | 0.10 | 0.00 | 0.10 | 0.00 |
| LGALS1 | LGALS1 | 0.95 | 0.17 | 8.73 | CD69 | CD69 | 0.99 | 0.34 | c10 | c5 | 0.10 | 0.00 | 0.10 | 0.00 |
Envs:
method (choice): The method to use for cell-cell communication inference.
- CellPhoneDB: Use CellPhoneDB method.
Magnitude Score: lr_means; Specificity Score: cellphone_pvals.
- Connectome: Use Connectome method.
- log2FC: Use log2FC method.
- NATMI: Use NATMI method.
- SingleCellSignalR: Use SingleCellSignalR method.
- Rank_Aggregate: Use Rank_Aggregate method.
- Geometric_Mean: Use Geometric Mean method.
- scSeqComm: Use scSeqComm method.
- CellChat: Use CellChat method.
- cellphonedb: alias for `CellPhoneDB`
- connectome: alias for `Connectome`
- log2fc: alias for `log2FC`
- natmi: alias for `NATMI`
- singlesignaler: alias for `SingleCellSignalR`
- rank_aggregate: alias for `Rank_Aggregate`
- geometric_mean: alias for `Geometric_Mean`
- scseqcomm: alias for `scSeqComm`
- cellchat: alias for `CellChat`
subset: An expression in string to subset the cells.
When a `.rds` or `.h5seurat` file is provided for `in.sobjfile`, you can provide an expression in `R`,
which will be passed to `base::subset()` in `R` to subset the cells.
But you can always pass an expression in `python` to subset the cells.
See <https://anndata.readthedocs.io/en/latest/tutorials/notebooks/getting-started.html#subsetting-using-metadata>.
You should use `adata` to refer to the AnnData object. For example, `adata.obs.groups == "g1"` will subset the cells
with `groups` equal to `g1`.
subset_using: The method to subset the cells.
- auto: Automatically detect the method to use.
Note that this is not always accurate. We simply check if `[` is in the expression.
If so, we use `python` to subset the cells; otherwise, we use `R`.
- python: Use python to subset the cells.
- r: Use R to subset the cells.
split_by: The column name in metadata to split the cells to run the method separately.
The results will be combined together with this column in the final output.
assay: The assay to use for the analysis.
Only works for Seurat object.
seed (type=int): The seed for the random number generator.
ncores (type=int): The number of cores to use.
groupby: The column name in metadata to group the cells.
Typically, this column should be the cluster id.
If provided input is a Seurat object, the default identity will be used by default.
Otherwise, it is recommended to provide this parameter.
"seurat_clusters" will be used with a warning if the input is in AnnData format and
this parameter is not provided.
group_by: alias for `groupby`
species (choice): The species of the cells.
- human: Human cells, the 'consensus' resource will be used.
- mouse: Mouse cells, the 'mouseconsensus' resource will be used.
expr_prop (type=float): Minimum expression proportion for the ligands and
receptors (+ their subunits) in the corresponding cell identities. Set to 0
to return unfiltered results.
min_cells (type=int): Minimum cells (per cell identity if grouped by `groupby`)
to be considered for downstream analysis.
n_perms (type=int): Number of permutations for the permutation test.
Relevant only for permutation-based methods (e.g., `CellPhoneDB`).
If `0` is passed, no permutation testing is performed.
rscript: The path to the Rscript executable used to convert RDS file to AnnData.
if `in.sobjfile` is an RDS file, it will be converted to AnnData file (h5ad).
You need `Seurat`, `SeuratDisk` and `digest` installed.
<more>: Other arguments for the method.
The arguments are passed to the method directly.
See the method documentation for more details and also
`help(liana.mt.<method>.__call__)` in Python.
""" # noqa: E501
input = "sobjfile:file"
output = "outfile:file:{{in.sobjfile | stem}}-ccc.txt"
lang = config.lang.python
envs = {
"method": "cellchat",
"assay": None,
"seed": 1337,
"subset": None,
"subset_using": "auto",
"split_by": None,
"ncores": config.misc.ncores,
"groupby": None,
"group_by": None,
"species": "human",
"expr_prop": 0.1,
"min_cells": 5,
"n_perms": 1000,
"rscript": config.lang.rscript,
}
script = "file://../scripts/scrna/CellCellCommunication.py"
class CellCellCommunicationPlots(Proc):DOCS
"""Visualization for cell-cell communication inference.
Examples:
### Network Plot
```toml
[CellCellCommunicationPlots.envs.cases."Cell-Cell Communication Network"]
plot_type = "network"
legend-position = "none"
theme = "theme_blank"
theme_args = {add_coord = false}
```
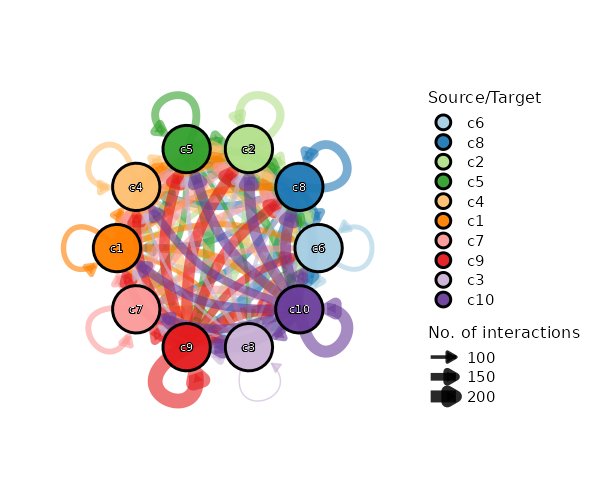{: width="80%"}
### Circos Plot
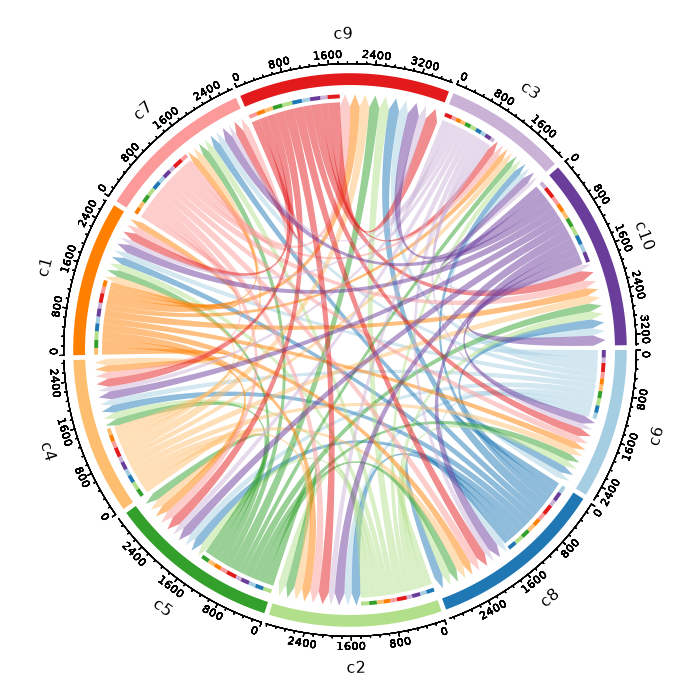{: width="80%"}
### Heatmap Plot
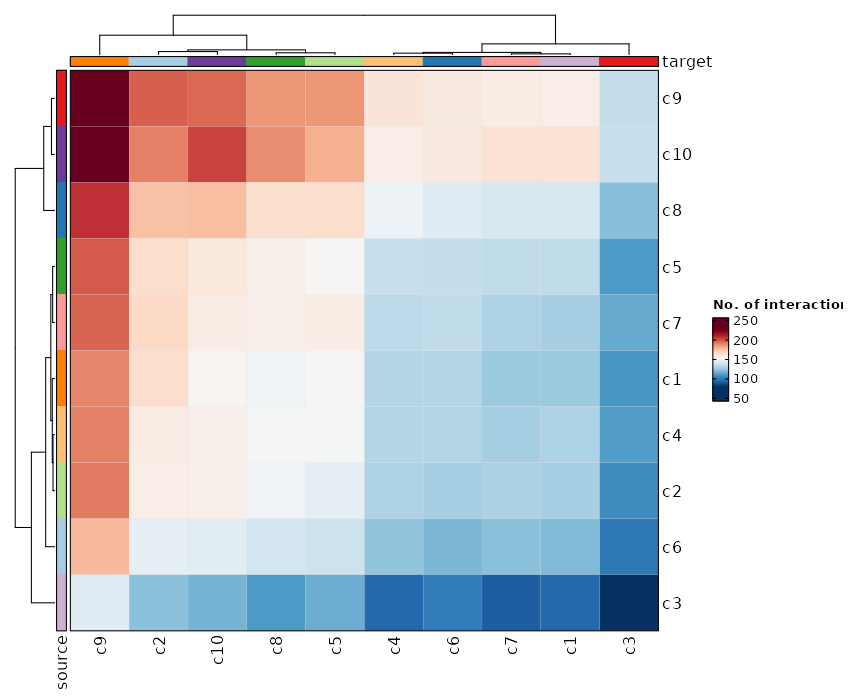{: width="80%"}
### Cell-Cell Communication Interaction (Box Plot)
```toml
[CellCellCommunicationPlots.envs.cases."Cell-Cell Communication Interaction (Box Plot)"]
plot_type = "box"
x_text_angle = 90
method = "interaction"
```
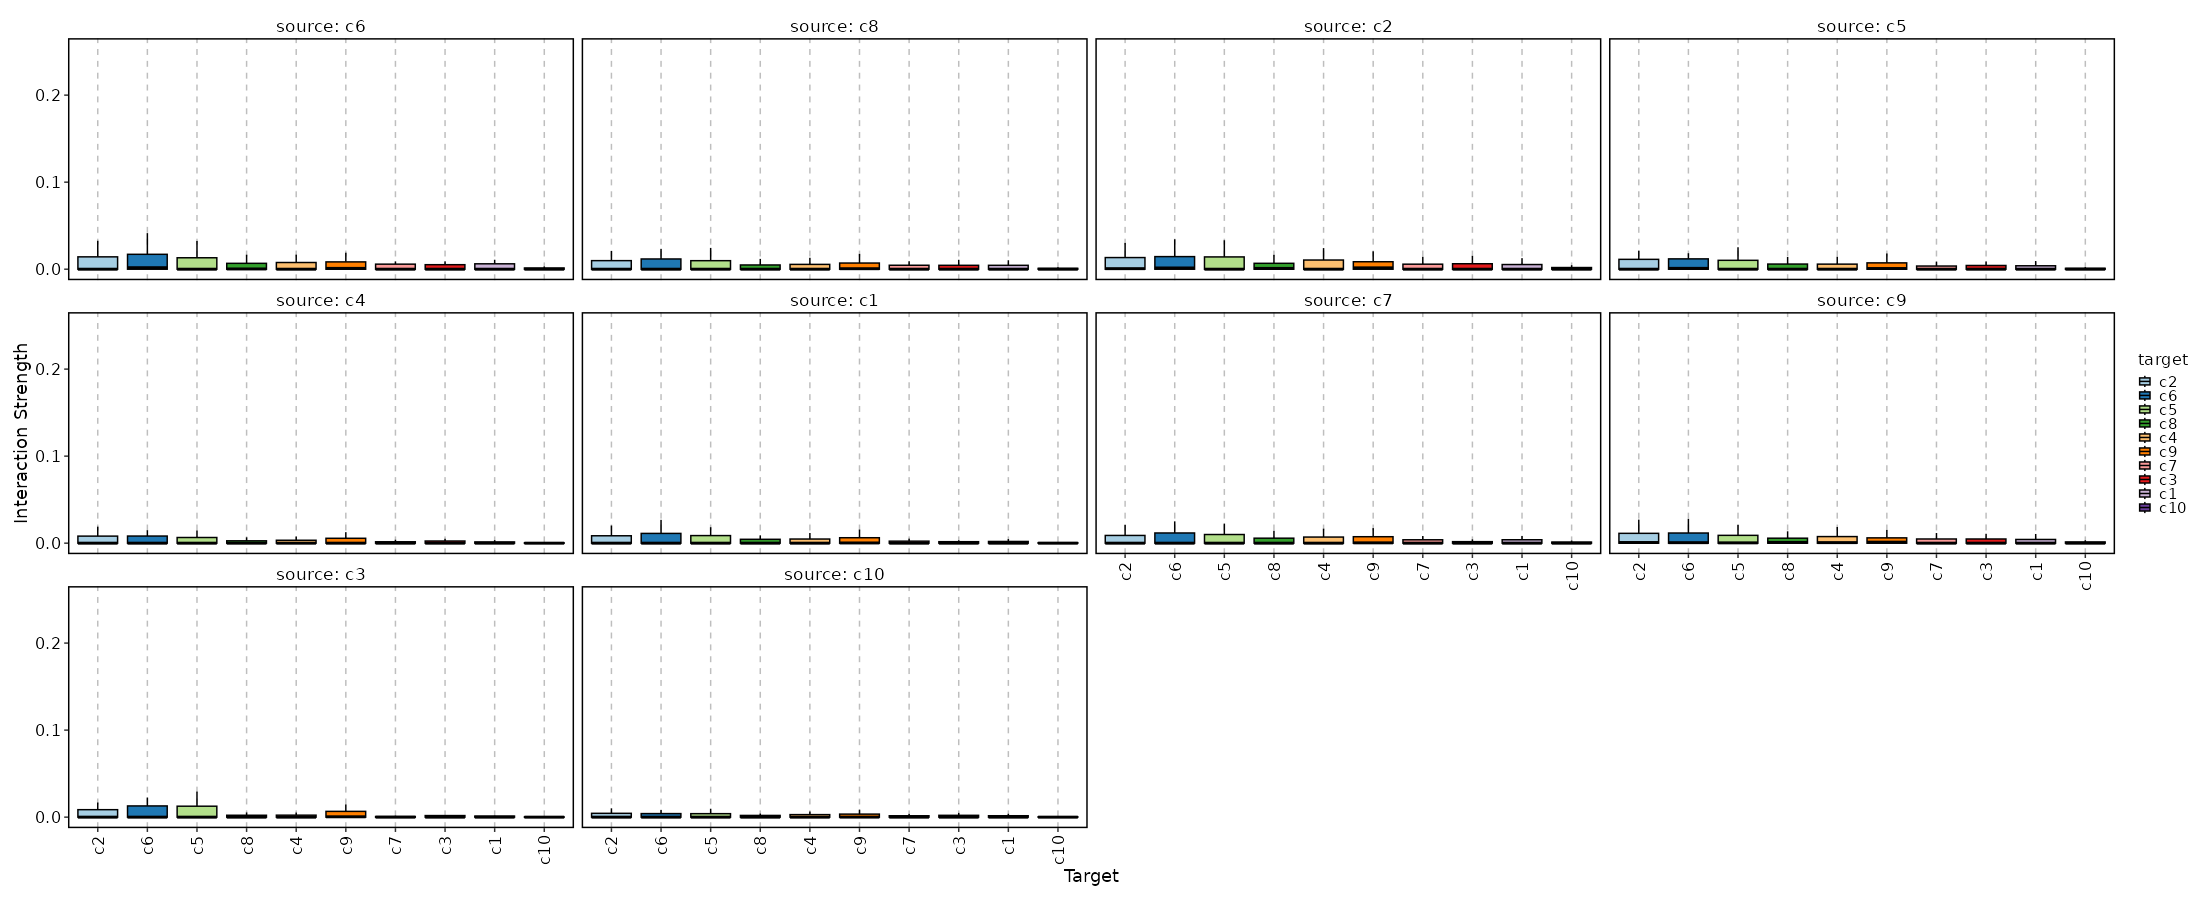{: width="80%"}
Input:
cccfile: The output file from `CellCellCommunication`
Output:
outdir: The output directory for the plots.
Envs:
subset: An expression to pass to `dplyr::filter()` to subset the ccc data.
magnitude: The column name in the data to use as the magnitude of the
communication. By default, the second last column will be used.
See `li.mt.show_methods()` for the available methods in LIANA. or
<https://liana-py.readthedocs.io/en/latest/notebooks/basic_usage.html#Tileplot>
specificity: The column name in the data to use as the specificity of the communication.
By default, the last column will be used. If the method doesn't have a specificity, set it to None.
devpars (ns): The parameters for the plot.
- res (type=int): The resolution of the plot
- height (type=int): The height of the plot
- width (type=int): The width of the plot
more_formats (type=list): The additional formats to save the plots.
descr: The description of the plot.
cases (type=json): The cases for the plots.
The keys are the names of the cases and the values are the arguments for
the plots. The arguments include the ones inherited from `envs`.
You can have a special `plot_type` `"table"` to generate a table for the
ccc data to save as a text file and show in the report.
If no cases are given, a default case will be used, with the
key `Cell-Cell Communication`.
<more>: Other arguments passed to
[scplotter::CCCPlot](https://pwwang.github.io/scplotter/reference/CCCPlot.html)
""" # noqa: E501
input = "cccfile:file"
output = "outdir:dir:{{in.cccfile | stem}}_plots"
lang = config.lang.rscript
envs = {
"subset": None,
"magnitude": None,
"specificity": None,
"devpars": {"res": 100},
"more_formats": [],
"descr": "Cell-cell communication plot",
"cases": {},
}
script = "file://../scripts/scrna/CellCellCommunicationPlots.R"
plugin_opts = {
"report": "file://../reports/common.svelte",
}
class ScVelo(Proc):DOCS
"""Velocity analysis for single-cell RNA-seq data
This process is implemented based on the Python package `scvelo` (v0.3.3).
Note that it doesn't work with `numpy>=2`.
Input:
sobjfile: The seurat object file in RDS or h5seurat format or AnnData file.
Output:
outfile: The output object with the velocity embeddings and information.
In either RDS, h5seurat or h5ad format, depending on the `envs.outtype`.
There will be also plots generated in the output directory
(parent directory of `outfile`).
Note that these plots will not be used in the report, but can be used as
supplementary information for the velocity analysis.
To visualize the velocity embeddings, you can use the `SeuratClusterStats`
process with `v_reduction` provided to one of the `envs.dimplots`.
Envs:
ncores (type=int): Number of cores to use.
group_by: The column name in metadata to group the cells.
Typically, this column should be the cluster id.
If provided input is a Seurat object, the default identity will be used by
default. Otherwise, it is recommended to provide this parameter.
"seurat_clusters" will be used with a warning if the input is in AnnData
format and this parameter is not provided.
mode (type=list): The mode to use for the velocity analysis.
It should be a subset of `['deterministic', 'stochastic', 'dynamical']`,
meaning that we can perform the velocity analysis in multiple modes.
fitting_by (choice): The mode to use for fitting the velocities.
- stochastic: Stochastic mode
- deterministic: Deterministic mode
min_shared_counts (type=int): Minimum number of counts
(both unspliced and spliced) required for a gene.
n_neighbors (type=int): The number of neighbors to use for the velocity graph.
n_pcs (type=int): The number of PCs to use for the velocity graph.
denoise (flag): Whether to denoise the data.
denoise_topn (type=int): Number of genes with highest likelihood selected to
infer velocity directions.
kinetics (flag): Whether to compute the RNA velocity kinetics.
kinetics_topn (type=int): Number of genes with highest likelihood selected to
infer velocity directions.
calculate_velocity_genes (flag): Whether to calculate the velocity genes.
top_n (type=int): The number of top features to plot.
rscript: The path to the Rscript executable used to convert RDS file to AnnData.
if `in.sobjfile` is an RDS file, it will be converted to AnnData file
(h5ad). You need `Seurat`, `SeuratDisk` and `digest` installed.
outtype (choice): The output file type.
- <input>: The same as the input file type.
- h5seurat: h5seurat file
- h5ad: h5ad file
- qs: qs/qs2 file
- qs2: qs2 file
- rds: RDS file
"""
input = "sobjfile:file"
output = (
"outfile:file:{{in.sobjfile | stem}}-scvelo."
"{{ext0(in.sobjfile) if envs.outtype == '<input>' else envs.outtype}}"
)
lang = config.lang.python
envs = {
"ncores": config.misc.ncores,
"group_by": None,
"mode": ["deterministic", "stochastic", "dynamical"],
"fitting_by": "stochastic",
"min_shared_counts": 30,
"n_neighbors": 30,
"n_pcs": 30,
"denoise": False,
"denoise_topn": 3,
"kinetics": False,
"kinetics_topn": 100,
"calculate_velocity_genes": False,
"top_n": 6,
"rscript": config.lang.rscript,
"outtype": "<input>",
}
script = "file://../scripts/scrna/ScVelo.py"
class Slingshot(Proc):DOCS
"""Trajectory inference using Slingshot
This process is implemented based on the R package `slingshot`.
Input:
sobjfile: The seurat object file in RDS or qs format.
Output:
outfile: The output object with the trajectory information.
The lineages are stored in the metadata of the seurat object at
columns `LineageX`, where X is the lineage number. The `BranchID`
column contains the branch id for each cell.
One can use
`scplotter::CellDimPlot(object, lineages = c("Lineage1", "Lineage2", ...))`
to visualize the trajectories.
Envs:
group_by: The column name in metadata to group the cells.
Typically, this column should be the cluster id.
Default is the default identity of the seurat object.
reduction: The nonlinear reduction to use for the trajectory analysis.
dims (type=auto): The dimensions to use for the analysis.
A list or a string with comma separated values.
Consecutive numbers can be specified with a colon (`:`) or a dash (`-`).
start: The starting group for the Slingshot analysis.
end: The ending group for the Slingshot analysis.
prefix: The prefix to add to the column names of the resulting pseudotime variable.
reverse (flag): Logical value indicating whether to reverse the pseudotime variable.
align_start (flag): Whether to align the starting pseudotime values at the maximum pseudotime.
seed (type=int): The seed for the random number generator.
""" # noqa: E501
input = "sobjfile:file"
output = "outfile:file:{{in.sobjfile | stem}}.qs"
lang = config.lang.rscript
envs = {
"group_by": None,
"reduction": None,
"dims": [1, 2],
"start": None,
"end": None,
"prefix": None,
"reverse": False,
"align_start": False,
"seed": 8525,
}
script = "file://../scripts/scrna/Slingshot.R"
class LoomTo10X(Proc):DOCS
"""Convert Loom file to 10X format
Input:
loomfile: The Loom file
Output:
outdir: The output directory for the 10X format files,
including the `matrix.mtx.gz`, `barcodes.tsv.gz` and `features.tsv.gz`
files.
"""
input = "loomfile:file"
output = "outdir:dir:{{in.loomfile | stem}}.10X"
lang = config.lang.rscript
script = "file://../scripts/scrna/LoomTo10X.R"
class PseudoBulkDEG(Proc):DOCS
"""Pseduo-bulk differential gene expression analysis
This process performs differential gene expression analysis, instead of
on single-cell level, on the pseudo-bulk data, aggregated from the single-cell data.
Input:
sobjfile: The seurat object file in RDS or qs/qs2 format.
Output:
outdir: The output containing the results of the differential gene expression
analysis.
Envs:
ncores (type=int): Number of cores to use for parallelization.
mutaters (type=json): Mutaters to mutate the metadata of the
seurat object. Keys are the new column names and values are the
expressions to mutate the columns. These new columns can be
used to define your cases.
You can also use the clone selectors to select the TCR clones/clusters.
See <https://pwwang.github.io/scplotter/reference/clone_selectors.html>.
You can also use key `<newcol>:ident` to set the `<newcol>` as the default
ident for the stats.
See <https://pwwang.github.io/biopipen.utils.R/reference/MutateSeuratMeta.html>
each: The column name in metadata to separate the cells into different cases.
When specified, the case will be expanded to multiple cases for
each value in the column.
`"ident"` can be used as an alias for the default identity column (e.g. `"seurat_clusters"`).
cache (type=auto): Where to cache the results.
If `True`, cache to `outdir` of the job. If `False`, don't cache.
Otherwise, specify the directory to cache to.
subset: An expression in string to subset the cells.
aggregate_by: The column names in metadata to aggregate the cells.
layer: The layer to pull and aggregate the data.
assay: The assay to pull and aggregate the data.
error (flag): Stop the job if errors happen.
Helpful when no/not enough markers are found or no pathways are enriched.
If `False`, empty results will be returned.
group_by: The column name in metadata to group the cells.
ident_1: The first identity to compare.
ident_2: The second identity to compare.
If not specified, the rest of the identities will be compared with `ident_1`.
paired_by: The column name in metadata to mark the paired samples.
For example, subject. If specified, the paired test will be performed.
dbs (list): The databases to use for enrichment analysis.
You can use built-in dbs in `enrichit`, or provide your own gmt files.
See also <https://pwwang.github.io/enrichit/reference/FetchGMT.html>.
The built-in dbs include:
* "BioCarta" or "BioCarta_2016"
* "GO_Biological_Process" or "GO_Biological_Process_2025"
* "GO_Cellular_Component" or "GO_Cellular_Component_2025"
* "GO_Molecular_Function" or "GO_Molecular_Function_2025"
* "KEGG", "KEGG_Human", "KEGG_2021", or "KEGG_2021_Human"
* "Hallmark", "MSigDB_Hallmark", or "MSigDB_Hallmark_2020"
* "Reactome", "Reactome_Pathways", or "Reactome_Pathways_2024"
* "WikiPathways", "WikiPathways_2024", "WikiPathways_Human", or "WikiPathways_2024_Human"
You can also fetch more dbs from <https://maayanlab.cloud/Enrichr/#libraries>.
sigmarkers: An expression passed to `dplyr::filter()` to filter the
significant markers for enrichment analysis.
The default is `p_val_adj < 0.05`.
If `tool = 'DESeq2'`, the variables that can be used for filtering
are: `baseMean`, `log2FC`, `lfcSE`, `stat`, `p_val`, `p_val_adj`.
If `tool = 'edgeR'`, the variables that can be used for filtering
are: `logCPM`, `log2FC`, `LR`, `p_val`, `p_val_adj`.
enrich_style (choice): The style of the enrichment analysis.
- enrichr: Use `enrichr`-style for the enrichment analysis.
- clusterProfiler: Use `clusterProfiler`-style for the enrichment analysis.
allmarker_plots_defaults (ns): Default options for the plots for all markers when `ident_1` is not specified.
- plot_type: The type of the plot.
See <https://pwwang.github.io/scplotter/reference/FeatureStatPlot.html>.
Available types are `violin`, `box`, `bar`, `ridge`, `dim`, `heatmap` and `dot`.
- more_formats (type=list): The extra formats to save the plot in.
- save_code (flag): Whether to save the code to generate the plot.
- devpars (ns): The device parameters for the plots.
- res (type=int): The resolution of the plots.
- height (type=int): The height of the plots.
- width (type=int): The width of the plots.
- order_by: an expression to order the markers, passed by `dplyr::arrange()`.
- genes: The number of top genes to show or an expression passed to `dplyr::filter()` to filter the genes.
- <more>: Other arguments passed to [`scplotter::FeatureStatPlot()`](https://pwwang.github.io/scplotter/reference/FeatureStatPlot.html).
allmarker_plots (type=json): All marker plot cases.
The keys are the names of the cases and the values are the dicts inherited from `allmarker_plots_defaults`.
allenrich_plots_defaults (ns): Default options for the plots to generate for the enrichment analysis.
- plot_type: The type of the plot.
- devpars (ns): The device parameters for the plots.
- res (type=int): The resolution of the plots.
- height (type=int): The height of the plots.
- width (type=int): The width of the plots.
- db (type=str): The database(s) to apply for the plot. If not specified, all databases will be applied.
`dbs` can also be used as an alias for this parameter.
- <more>: See <https://pwwang.github.io/scplotter/reference/EnrichmentPlot.html>.
allenrich_plots (type=json): Cases of the plots to generate for the enrichment analysis.
The keys are the names of the cases and the values are the dicts inherited from `allenrich_plots_defaults`.
The cases under `envs.cases` can inherit this options.
marker_plots_defaults (ns): Default options for the plots to generate for the markers.
- plot_type: The type of the plot.
See <https://pwwang.github.io/scplotter/reference/FeatureStatPlot.html>.
Available types are `violin`, `box`, `bar`, `ridge`, `dim`, `heatmap` and `dot`.
There are two additional types available - `volcano_pct` and `volcano_log2fc`.
- more_formats (type=list): The extra formats to save the plot in.
- save_code (flag): Whether to save the code to generate the plot.
- devpars (ns): The device parameters for the plots.
- res (type=int): The resolution of the plots.
- height (type=int): The height of the plots.
- width (type=int): The width of the plots.
- order_by: an expression to order the markers, passed by `dplyr::arrange()`.
- genes: The number of top genes to show or an expression passed to `dplyr::filter()` to filter the genes.
- <more>: Other arguments passed to [`scplotter::FeatureStatPlot()`](https://pwwang.github.io/scplotter/reference/FeatureStatPlot.html).
If `plot_type` is `volcano_pct` or `volcano_log2fc`, they will be passed to
[`scplotter::VolcanoPlot()`](https://pwwang.github.io/plotthis/reference/VolcanoPlot.html).
marker_plots (type=json): Cases of the plots to generate for the markers.
Plot cases. The keys are the names of the cases and the values are the dicts inherited from `marker_plots_defaults`.
The cases under `envs.cases` can inherit this options.
enrich_plots_defaults (ns): Default options for the plots to generate for the enrichment analysis.
- plot_type: The type of the plot.
See <https://pwwang.github.io/scplotter/reference/EnrichmentPlot.html>.
Available types are `bar`, `dot`, `lollipop`, `network`, `enrichmap` and `wordcloud`.
- more_formats (type=list): The extra formats to save the plot in.
- save_code (flag): Whether to save the code to generate the plot.
- devpars (ns): The device parameters for the plots.
- res (type=int): The resolution of the plots.
- height (type=int): The height of the plots.
- width (type=int): The width of the plots.
- <more>: See <https://pwwang.github.io/scplotter/reference/EnrichmentPlot.htmll>.
enrich_plots (type=json): Cases of the plots to generate for the enrichment analysis.
The keys are the names of the cases and the values are the dicts inherited from `enrich_plots_defaults`.
The cases under `envs.cases` can inherit this options.
overlaps_defaults (ns): Default options for investigating the overlapping of significant markers between different cases or comparisons.
This means either `ident_1` should be empty, so that they can be expanded to multiple comparisons.
- sigmarkers: The expression to filter the significant markers for each case.
If not provided, `envs.sigmarkers` will be used.
- plot_type (choice): The type of the plot to generate for the overlaps.
- venn: Use `plotthis::VennDiagram()`.
- upset: Use `plotthis::UpsetPlot()`.
- more_formats (type=list): The extra formats to save the plot in.
- save_code (flag): Whether to save the code to generate the plot.
- devpars (ns): The device parameters for the plots.
- res (type=int): The resolution of the plots.
- height (type=int): The height of the plots.
- width (type=int): The width of the plots.
- <more>: More arguments pased to `plotthis::VennDiagram()`
(<https://pwwang.github.io/plotthis/reference/venndiagram1.html>)
or `plotthis::UpsetPlot()`
(<https://pwwang.github.io/plotthis/reference/upsetplot1.html>)
overlaps (type=json): Cases for investigating the overlapping of significant markers between different cases or comparisons.
The keys are the names of the cases and the values are the dicts inherited from `overlaps_defaults`.
There are two situations that we can perform overlaps:
1. If `ident_1` is not specified, the overlaps can be performed between different comparisons.
2. If `each` is specified, the overlaps can be performed between different cases, where in each case, `ident_1` must be specified.
tool (choice): The method to use for the differential expression analysis.
- DESeq2: Use DESeq2 for the analysis.
- edgeR: Use edgeR for the analysis.
plots_defaults (ns): The default parameters for the plots.
- <more>: Parameters passed to `biopipen.utils::VizBulkDEGs()`.
See: <https://pwwang.github.io/biopipen.utils.R/reference/VizBulkDEGs.html>
plots (type=json): The parameters for the plots.
The keys are the names of the plots and the values are the parameters
for the plots. The parameters will override the defaults in `plots_defaults`.
If not specified, no plots will be generated.
cases (type=json): The cases for the analysis.
The keys are the names of the cases and the values are the arguments for
the analysis. The arguments include the ones inherited from `envs`.
If no cases are specified, a default case will be added with
the name `DEG Analysis` and the default values specified above.
""" # noqa: E501
input = "sobjfile:file"
output = "outdir:dir:{{in.sobjfile | stem}}.pseudobulk_deg"
lang = config.lang.rscript
script = "file://../scripts/scrna/PseudoBulkDEG.R"
envs = {
"ncores": config.misc.ncores,
"mutaters": {},
"cache": config.path.tmpdir,
"each": None,
"subset": None,
"aggregate_by": None,
"layer": "counts",
"assay": None,
"error": True,
"group_by": None,
"ident_1": None,
"ident_2": None,
"paired_by": None,
"tool": "DESeq2",
"dbs": ["KEGG_2021_Human", "MSigDB_Hallmark_2020"],
"sigmarkers": "p_val_adj < 0.05",
"enrich_style": "enrichr",
"allmarker_plots_defaults": {
"plot_type": None,
"more_formats": [],
"save_code": False,
"devpars": {"res": 100},
"order_by": "desc(abs(log2FC))",
"genes": 10,
},
"allmarker_plots": {},
"allenrich_plots_defaults": {
"plot_type": "heatmap",
"devpars": {"res": 100},
},
"allenrich_plots": {},
"marker_plots_defaults": {
"plot_type": None,
"more_formats": [],
"save_code": False,
"devpars": {"res": 100},
"order_by": "desc(abs(log2FC))",
"genes": 10,
},
"marker_plots": {
"Volcano Plot": {"plot_type": "volcano"},
},
"enrich_plots_defaults": {
"more_formats": [],
"save_code": False,
"devpars": {"res": 100},
},
"enrich_plots": {
"Bar Plot": {"plot_type": "bar", "ncol": 1, "top_term": 10},
},
"overlaps_defaults": {
"sigmarkers": None,
"plot_type": "venn",
"more_formats": [],
"save_code": False,
"devpars": {"res": 100},
},
"overlaps": {},
"cases": {},
}
plugin_opts = {
"report": "file://../reports/common.svelte",
"report_paging": 8,
}
class CellSNPLite(Proc):DOCS
"""Genotyping bi-allelic SNPs on single cells using cellsnp-lite.
The output from cellsnp-lite can be directly used for downstream analysis such as -
* Donor deconvolution in multiplexed single-cell RNA-seq data (e.g., with vireo).
* Allele-specific CNV analysis in single-cell or spatial transcriptomics data (e.g., with Numbat, XClone, or CalicoST).
* Clonal substructure discovery using single cell mitochondrial variants (e.g., with MQuad).
Here we only support model `1a`/`2a` in cellsnp-lite, which is designed for a single bam file as input.
For model `1b`/`2b`, which is designed for multiple bam files as input (e.g., one per cell), you can still
run with this process, but only one bam file is allowed.
See <https://github.com/single-cell-genetics/cellsnp-lite> for more details about cellsnp-lite.
Input:
crdir: The cellranger output directory or the directory containing
the bam file and barcode file.
It should contain the `outs/possorted_genome_bam.bam` file and
the `outs/filtered_feature_bc_matrix/barcodes.tsv.gz` file.
Output:
outdir: The output directory for cellsnp-lite results.
Envs:
ncores (type=int): The number of cores to use.
Will pass to `-p` option in cellsnp-lite.
regionsVCF: A vcf file listing all candidate SNPs, for fetch each variants.
genotype (flag): Whether to perform genotyping.
If `False`, only the allele counts will be computed.
gzip (flag): Whether to gzip the output files.
<more>: Other arguments passed to cellsnp-lite.
See <https://cellsnp-lite.readthedocs.io/en/latest/main/manual.html#full-parameters> for more details.
""" # noqa: E501
input = "crdir:dir"
output = """
outdir:dir:
{%- if basename(in.crdir) == 'outs' -%}
{{in.crdir | dirname | basename}}
{%- else -%}
{{in.crdir | basename}}
{%- endif -%}
.cellsnp
""" # noqa: E501
lang = config.lang.python
envs = {
"cellsnp_lite": config.exe.cellsnp_lite,
"ncores": config.misc.ncores,
"regionsVCF": None,
"genotype": False,
"gzip": True,
}
script = "file://../scripts/scrna/CellSNPLite.py"
class MQuad(Proc):DOCS
"""Clonal substructure discovery using single cell mitochondrial variants with MQuad.
MQuad uses a Mixture Model for Mitochondrial Mutation detection in single-cell omics data.
MQuad is a tool that detects mitochondrial mutations that are informative for clonal substructure inference. It uses a binomial mixture model to assess the heteroplasmy of mtDNA variants among background noise.
Input:
cellsnpout: The output directory from `CellSNPLite` process, which should contain
AD and DP sparse matrices (.mtx) or the vcf file.
Output:
outdir: The output directory for MQuad results.
Envs:
ncores (type=int): The number of cores to use.
It will be passed to `--nproc` option in MQuad.
seed (type=int): The seed for the random number generator.
It will be passed to `--randSeed` option in MQuad.
<more>: Other arguments passed to MQuad.
See <https://github.com/single-cell-genetics/MQuad/blob/main/mquad/mquad_CLI.py> for more details.
""" # noqa: E501
input = "cellsnpout:dir"
output = "outdir:dir:{{in.cellsnpout | stem}}.mquad"
lang = config.lang.python
envs = {
"mquad": config.exe.mquad,
"ncores": config.misc.ncores,
"seed": 8525,
}
script = "file://../scripts/scrna/MQuad.py"
plugin_opts = {
"report": "file://../reports/scrna/MQuad.svelte",
}
class MQuadMerge(Proc):DOCS
"""Merge multiple MQuad results for multiple samples.
We will merge the passed_ad.mtx, passed_dp.mtx and passed_variant_names.txt files
from multiple samples
Input:
mquaddirs: The output directories from `MQuad` process for multiple samples.
Output:
outdir: The output directory for merged MQuad results.
This can be later used as input to `VireoSNP` process.
"""
input = "mquaddirs:dirs"
output = "outdir:dir:{{in.mquaddirs | first | stem | append: '-etc'}}.mquadmerged"
lang = config.lang.python
script = "file://../scripts/scrna/MQuadMerge.py"
class VireoSNP(Proc):DOCS
"""Demultiplexing of single-cell RNA-seq data using vireoSNP.
VireoSNP is a Bayesian method for demultiplexing pooled single-cell RNA-seq data
using natural genetic variations (SNPs) without requiring genotype reference.
Refers to <https://github.com/single-cell-genetics/vireo/blob/master/examples/vireoSNP_clones.ipynb> for more details.
Input:
cellsnpout: The output directory from `CellSNPLite` process, which should
contain AD and DP sparse matrices (.mtx) or the vcf file.
To investigate the clonal substructure using mitochondrial variants, run
`MQuad` first to select the informative variants, and then use the
filtered vcf file from MQuad as input to this process.
Output:
outdir: The output directory for vireoSNP results.
Envs:
seed (type=int): The seed for the random number generator.
ncores (type=int): The number of cores to use for model fitting for
different number of clones.
n_init (type=int): The number of random initializations to perform.
n_clones (type=auto): The number of clones in the pooled single-cell RNA-seq data.
(Refered as `n_donor` in vireoSNP documentation.)
If a 2-element list of provided, we will try to estimate the best number of clones
between the two values using the elbow plot method.
min_iter (type=int): The minimum number of iterations to perform.
max_iter (type=int): The maximum number of iterations to perform.
""" # noqa: E501
input = "cellsnpout:dir"
output = "outdir:dir:{{in.cellsnpout | stem}}.vireoSNP"
lang = config.lang.python
envs = {
"seed": 8525,
"ncores": config.misc.ncores,
"n_init": 50,
"n_clones": [2, 10],
"min_iter": 30,
"max_iter": 100,
}
script = "file://../scripts/scrna/VireoSNP.py"
plugin_opts = {
"report": "file://../reports/scrna/VireoSNP.svelte",
}