Metabolic landscape analysis for scRNA-seq data
MetabolicPathwayActivity(Proc) — This process calculates the pathway activities in different groups and subsets.</>MetabolicFeatures(Proc) — This process performs enrichment analysis for the metabolic pathwaysfor each group in each subset. </>MetabolicPathwayHeterogeneity(Proc) — Calculate Metabolic Pathway heterogeneity.</>ScrnaMetabolicLandscape— Metabolic landscape analysis for scRNA-seq data</>
biopipen.ns.scrna_metabolic_landscape.MetabolicPathwayActivity(*args, **kwds) → Proc
This process calculates the pathway activities in different groups and subsets.
The cells are first grouped by subsets and then the metabolic activities are examined for each groups in different subsets.
For each subset, a heatmap and a violin plot will be generated. The heatmap shows the pathway activities for each group and each metabolic pathway
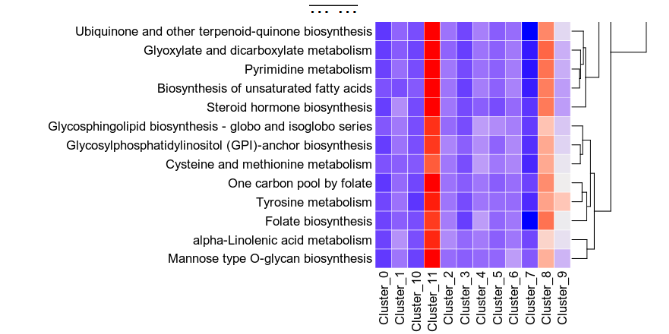 {: width="80%"}
The violin plot shows the distribution of the pathway activities for each group
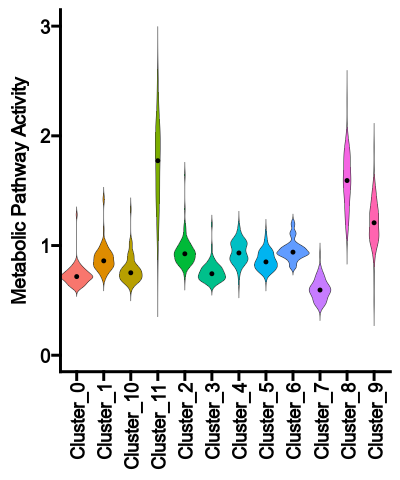 {: width="45%"}
You may also have a merged heatmap to show all subsets in one plot.
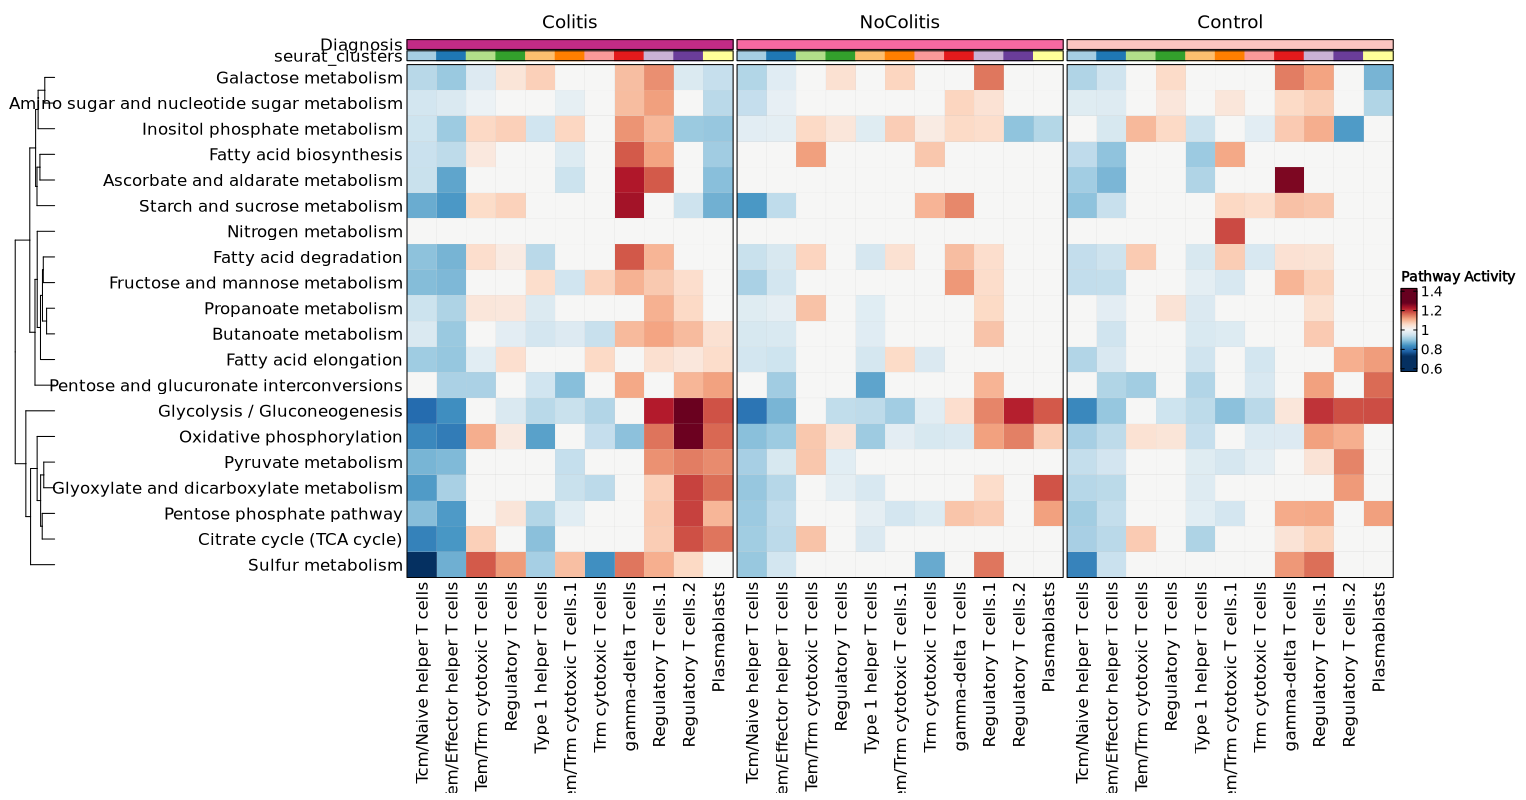 {: width="80%"}
cache— Should we detect whether the jobs are cached?desc— The description of the process. Will use the summary fromthe docstring by default.dirsig— When checking the signature for caching, whether should we walkthrough the content of the directory? This is sometimes time-consuming if the directory is big.envs— The arguments that are job-independent, useful for common optionsacross jobs.envs_depth— How deep to update the envs when subclassed.error_strategy— How to deal with the errors- - retry, ignore, halt
- - halt to halt the whole pipeline, no submitting new jobs
- - terminate to just terminate the job itself
export— When True, the results will be exported to<pipeline.outdir>Defaults to None, meaning only end processes will export. You can set it to True/False to enable or disable exporting for processesforks— How many jobs to run simultaneously?input— The keys for the input channelinput_data— The input data (will be computed for dependent processes)lang— The language for the script to run. Should be the path to theinterpreter iflangis not in$PATH.name— The name of the process. Will use the class name by default.nexts— Computed fromrequiresto build the process relationshipsnum_retries— How many times to retry to jobs once error occursorder— The execution order for this process. The bigger the numberis, the later the process will be executed. Default: 0. Note that the dependent processes will always be executed first. This doesn't work for start processes either, whose orders are determined byPipen.set_starts()output— The output keys for the output channel(the data will be computed)output_data— The output data (to pass to the next processes)output_flatten— Whether to flatten the output when saving to the outputdirectory. Normally, the output will be saved in a subdirectory named after the job index (e.g.<outdir>/0,<outdir>/1, etc.). Ifoutput_flattenis True, the output will be saved directly in the output directory without the subdirectories. This is useful when you want the job outputs to be directly revealed in the output directory. Note that this only works for processes with export=True or end processes and make sure the name of the output files won't conflict for jobs with each other when flattening. It takes 3 possible values- - None (default): flatten the output for single-job processes only
- - True: flatten the output for all processes
- - False: never flatten the output
plugin_opts— Options for process-level pluginsrequires— The dependency processesscheduler— The scheduler to run the jobsscheduler_opts— The options for the schedulerscript— The script template for the processsubmission_batch— How many jobs to be submited simultaneously.The program entrance for some schedulers may take too much resources when submitting a job or checking the job status. So we may use a smaller number here to limit the simultaneous submissions.template— Define the template engine to use.This could be either a template engine or a dict with keyengineindicating the template engine and the rest the arguments passed to the constructor of thepipen.template.Templateobject. The template engine could be either the name of the engine, currently jinja2 and liquidpy are supported, or a subclass ofpipen.template.Template. You can subclasspipen.template.Templateto use your own template engine.
sobjfile— The Seurat object file.It should be loaded as a Seurat object
outdir— The output directory.It will contain the pathway activity score files and plots.
cases(type=json) — Multiple cases for the analysis.If you only have one case, you can specify the parameters directly toenvs.ntimes,envs.subset_by,envs.group_by,envs.group1,envs.group2, andenvs.plots. The name of the case will beenvs.subset_by. If you have multiple cases, you can specify the parameters for each case in a dictionary. The keys will be the names of the cases and the values will be dictionaries with the parameters for each case, where the values will be inherited fromenvs.ntimes,envs.subset_by,envs.group_by,envs.group1,envs.group2, andenvs.plots.gmtfile(pgarg) — The GMT file with the metabolic pathways.Defaults toScrnaMetabolicLandscape.gmtfilegroup_by(pgarg;readonly) — Group the data by the given column in themetadata. For example,cluster. Defaults toScrnaMetabolicLandscape.group_byncores(type=int;pgarg) — Number of cores to use for parallelizationDefaults toScrnaMetabolicLandscape.ncoresntimes(type=int) — Number of permutations to estimate the p-valuesplots(type=json) — The plots to generate.Names will be used as the prefix for the output files. Values will be a dictionary with the following keys:- *
plot_typeis the type of plot to generate. One ofheatmap,
box,violinormerged_heatmap(all subsets in one plot).- *
devparsis a dictionary with the device parameters for the plot. - * Other arguments for
plotthis::Heatmap(),plotthis::BoxPlot()
plotthis::ViolinPlot(), depending on theplot_type.- *
subset_by(pgarg;type=auto;readonly) — Subset the data by the given column in themetadata. For example,Response.NAvalues will be removed in this column. Defaults toScrnaMetabolicLandscape.subset_byIf None, the data will not be subsetted. Multiple columns can be provided as a list, which is helpful when subsets have overlapping cells.
__init_subclass__()— Do the requirements inferring since we need them to build up theprocess relationship </>from_proc(proc,name,desc,envs,envs_depth,cache,export,output_flatten,error_strategy,num_retries,forks,input_data,order,plugin_opts,requires,scheduler,scheduler_opts,submission_batch)(Type) — Create a subclass of Proc using another Proc subclass or Proc itself</>gc()— GC process for the process to save memory after it's done</>log(level,msg,*args,logger)— Log message for the process</>run()— Init all other properties and jobs</>
pipen.proc.ProcMeta(name, bases, namespace, **kwargs)
Meta class for Proc
__call__(cls,*args,**kwds)(Proc) — Make sure Proc subclasses are singletons</>__instancecheck__(cls,instance)— Override for isinstance(instance, cls).</>__repr__(cls)(str) — Representation for the Proc subclasses</>__subclasscheck__(cls,subclass)— Override for issubclass(subclass, cls).</>register(cls,subclass)— Register a virtual subclass of an ABC.</>
register(cls, subclass)Register a virtual subclass of an ABC.
Returns the subclass, to allow usage as a class decorator.
__instancecheck__(cls, instance)Override for isinstance(instance, cls).
__subclasscheck__(cls, subclass)Override for issubclass(subclass, cls).
__repr__(cls) → strRepresentation for the Proc subclasses
__call__(cls, *args, **kwds)Make sure Proc subclasses are singletons
*args(Any) — and**kwds(Any) — Arguments for the constructor
The Proc instance
from_proc(proc, name=None, desc=None, envs=None, envs_depth=None, cache=None, export=None, output_flatten=None, error_strategy=None, num_retries=None, forks=None, input_data=None, order=None, plugin_opts=None, requires=None, scheduler=None, scheduler_opts=None, submission_batch=None)
Create a subclass of Proc using another Proc subclass or Proc itself
proc(Type) — The Proc subclassname(str, optional) — The new name of the processdesc(str, optional) — The new description of the processenvs(Mapping, optional) — The arguments of the process, will overwrite parent oneThe items that are specified will be inheritedenvs_depth(int, optional) — How deep to update the envs when subclassed.cache(bool, optional) — Whether we should check the cache for the jobsexport(bool, optional) — When True, the results will be exported to<pipeline.outdir>Defaults to None, meaning only end processes will export. You can set it to True/False to enable or disable exporting for processesoutput_flatten(bool | none, optional) — Whether to flatten the output when saving to the outputdirectory. Normally, the output will be saved in a subdirectory named after the job index (e.g.<outdir>/0,<outdir>/1, etc.). Ifoutput_flattenis True, the output will be saved directly in the output directory without the subdirectories. This is useful when you want the job outputs to be directly revealed in the output directory. Note that this only works for processes with export=True or end processes and make sure the name of the output files won't conflict for jobs with each other when flattening. It takes 3 possible values- - None (default): flatten the output for single-job processes only
- - True: flatten the output for all processes
- - False: never flatten the output
error_strategy(str, optional) — How to deal with the errors- - retry, ignore, halt
- - halt to halt the whole pipeline, no submitting new jobs
- - terminate to just terminate the job itself
num_retries(int, optional) — How many times to retry to jobs once error occursforks(int, optional) — New forks for the new processinput_data(Any, optional) — The input data for the process. Only when this processis a start processorder(int, optional) — The order to execute the new processplugin_opts(Mapping, optional) — The new plugin options, unspecified items will beinherited.requires(Sequence, optional) — The required processes for the new processscheduler(str, optional) — The new shedular to run the new processscheduler_opts(Mapping, optional) — The new scheduler options, unspecified items willbe inherited.submission_batch(int, optional) — How many jobs to be submited simultaneously.
The new process class
__init_subclass__()
Do the requirements inferring since we need them to build up theprocess relationship
run()
Init all other properties and jobs
gc()
GC process for the process to save memory after it's done
log(level, msg, *args, logger=<LoggerAdapter pipen.core (WARNING)>)
Log message for the process
level(int | str) — The log level of the recordmsg(str) — The message to log*args— The arguments to format the messagelogger(LoggerAdapter, optional) — The logging logger
biopipen.ns.scrna_metabolic_landscape.MetabolicFeatures(*args, **kwds) → Proc
cache— Should we detect whether the jobs are cached?desc— The description of the process. Will use the summary fromthe docstring by default.dirsig— When checking the signature for caching, whether should we walkthrough the content of the directory? This is sometimes time-consuming if the directory is big.envs— The arguments that are job-independent, useful for common optionsacross jobs.envs_depth— How deep to update the envs when subclassed.error_strategy— How to deal with the errors- - retry, ignore, halt
- - halt to halt the whole pipeline, no submitting new jobs
- - terminate to just terminate the job itself
export— When True, the results will be exported to<pipeline.outdir>Defaults to None, meaning only end processes will export. You can set it to True/False to enable or disable exporting for processesforks— How many jobs to run simultaneously?input— The keys for the input channelinput_data— The input data (will be computed for dependent processes)lang— The language for the script to run. Should be the path to theinterpreter iflangis not in$PATH.name— The name of the process. Will use the class name by default.nexts— Computed fromrequiresto build the process relationshipsnum_retries— How many times to retry to jobs once error occursorder— The execution order for this process. The bigger the numberis, the later the process will be executed. Default: 0. Note that the dependent processes will always be executed first. This doesn't work for start processes either, whose orders are determined byPipen.set_starts()output— The output keys for the output channel(the data will be computed)output_data— The output data (to pass to the next processes)output_flatten— Whether to flatten the output when saving to the outputdirectory. Normally, the output will be saved in a subdirectory named after the job index (e.g.<outdir>/0,<outdir>/1, etc.). Ifoutput_flattenis True, the output will be saved directly in the output directory without the subdirectories. This is useful when you want the job outputs to be directly revealed in the output directory. Note that this only works for processes with export=True or end processes and make sure the name of the output files won't conflict for jobs with each other when flattening. It takes 3 possible values- - None (default): flatten the output for single-job processes only
- - True: flatten the output for all processes
- - False: never flatten the output
plugin_opts— Options for process-level pluginsrequires— The dependency processesscheduler— The scheduler to run the jobsscheduler_opts— The options for the schedulerscript— The script template for the processsubmission_batch— How many jobs to be submited simultaneously.The program entrance for some schedulers may take too much resources when submitting a job or checking the job status. So we may use a smaller number here to limit the simultaneous submissions.template— Define the template engine to use.This could be either a template engine or a dict with keyengineindicating the template engine and the rest the arguments passed to the constructor of thepipen.template.Templateobject. The template engine could be either the name of the engine, currently jinja2 and liquidpy are supported, or a subclass ofpipen.template.Template. You can subclasspipen.template.Templateto use your own template engine.
sobjfile— The Seurat object file in rds.It should be loaded as a Seurat object
outdir— The output directory.It will contain the GSEA results and plots.
cases(type=json) — Multiple cases for the analysis.If you only have one case, you can specify the parameters directly toenvs.prerank_method,envs.subset_by,envs.group_by,envs.comparisons,envs.fgsea_argsandenvs.plots. The name of this default case will beenvs.subset_by. If you have multiple cases, you can specify the parameters for each case in a dictionary. The keys will be the names of the cases and the values will be dictionaries with the parameters for each case, where the values will be inherited fromenvs.prerank_method,envs.subset_by,envs.group_by,envs.comparisons,envs.fgsea_argsandenvs.plots.comparisons(type=list) — The comparison groups to use for the analysis.If not provided, each group in thegroup_bycolumn will be used to compare with the other groups. If a single group is provided as an element, it will be used to compare with all the other groups. For example, if we havegroup_by = "cluster"and we have1,2and3in thegroup_bycolumn, we could havecomparisons = ["1", "2"], which will compare the group1with groups2and3, and the group2with groups1and3. We could also havecomparisons = ["1:2", "1:3"], which will compare the group1with group2and group1with group3.fgsea_args(type=json) — Other arguments for thefgsea::fgsea()function.For example,{"minSize": 15, "maxSize": 500}. See https://rdrr.io/bioc/fgsea/man/fgsea.html for more details.gmtfile(pgarg) — The GMT file with the metabolic pathways.Defaults toScrnaMetabolicLandscape.gmtfilegroup_by(pgarg;readonly) — Group the data by the given column in themetadata. For example,cluster. Defaults toScrnaMetabolicLandscape.group_byncores(type=int;pgarg) — Number of cores to use for parallelization forthe comparisons for each subset and group. Defaults toScrnaMetabolicLandscape.ncores.plots(type=json) — The plots to generate.Names will be used as the title for the plot. Values will be the arguments passed tobiopipen.utils::VizGSEA()function. See https://pwwang.github.io/biopipen.utils.R/reference/VizGSEA.html. A keylevelis supported to specify the level of the plot. Possible values arecase, which includes all subsets and groups in the case;subset, which includes all groups in the subset; otherwise, it will plot for the groups. Forcase/subsetlevel plots, currentplot_typeonly "dot" is supported for now, then the values will be passed toplotthis::DotPlot()prerank_method(choice) — Method to use for gene preranking.Signal to noise: the larger the differences of the means (scaled by the standard deviations); that is, the more distinct the gene expression is in each phenotype and the more the gene acts as a “class marker.”. Absolute signal to noise: the absolute value of the signal to noise. T test: Uses the difference of means scaled by the standard deviation and number of samples. Ratio of classes: Uses the ratio of class means to calculate fold change for natural scale data. Diff of classes: Uses the difference of class means to calculate fold change for nature scale data Log2 ratio of classes: Uses the log2 ratio of class means to calculate fold change for natural scale data. This is the recommended statistic for calculating fold change for log scale data.- - signal_to_noise: Signal to noise
- - s2n: Alias of signal_to_noise
- - abs_signal_to_noise: absolute signal to noise
- - abs_s2n: Alias of abs_signal_to_noise
- - t_test: T test
- - ratio_of_classes: Also referred to as fold change
- - diff_of_classes: Difference of class means
- - log2_ratio_of_classes: Log2 ratio of class means
subset_by(pgarg;type=auto;readonly) — Subset the data by the given column in themetadata. For example,Response.NAvalues will be removed in this column. Defaults toScrnaMetabolicLandscape.subset_byIf None, the data will not be subsetted. Multiple columns can be provided as a list, which is helpful when subsets have overlapping cells.
__init_subclass__()— Do the requirements inferring since we need them to build up theprocess relationship </>from_proc(proc,name,desc,envs,envs_depth,cache,export,output_flatten,error_strategy,num_retries,forks,input_data,order,plugin_opts,requires,scheduler,scheduler_opts,submission_batch)(Type) — Create a subclass of Proc using another Proc subclass or Proc itself</>gc()— GC process for the process to save memory after it's done</>log(level,msg,*args,logger)— Log message for the process</>run()— Init all other properties and jobs</>
pipen.proc.ProcMeta(name, bases, namespace, **kwargs)
Meta class for Proc
__call__(cls,*args,**kwds)(Proc) — Make sure Proc subclasses are singletons</>__instancecheck__(cls,instance)— Override for isinstance(instance, cls).</>__repr__(cls)(str) — Representation for the Proc subclasses</>__subclasscheck__(cls,subclass)— Override for issubclass(subclass, cls).</>register(cls,subclass)— Register a virtual subclass of an ABC.</>
register(cls, subclass)Register a virtual subclass of an ABC.
Returns the subclass, to allow usage as a class decorator.
__instancecheck__(cls, instance)Override for isinstance(instance, cls).
__subclasscheck__(cls, subclass)Override for issubclass(subclass, cls).
__repr__(cls) → strRepresentation for the Proc subclasses
__call__(cls, *args, **kwds)Make sure Proc subclasses are singletons
*args(Any) — and**kwds(Any) — Arguments for the constructor
The Proc instance
from_proc(proc, name=None, desc=None, envs=None, envs_depth=None, cache=None, export=None, output_flatten=None, error_strategy=None, num_retries=None, forks=None, input_data=None, order=None, plugin_opts=None, requires=None, scheduler=None, scheduler_opts=None, submission_batch=None)
Create a subclass of Proc using another Proc subclass or Proc itself
proc(Type) — The Proc subclassname(str, optional) — The new name of the processdesc(str, optional) — The new description of the processenvs(Mapping, optional) — The arguments of the process, will overwrite parent oneThe items that are specified will be inheritedenvs_depth(int, optional) — How deep to update the envs when subclassed.cache(bool, optional) — Whether we should check the cache for the jobsexport(bool, optional) — When True, the results will be exported to<pipeline.outdir>Defaults to None, meaning only end processes will export. You can set it to True/False to enable or disable exporting for processesoutput_flatten(bool | none, optional) — Whether to flatten the output when saving to the outputdirectory. Normally, the output will be saved in a subdirectory named after the job index (e.g.<outdir>/0,<outdir>/1, etc.). Ifoutput_flattenis True, the output will be saved directly in the output directory without the subdirectories. This is useful when you want the job outputs to be directly revealed in the output directory. Note that this only works for processes with export=True or end processes and make sure the name of the output files won't conflict for jobs with each other when flattening. It takes 3 possible values- - None (default): flatten the output for single-job processes only
- - True: flatten the output for all processes
- - False: never flatten the output
error_strategy(str, optional) — How to deal with the errors- - retry, ignore, halt
- - halt to halt the whole pipeline, no submitting new jobs
- - terminate to just terminate the job itself
num_retries(int, optional) — How many times to retry to jobs once error occursforks(int, optional) — New forks for the new processinput_data(Any, optional) — The input data for the process. Only when this processis a start processorder(int, optional) — The order to execute the new processplugin_opts(Mapping, optional) — The new plugin options, unspecified items will beinherited.requires(Sequence, optional) — The required processes for the new processscheduler(str, optional) — The new shedular to run the new processscheduler_opts(Mapping, optional) — The new scheduler options, unspecified items willbe inherited.submission_batch(int, optional) — How many jobs to be submited simultaneously.
The new process class
__init_subclass__()
Do the requirements inferring since we need them to build up theprocess relationship
run()
Init all other properties and jobs
gc()
GC process for the process to save memory after it's done
log(level, msg, *args, logger=<LoggerAdapter pipen.core (WARNING)>)
Log message for the process
level(int | str) — The log level of the recordmsg(str) — The message to log*args— The arguments to format the messagelogger(LoggerAdapter, optional) — The logging logger
biopipen.ns.scrna_metabolic_landscape.MetabolicPathwayHeterogeneity(*args, **kwds) → Proc
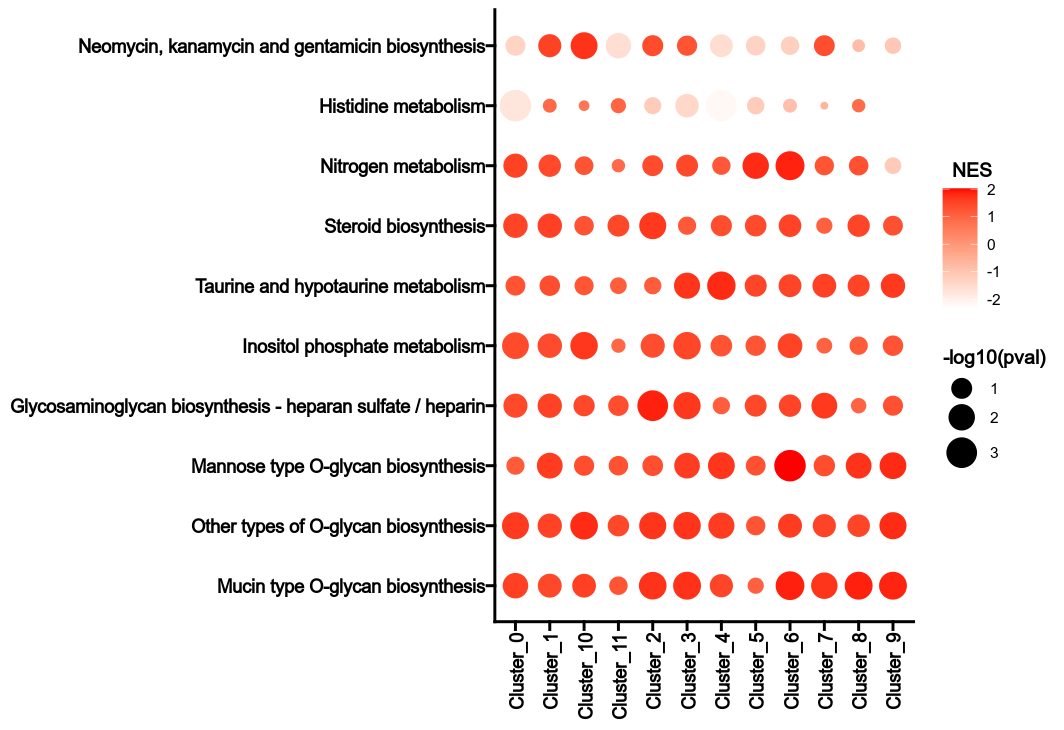
Calculate Metabolic Pathway heterogeneity.
For each subset, the normalized enrichment score (NES) of each metabolic pathway is calculated for each group. The NES is calculated by comparing the enrichment score of the subset to the enrichment scores of the same subset in the permutations. The p-value is calculated by comparing the NES to the NESs of the same subset in the permutations. The heterogeneity can be reflected by the NES values and the p-values in different groups for the metabolic pathways.
cache— Should we detect whether the jobs are cached?desc— The description of the process. Will use the summary fromthe docstring by default.dirsig— When checking the signature for caching, whether should we walkthrough the content of the directory? This is sometimes time-consuming if the directory is big.envs— The arguments that are job-independent, useful for common optionsacross jobs.envs_depth— How deep to update the envs when subclassed.error_strategy— How to deal with the errors- - retry, ignore, halt
- - halt to halt the whole pipeline, no submitting new jobs
- - terminate to just terminate the job itself
export— When True, the results will be exported to<pipeline.outdir>Defaults to None, meaning only end processes will export. You can set it to True/False to enable or disable exporting for processesforks— How many jobs to run simultaneously?input— The keys for the input channelinput_data— The input data (will be computed for dependent processes)lang— The language for the script to run. Should be the path to theinterpreter iflangis not in$PATH.name— The name of the process. Will use the class name by default.nexts— Computed fromrequiresto build the process relationshipsnum_retries— How many times to retry to jobs once error occursorder— The execution order for this process. The bigger the numberis, the later the process will be executed. Default: 0. Note that the dependent processes will always be executed first. This doesn't work for start processes either, whose orders are determined byPipen.set_starts()output— The output keys for the output channel(the data will be computed)output_data— The output data (to pass to the next processes)output_flatten— Whether to flatten the output when saving to the outputdirectory. Normally, the output will be saved in a subdirectory named after the job index (e.g.<outdir>/0,<outdir>/1, etc.). Ifoutput_flattenis True, the output will be saved directly in the output directory without the subdirectories. This is useful when you want the job outputs to be directly revealed in the output directory. Note that this only works for processes with export=True or end processes and make sure the name of the output files won't conflict for jobs with each other when flattening. It takes 3 possible values- - None (default): flatten the output for single-job processes only
- - True: flatten the output for all processes
- - False: never flatten the output
plugin_opts— Options for process-level pluginsrequires— The dependency processesscheduler— The scheduler to run the jobsscheduler_opts— The options for the schedulerscript— The script template for the processsubmission_batch— How many jobs to be submited simultaneously.The program entrance for some schedulers may take too much resources when submitting a job or checking the job status. So we may use a smaller number here to limit the simultaneous submissions.template— Define the template engine to use.This could be either a template engine or a dict with keyengineindicating the template engine and the rest the arguments passed to the constructor of thepipen.template.Templateobject. The template engine could be either the name of the engine, currently jinja2 and liquidpy are supported, or a subclass ofpipen.template.Template. You can subclasspipen.template.Templateto use your own template engine.
cases(type=json) — Multiple cases for the analysis.If you only have one case, you can specify the parameters directly toenvs.subset_by,envs.group_by,envs.fgsea_args,envs.plots,envs.select_pcs, andenvs.pathway_pval_cutoff. The name of this default case will beenvs.subset_by. If you have multiple cases, you can specify the parameters for each case in a dictionary. The keys will be the names of the cases and the values will be dictionaries with the parameters for each case, where the values will be inherited fromenvs.subset_by,envs.group_by,envs.fgsea_args,envs.plots,envs.select_pcs, andenvs.pathway_pval_cutoff.fgsea_args(type=json) — Other arguments for thefgsea::fgsea()function.For example,{"minSize": 15, "maxSize": 500}. See https://rdrr.io/bioc/fgsea/man/fgsea.html for more details.gmtfile(pgarg) — The GMT file with the metabolic pathways.Defaults toScrnaMetabolicLandscape.gmtfilegroup_by(pgarg;readonly) — Group the data by the given column in themetadata. For example,cluster. Defaults toScrnaMetabolicLandscape.group_byncores(type=int;pgarg) — Number of cores to use for parallelizationDefaults toScrnaMetabolicLandscape.ncorespathway_pval_cutoff(type=float) — The p-value cutoff to selectthe enriched pathwaysplots(type=json) — The plots to generate.Names will be used as the title for the plot. Values will be the arguments passed tobiopipen.utils::VizGSEA()function. See https://pwwang.github.io/biopipen.utils.R/reference/VizGSEA.html.select_pcs(type=float) — Select the PCs to use for the analysis.subset_by(pgarg;type=auto;readonly) — Subset the data by the given column in themetadata. For example,Response.NAvalues will be removed in this column. Defaults toScrnaMetabolicLandscape.subset_byIf None, the data will not be subsetted. Multiple columns can be provided as a list, which is helpful when subsets have overlapping cells.
__init_subclass__()— Do the requirements inferring since we need them to build up theprocess relationship </>from_proc(proc,name,desc,envs,envs_depth,cache,export,output_flatten,error_strategy,num_retries,forks,input_data,order,plugin_opts,requires,scheduler,scheduler_opts,submission_batch)(Type) — Create a subclass of Proc using another Proc subclass or Proc itself</>gc()— GC process for the process to save memory after it's done</>log(level,msg,*args,logger)— Log message for the process</>run()— Init all other properties and jobs</>
pipen.proc.ProcMeta(name, bases, namespace, **kwargs)
Meta class for Proc
__call__(cls,*args,**kwds)(Proc) — Make sure Proc subclasses are singletons</>__instancecheck__(cls,instance)— Override for isinstance(instance, cls).</>__repr__(cls)(str) — Representation for the Proc subclasses</>__subclasscheck__(cls,subclass)— Override for issubclass(subclass, cls).</>register(cls,subclass)— Register a virtual subclass of an ABC.</>
register(cls, subclass)Register a virtual subclass of an ABC.
Returns the subclass, to allow usage as a class decorator.
__instancecheck__(cls, instance)Override for isinstance(instance, cls).
__subclasscheck__(cls, subclass)Override for issubclass(subclass, cls).
__repr__(cls) → strRepresentation for the Proc subclasses
__call__(cls, *args, **kwds)Make sure Proc subclasses are singletons
*args(Any) — and**kwds(Any) — Arguments for the constructor
The Proc instance
from_proc(proc, name=None, desc=None, envs=None, envs_depth=None, cache=None, export=None, output_flatten=None, error_strategy=None, num_retries=None, forks=None, input_data=None, order=None, plugin_opts=None, requires=None, scheduler=None, scheduler_opts=None, submission_batch=None)
Create a subclass of Proc using another Proc subclass or Proc itself
proc(Type) — The Proc subclassname(str, optional) — The new name of the processdesc(str, optional) — The new description of the processenvs(Mapping, optional) — The arguments of the process, will overwrite parent oneThe items that are specified will be inheritedenvs_depth(int, optional) — How deep to update the envs when subclassed.cache(bool, optional) — Whether we should check the cache for the jobsexport(bool, optional) — When True, the results will be exported to<pipeline.outdir>Defaults to None, meaning only end processes will export. You can set it to True/False to enable or disable exporting for processesoutput_flatten(bool | none, optional) — Whether to flatten the output when saving to the outputdirectory. Normally, the output will be saved in a subdirectory named after the job index (e.g.<outdir>/0,<outdir>/1, etc.). Ifoutput_flattenis True, the output will be saved directly in the output directory without the subdirectories. This is useful when you want the job outputs to be directly revealed in the output directory. Note that this only works for processes with export=True or end processes and make sure the name of the output files won't conflict for jobs with each other when flattening. It takes 3 possible values- - None (default): flatten the output for single-job processes only
- - True: flatten the output for all processes
- - False: never flatten the output
error_strategy(str, optional) — How to deal with the errors- - retry, ignore, halt
- - halt to halt the whole pipeline, no submitting new jobs
- - terminate to just terminate the job itself
num_retries(int, optional) — How many times to retry to jobs once error occursforks(int, optional) — New forks for the new processinput_data(Any, optional) — The input data for the process. Only when this processis a start processorder(int, optional) — The order to execute the new processplugin_opts(Mapping, optional) — The new plugin options, unspecified items will beinherited.requires(Sequence, optional) — The required processes for the new processscheduler(str, optional) — The new shedular to run the new processscheduler_opts(Mapping, optional) — The new scheduler options, unspecified items willbe inherited.submission_batch(int, optional) — How many jobs to be submited simultaneously.
The new process class
__init_subclass__()
Do the requirements inferring since we need them to build up theprocess relationship
run()
Init all other properties and jobs
gc()
GC process for the process to save memory after it's done
log(level, msg, *args, logger=<LoggerAdapter pipen.core (WARNING)>)
Log message for the process
level(int | str) — The log level of the recordmsg(str) — The message to log*args— The arguments to format the messagelogger(LoggerAdapter, optional) — The logging logger
biopipen.ns.scrna_metabolic_landscape.ScrnaMetabolicLandscape(*args, **kwds)
Metabolic landscape analysis for scRNA-seq data
An abstract from https://github.com/LocasaleLab/Single-Cell-Metabolic-Landscape
See docs here for more details https://pwwang.github.io/biopipen/pipelines/scrna_metabolic_landscape
Reference: Xiao, Zhengtao, Ziwei Dai, and Jason W. Locasale. "Metabolic landscape of the tumor microenvironment at single cell resolution." Nature communications 10.1 (2019): 1-12.
parser— Pass arguments to initialize the parser
The parser is a singleton and by default initalized atplugin.on_init()hook, which happens usually after the initialization of a process group. </>
ProcGropuMeta— Meta class for ProcGroup</>
pipen.procgroup.ProcGropuMeta(name, bases, namespace, **kwargs)
Meta class for ProcGroup
__call__(cls,*args,**kwds)— Make sure Proc subclasses are singletons</>__instancecheck__(cls,instance)— Override for isinstance(instance, cls).</>__subclasscheck__(cls,subclass)— Override for issubclass(subclass, cls).</>register(cls,subclass)— Register a virtual subclass of an ABC.</>
register(cls, subclass)Register a virtual subclass of an ABC.
Returns the subclass, to allow usage as a class decorator.
__instancecheck__(cls, instance)Override for isinstance(instance, cls).
__subclasscheck__(cls, subclass)Override for issubclass(subclass, cls).
__call__(cls, *args, **kwds)Make sure Proc subclasses are singletons
*args— and**kwds— Arguments for the constructor
The Proc instance
__init_subclass__()
This method is called when a class is subclassed.
The default implementation does nothing. It may be overridden to extend subclasses.
add_proc(self_or_method, proc=None)
Add a process to the proc group
It works either as a decorator to the process directly or as a decorator to a method that returns the process.
self_or_method(Union) — The proc group instance or a method thatreturns the processproc(Optional, optional) — The process class ifself_or_methodis the proc group
The process class if self_or_method is the proc group, ora cached property that returns the process class
as_pipen(name=None, desc=None, outdir=None, **kwargs)
Convert the pipeline to a Pipen instance
name(str | none, optional) — The name of the pipelinedesc(str | none, optional) — The description of the pipelineoutdir(str | pathlib.path | none, optional) — The output directory of the pipeline**kwargs— The keyword arguments to pass to Pipen
The Pipen instance