Visualize Cell QC metrics of Seurat object
Arguments
- object
A Seurat object with cell QC metrics
- features
Features to visualize, genes are supported.
- plot_type
Type of plot to generate One of 'violin', 'box', 'scatter', 'bar', 'ridge' and 'table' If 'plot_type' is 'table', it will return a data frame with number of cells before and after filtering
- scatter_x
Feature to use as x-axis in scatter plot. If it is one of the features, it will be removed from the features
- palette
Color palette to use
- assay
Assay used to extract expression if genes are included in features. Default is "RNA".
- layer
Layer used to extract expression if genes are included in features. Default is "counts". If the specified layer is not found, and there are layers with the specified layer as prefix, it will join layers first and try again.
- ...
Additional arguments to pass to the plot function
Examples
# \donttest{
set.seed(8525)
sobj <- SeuratObject::pbmc_small
sobj$.QC <- sample(c(TRUE, FALSE), ncol(sobj), replace = TRUE)
sobj$Sample <- sample(c("Sample1", "Sample2"), ncol(sobj), replace = TRUE)
sobj$percent.mt <- runif(ncol(sobj), 0, 1)
sobj$percent.ribo <- runif(ncol(sobj), 0, 1)
sobj$percent.hb <- runif(ncol(sobj), 0, 1)
sobj$percent.plat <- runif(ncol(sobj), 0, 1)
sobj$nFeature_RNA <- as.integer(runif(ncol(sobj), 1000, 5000))
sobj$nCount_RNA <- as.integer(runif(ncol(sobj), 1000, 5000))
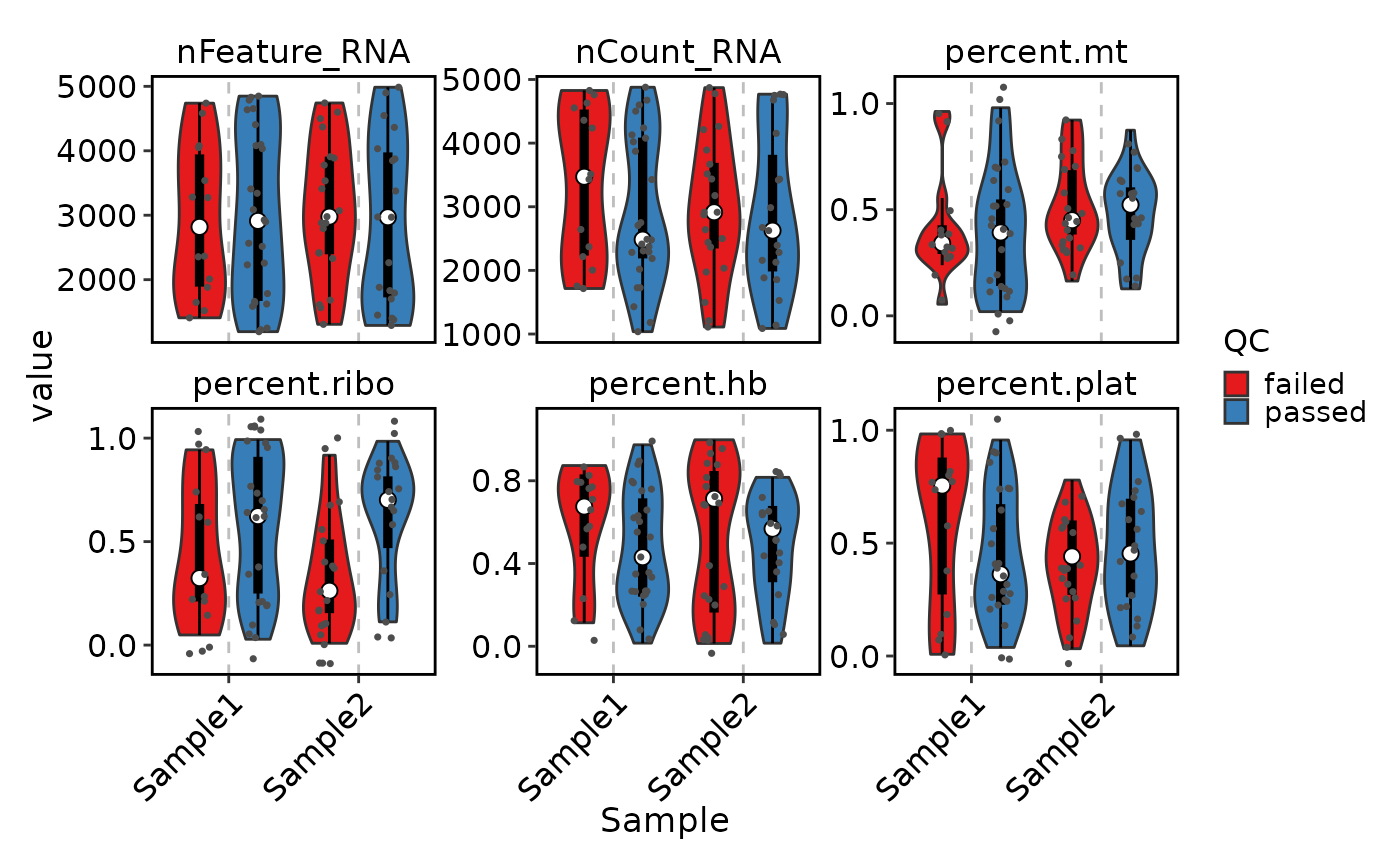
# Visualize cell QC metrics
VizSeuratCellQC(sobj)
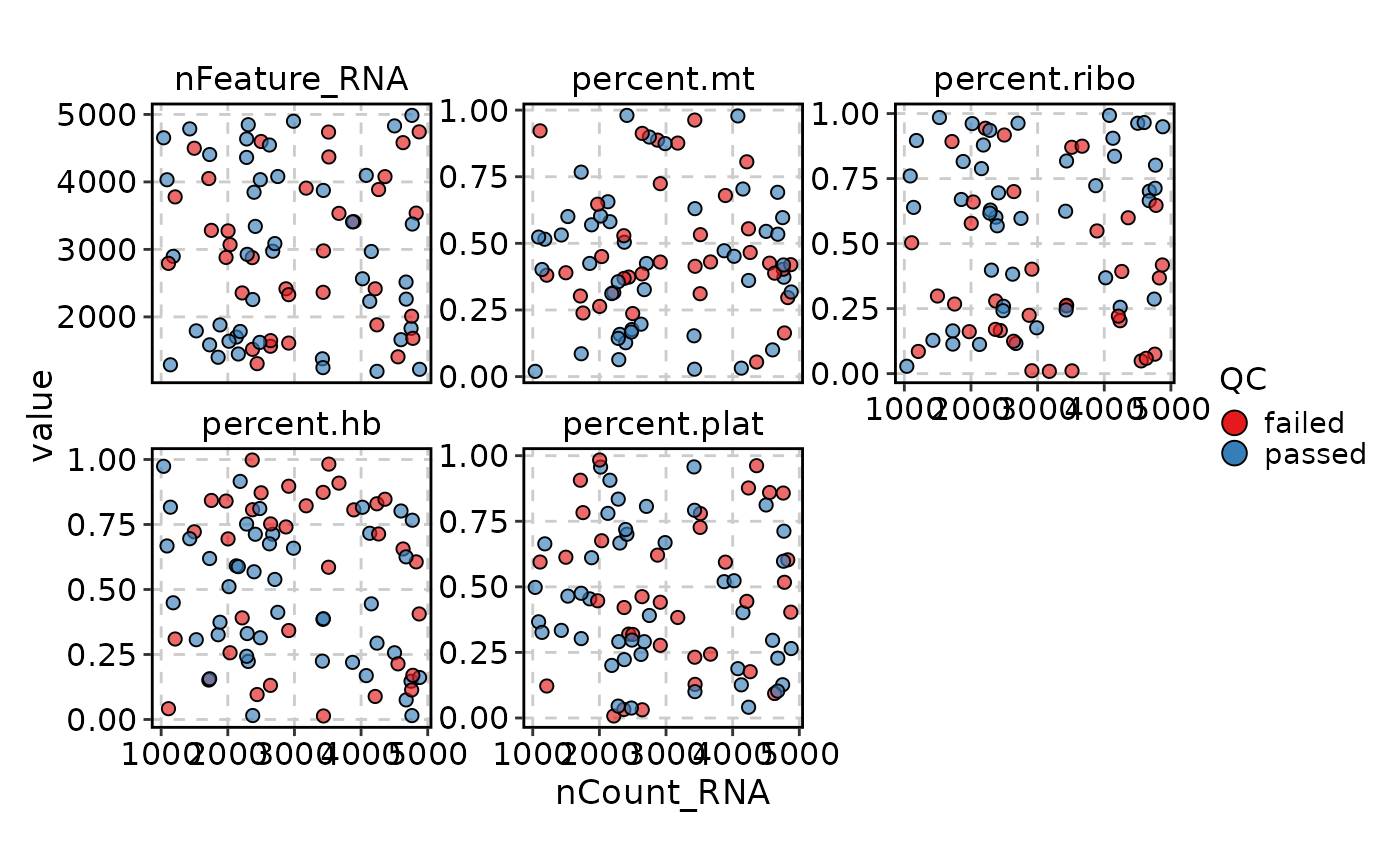
 VizSeuratCellQC(sobj, plot_type = "scatter")
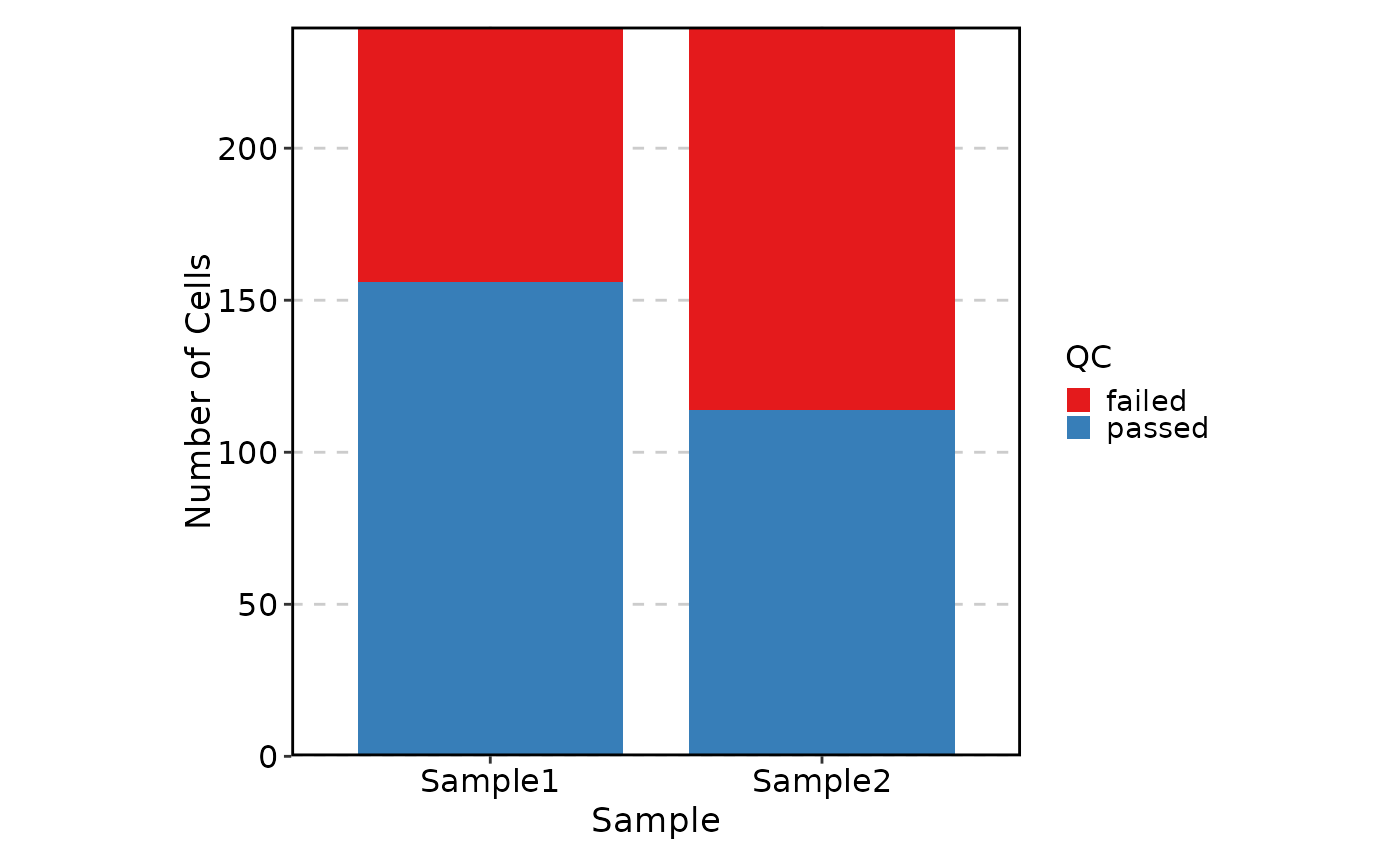
 VizSeuratCellQC(sobj, plot_type = "bar")
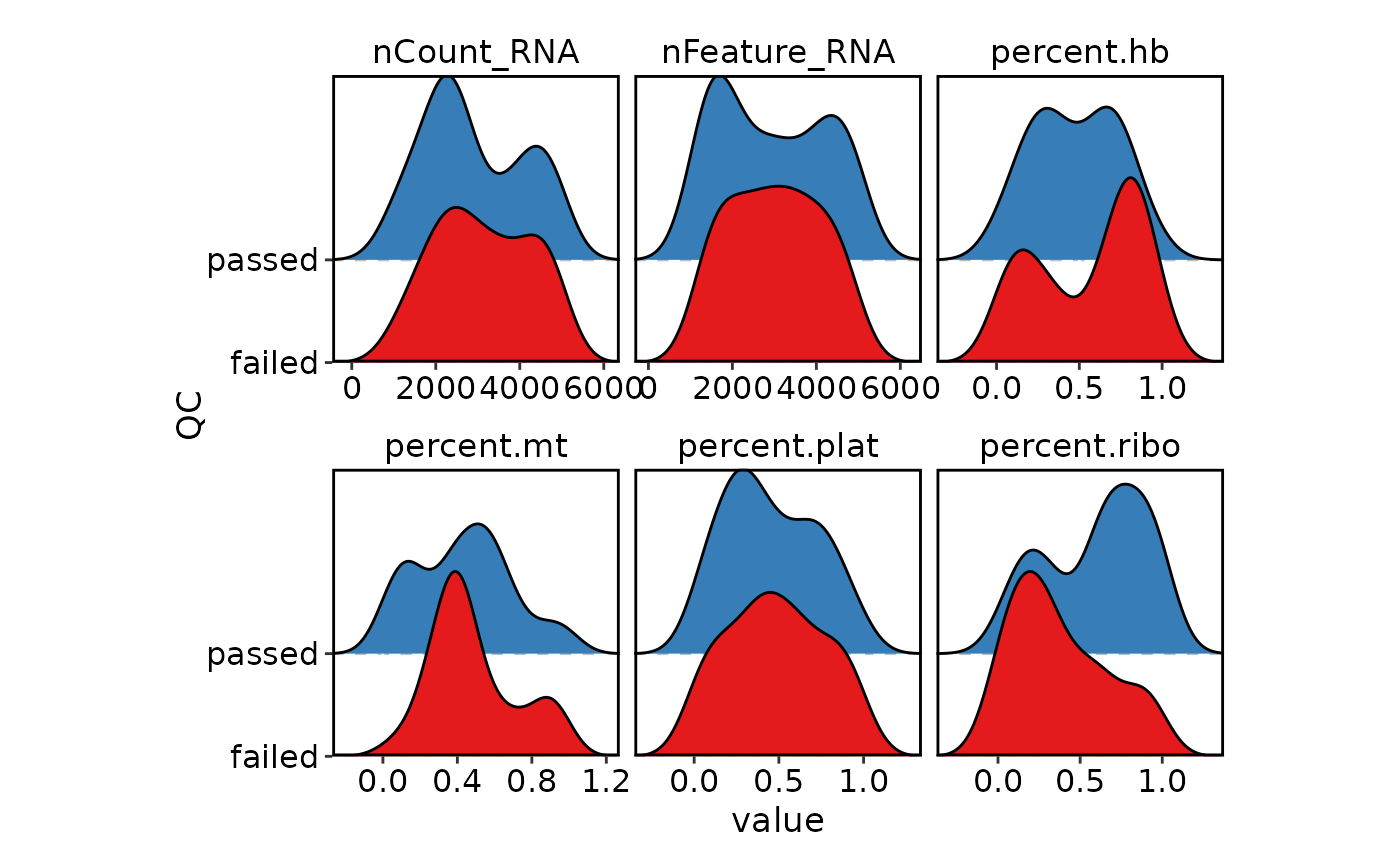
 VizSeuratCellQC(sobj, plot_type = "ridge")
#> Picking joint bandwidth of 509
#> Picking joint bandwidth of 501
#> Picking joint bandwidth of 0.0973
#> Picking joint bandwidth of 0.128
#> Picking joint bandwidth of 0.125
#> Picking joint bandwidth of 0.12
#> Picking joint bandwidth of 509
#> Picking joint bandwidth of 501
#> Picking joint bandwidth of 0.0973
#> Picking joint bandwidth of 0.128
#> Picking joint bandwidth of 0.125
#> Picking joint bandwidth of 0.12
VizSeuratCellQC(sobj, plot_type = "ridge")
#> Picking joint bandwidth of 509
#> Picking joint bandwidth of 501
#> Picking joint bandwidth of 0.0973
#> Picking joint bandwidth of 0.128
#> Picking joint bandwidth of 0.125
#> Picking joint bandwidth of 0.12
#> Picking joint bandwidth of 509
#> Picking joint bandwidth of 501
#> Picking joint bandwidth of 0.0973
#> Picking joint bandwidth of 0.128
#> Picking joint bandwidth of 0.125
#> Picking joint bandwidth of 0.12
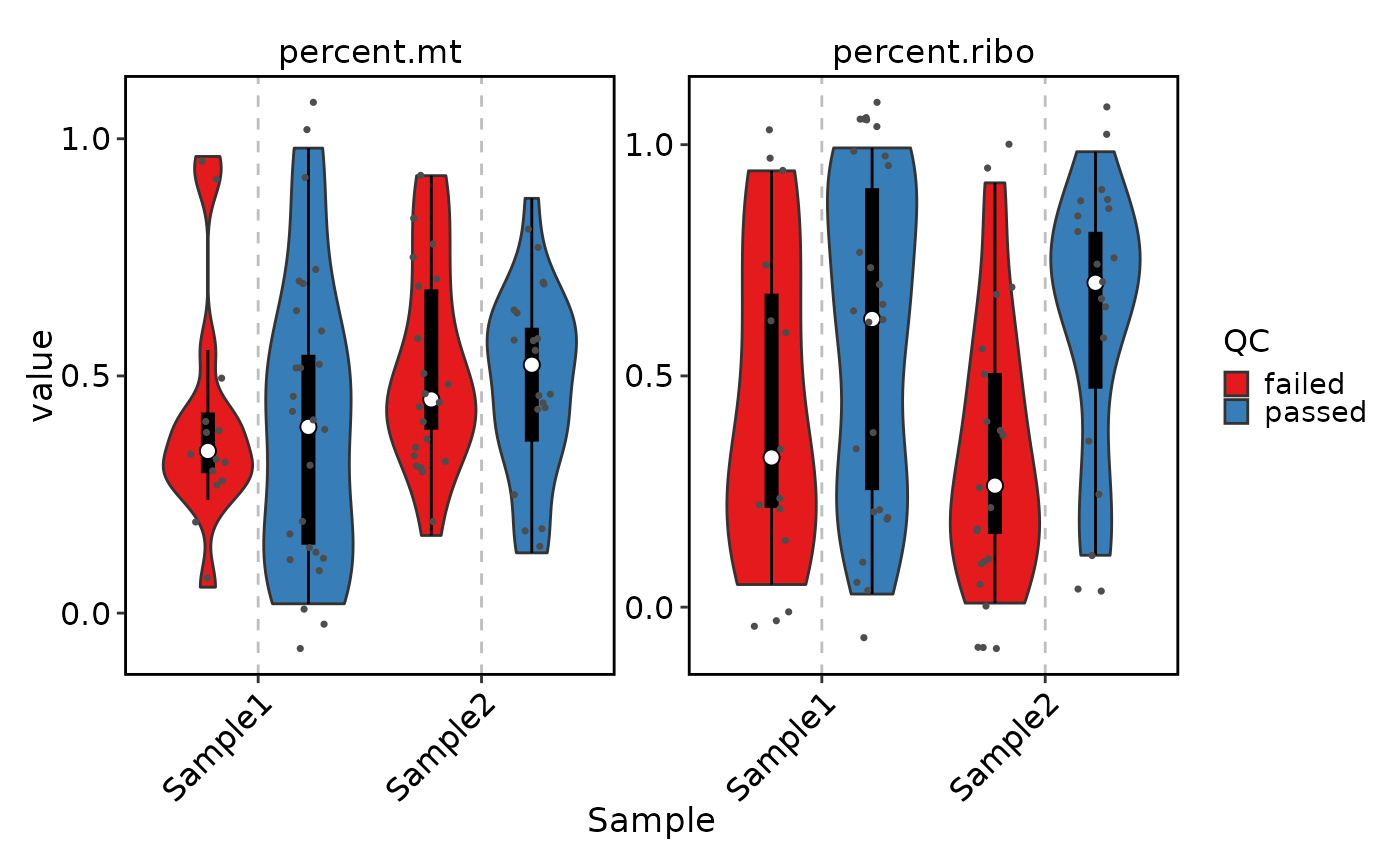
 VizSeuratCellQC(sobj, features = c("percent.mt", "percent.ribo"))
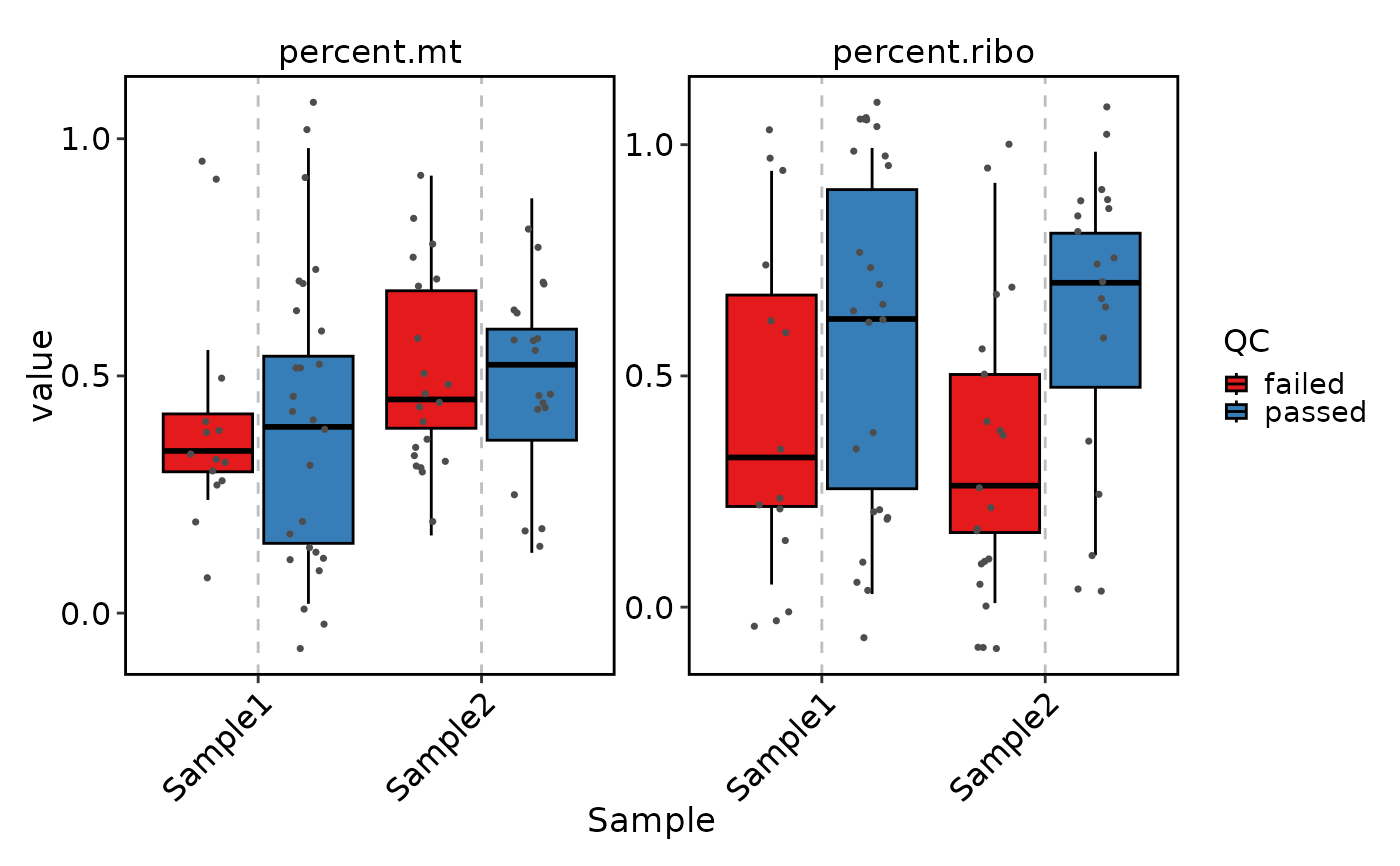
 VizSeuratCellQC(sobj, features = c("percent.mt", "percent.ribo"), plot_type = "box")
 VizSeuratCellQC(sobj, plot_type = "table")
#> # A tibble: 3 × 4
#> Sample failed passed total
#> <fct> <int> <int> <int>
#> 1 Sample1 14 26 40
#> 2 Sample2 21 19 40
#> 3 All_Samples 35 45 80
dim(sobj)
#> [1] 230 80
sobj <- FinishSeuratQC(sobj)
dim(sobj)
#> [1] 230 45
# }
VizSeuratCellQC(sobj, plot_type = "table")
#> # A tibble: 3 × 4
#> Sample failed passed total
#> <fct> <int> <int> <int>
#> 1 Sample1 14 26 40
#> 2 Sample2 21 19 40
#> 3 All_Samples 35 45 80
dim(sobj)
#> [1] 230 80
sobj <- FinishSeuratQC(sobj)
dim(sobj)
#> [1] 230 45
# }