Visualize bulk differentially expressed genes
Arguments
- degs
DEGs from RunDEGAnalysis
- plot_type
Type of plot to generate One of 'volcano', 'violin', 'box', 'bar', 'ridge', 'dim', 'heatmap', 'dot'
- order_by
An expression in string to order the genes
- genes
Number of genes genes to visualize (based on the 'order_by' expression) Or an expression in string to filter the genes (passed by dplyr::filter) Only works when plot_type is not a volcano plot
- outprefix
Prefix of the output file
- devpars
List of parameters to save the plot
- more_formats
Additional formats to save the plot in addition to 'png'
- save_code
Whether to save the code to reproduce the plot
- show_row_names
Whether to show row names in the heatmap
- show_column_names
Whether to show column names in the heatmap
- ...
Additional arguments to pass to the plot function
For 'volcano', additional arguments to pass to 'scplotter::VolcanoPlot'
For 'violin', 'box', 'bar', 'ridge', 'dim', 'heatmap', 'dot', additional arguments to pass to 'scplotter::FeatureStatPlot'
Examples
# \donttest{
set.seed(8525)
data = matrix(rnbinom(1000, mu = 5, size = 1), nrow = 100, ncol = 10)
rownames(data) <- paste0("Gene", 1:100)
colnames(data) <- paste0("Sample", 1:10)
meta <- data.frame(
Sample = colnames(data),
Condition = rep(c("Control", "Treatment"), each = 5)
)
degs <- RunDEGAnalysis(data, meta = meta,
group_by = "Condition", ident_1 = "Treatment", tool = "edger")
#> INFO [2026-06-08 05:53:44] Running differential gene expression analysis using edgeR...
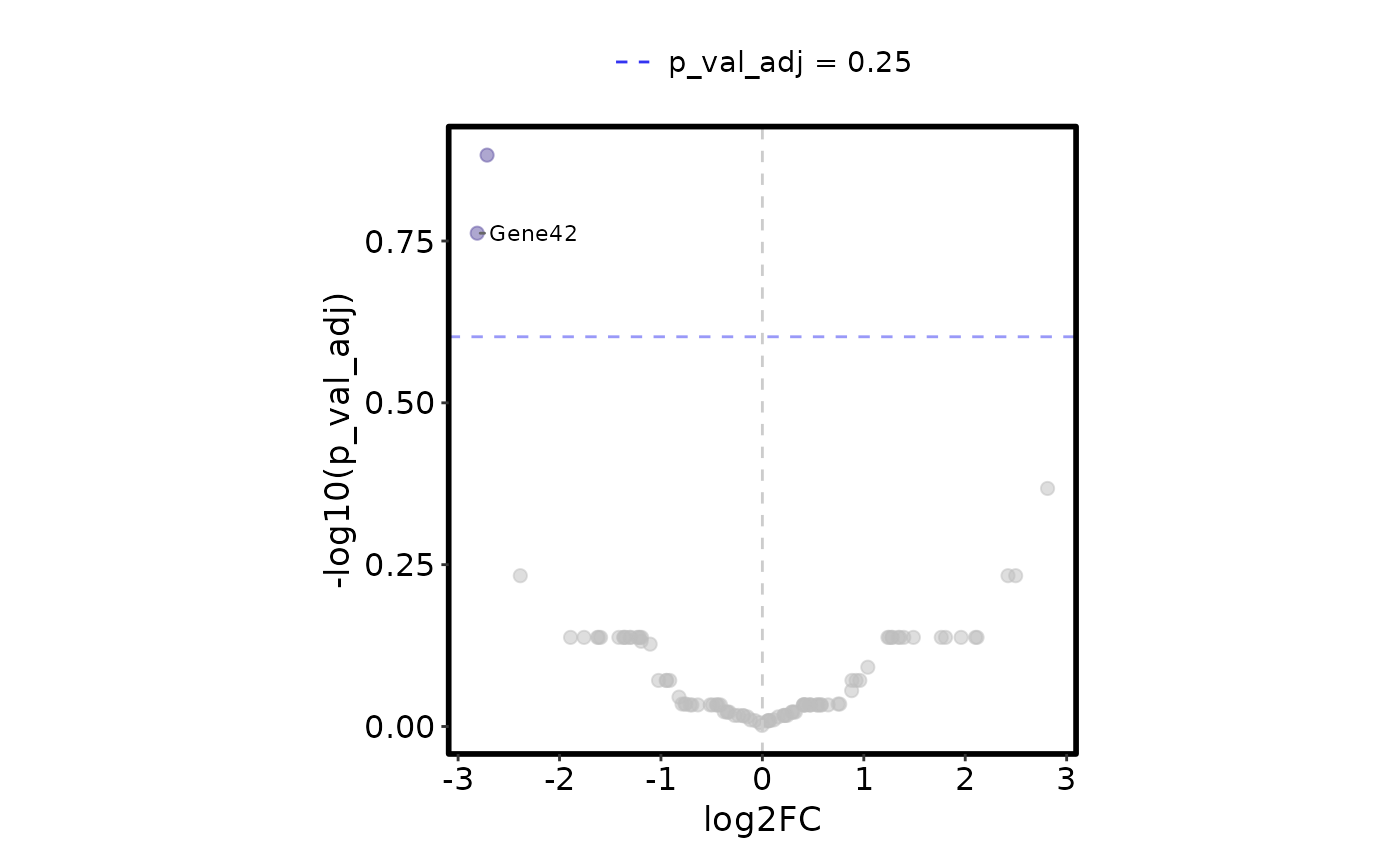
VizBulkDEGs(degs, plot_type = "volcano", legend.position = "top", y_cutoff = 0.25)
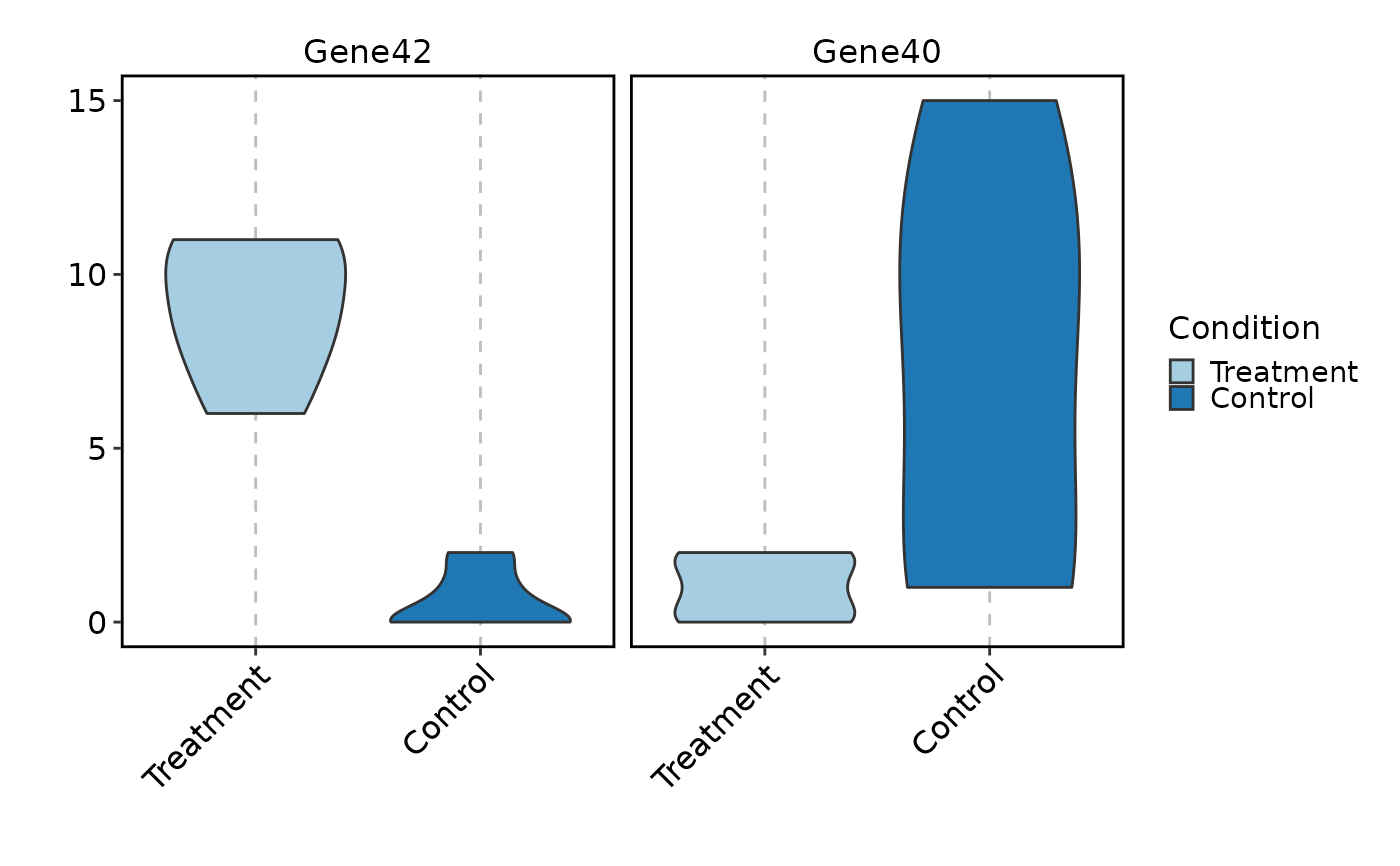
 VizBulkDEGs(degs, plot_type = "violin", genes = 2)
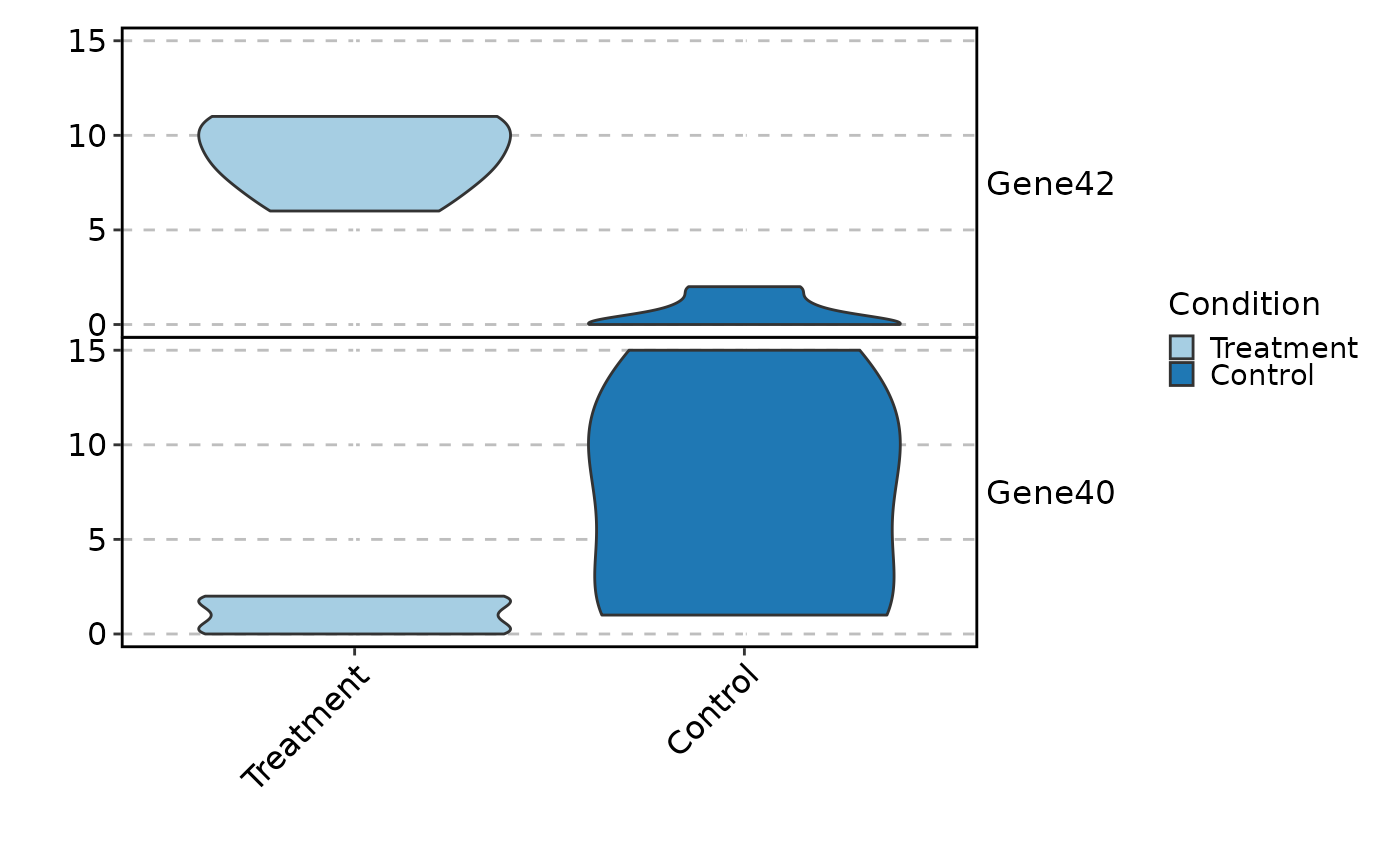
 VizBulkDEGs(degs, plot_type = "violin", stack = TRUE, genes = 2)
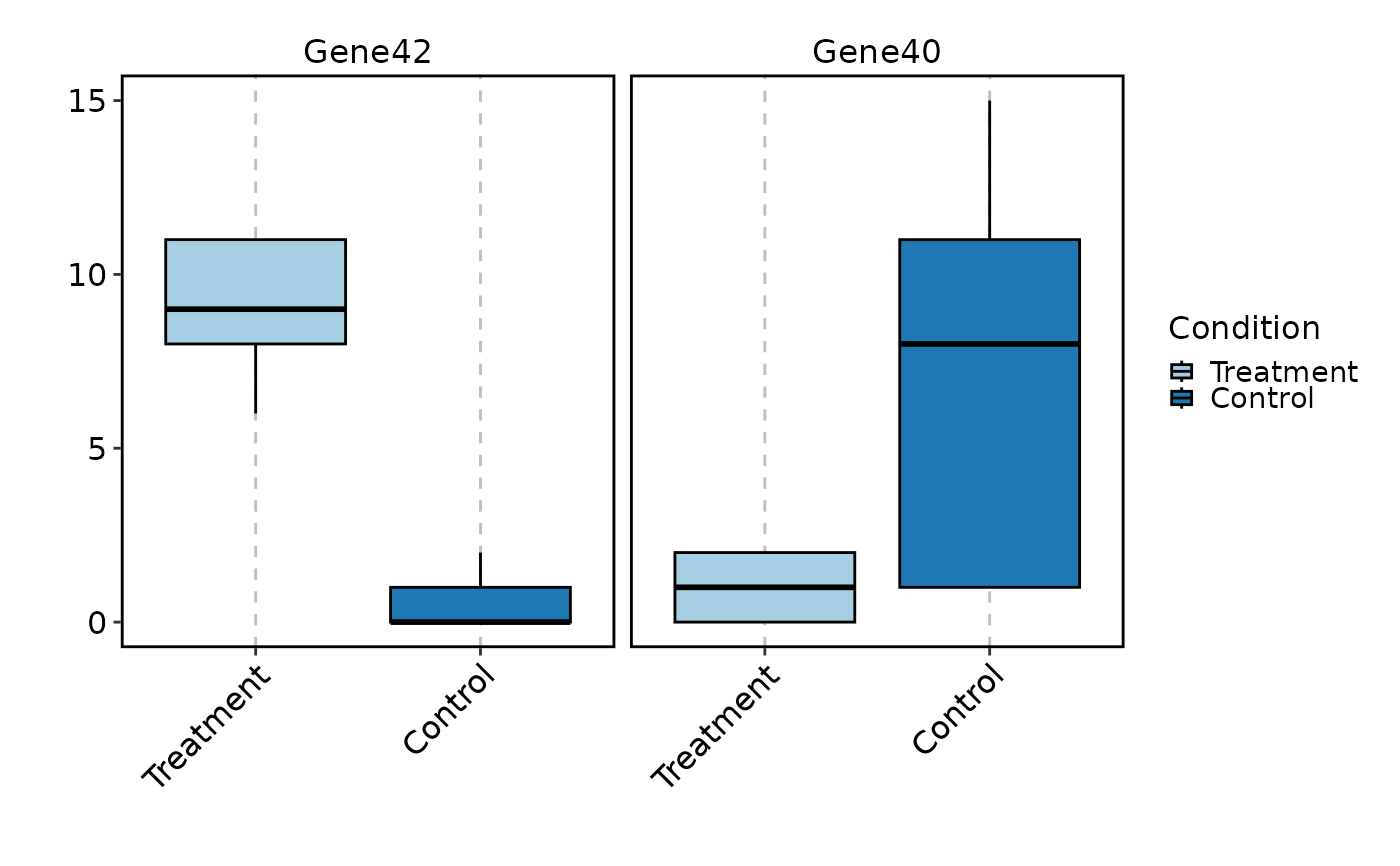
 VizBulkDEGs(degs, plot_type = "box", genes = 2)
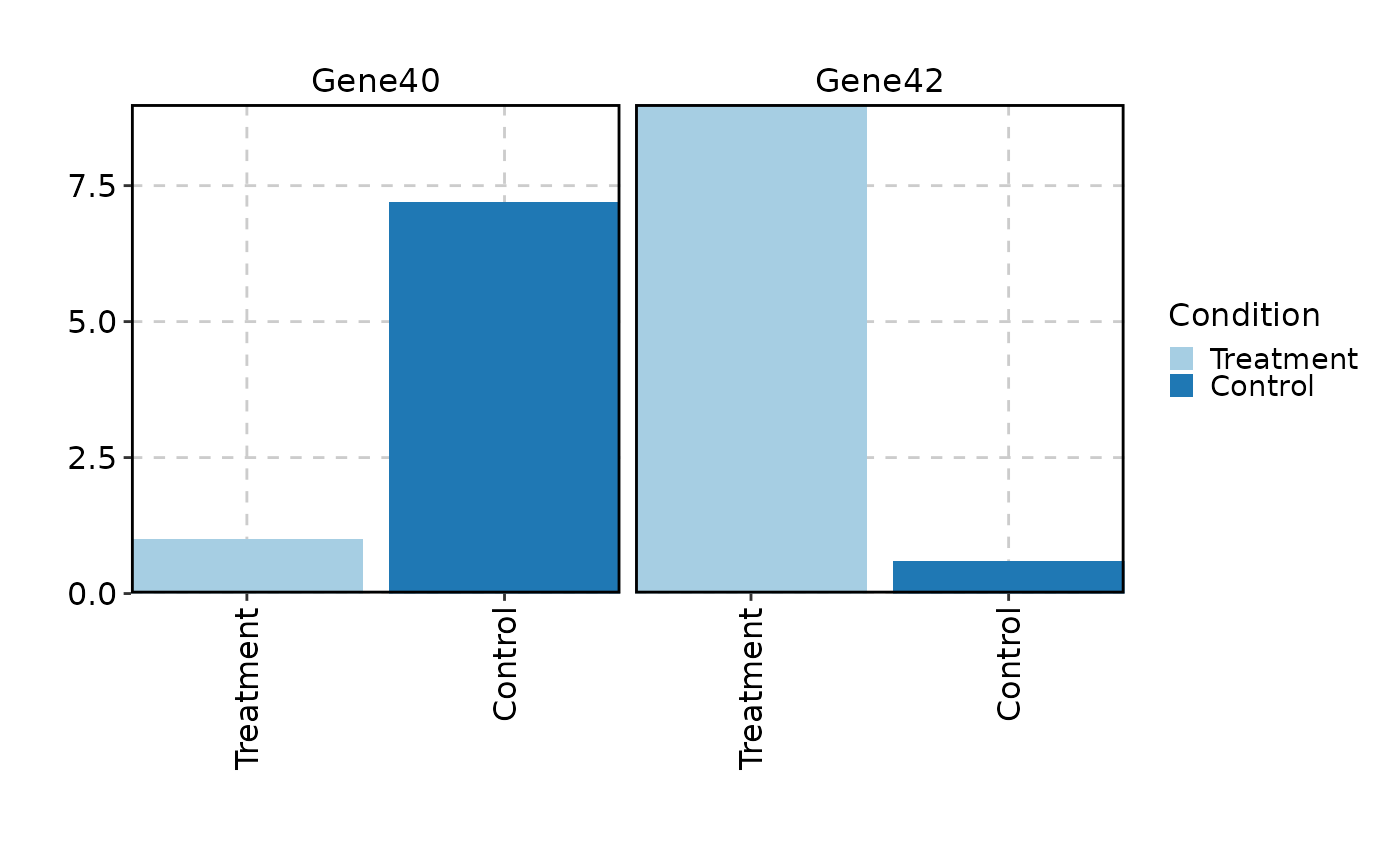
 VizBulkDEGs(degs, plot_type = "bar", genes = 2, x_text_angle = 90)
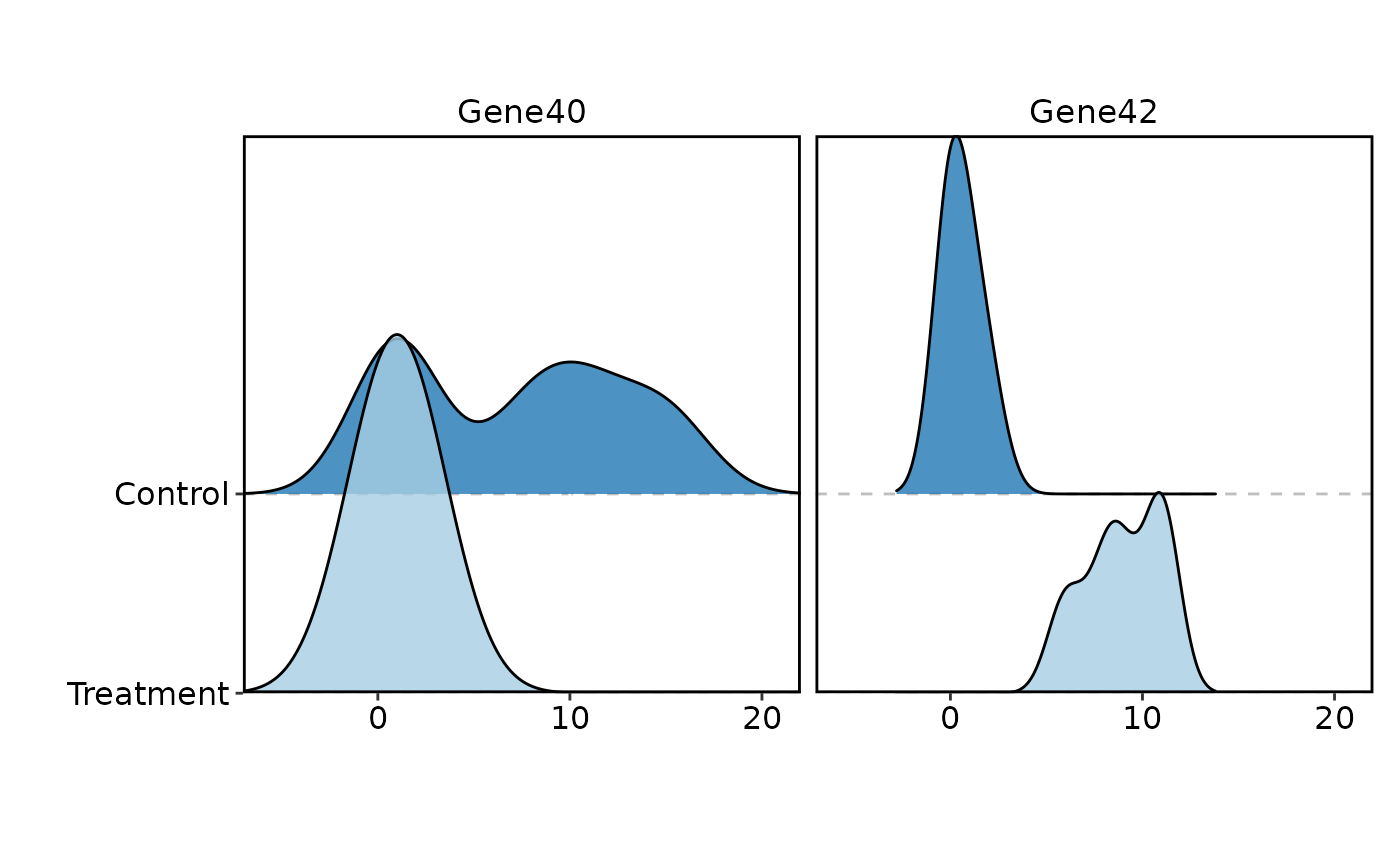
 VizBulkDEGs(degs, plot_type = "ridge", genes = 2)
#> Picking joint bandwidth of 0.935
#> Picking joint bandwidth of 2.34
#> Picking joint bandwidth of 0.935
#> Picking joint bandwidth of 2.34
VizBulkDEGs(degs, plot_type = "ridge", genes = 2)
#> Picking joint bandwidth of 0.935
#> Picking joint bandwidth of 2.34
#> Picking joint bandwidth of 0.935
#> Picking joint bandwidth of 2.34
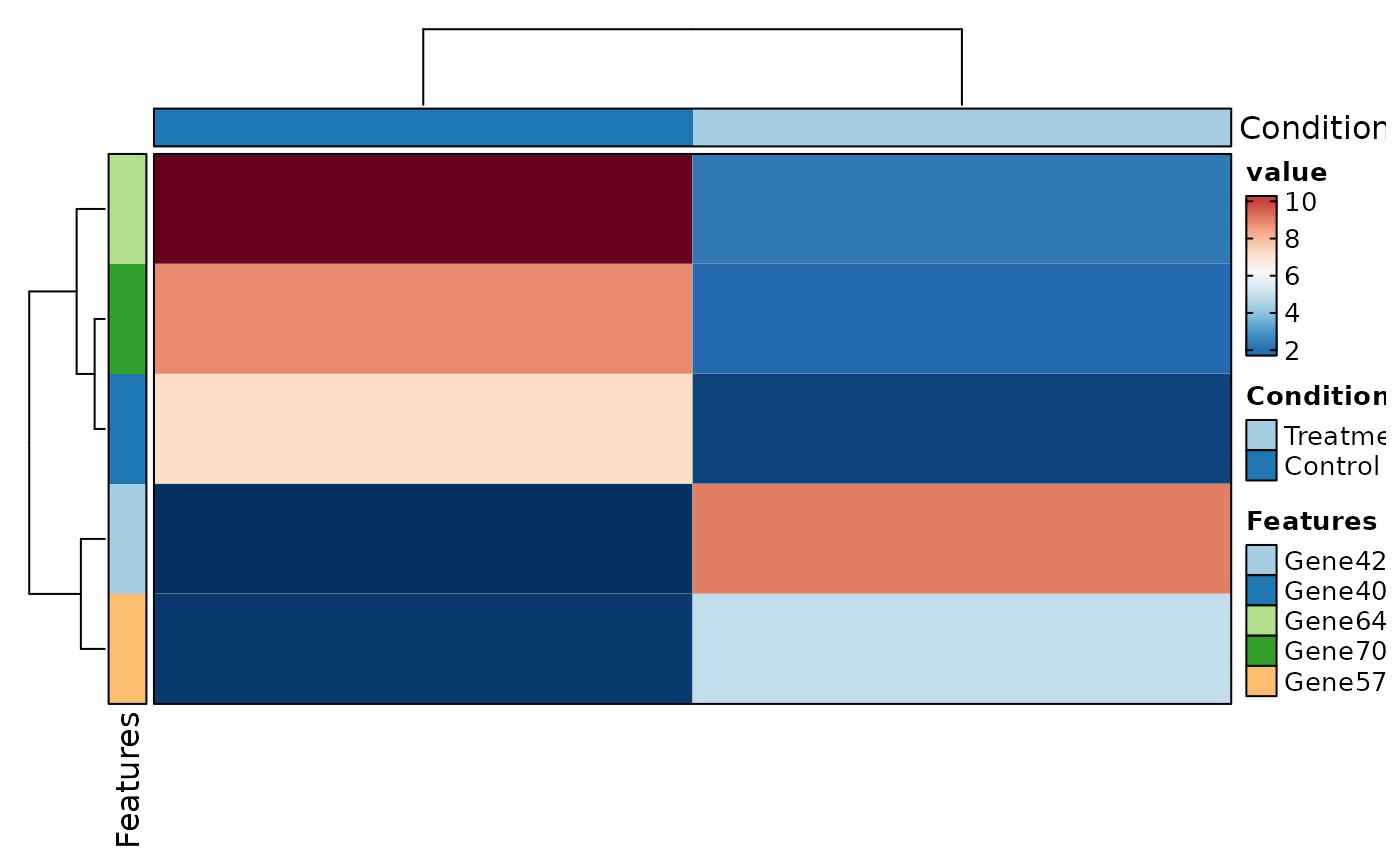
 VizBulkDEGs(degs, plot_type = "heatmap", genes = 5)
 # }
# }